Journal of Chromatography & Separation Techniques
Open Access
ISSN: 2157-7064
ISSN: 2157-7064
Short Commentary - (2015) Volume 6, Issue 6
Metabolomics deals with analysis of highly complex biological samples resulting in insufficient separation of relevant metabolites from matrix substances with one-dimensional liquid chromatography. Comprehensive twodimensional liquid chromatography (2D-LC) is a promising technique for the analysis of complex samples because of its increased peak capacity. Comprehensive 2D-LC-MS/MS has been applied for a targeted metabolomics approach regarding metabolites from RNA catabolism. Combination of a Zorbax Eclipse Plus C18 column with a Zorbax Bonus-RP column resulted in increased peak capacity, minimisation of matrix effects and excellent reproducibility.
Keywords: Comprehensive 2D-LC; Metabolomics; Mass spectrometry
The emerging field of metabolomics often deals with the analysis of highly complex matrices. Consequently, not only a capable mass spectral analysis for identification of metabolites but also a high chromatographic performance is indispensible for metabolomics studies. Therefore, new methods have to achieve increased peak capacity and reduced ion suppression in order to optimize separation power and minimize interferences between analytes. Typical metabolomics applications are often characterized by large numbers of similar analytes, which are neither easy to separate, nor too different in structure or sum formula. Therefore, it is highly required to separate them to achieve best qualitative and quantitative results. Due to similarity of many analytes, it is a challenging task to realise powerful LC separation as one dimensional LC often compromises separation of similar compounds. Comprehensive 2D-LC is the ideal tool for the analysis of complex matrices such as urinary samples. The concept of comprehensive 2D-LC is depicted in Figure 1, the transformation of chromatograms resulting from second dimension separation into a 2D-LC chromatogram in Figure 2. The main task in 2D-LC method development is to maximize peak capacity of two different separation techniques such as reversed phase and normal phase LC, while maintaining the possibility to couple these two dimensions. In theory, peak capacity of comprehensive 2D-LC separations can be estimated by multiplication of peak capacities of first and second separation dimension [1]. The multiplicity of 2D separations can be explained by the following equation:
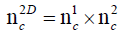

Figure 1: Concept of comprehensive 2D-LC [12].

Figure 2: Transformation of chromatograms from second dimension separation into a 2D-LC chromatogram [12].
In this equation nc1 is the peak capacity of the 2D separation. nc1 represents the first dimension and nc2 the second dimension peak capacities. In practice theoretical peak capacity is often constricted by incomplete orthogonality and undersampling. Aiming towards a maximum peak capacity, the applied separation mechanisms should be independent and peaks should be equably distributed in the 2D separation space [2]. If the separation mechanisms of the first and second chromatographic dimension show no correlation, the separation is highly orthogonal. There are different concepts to theoretically assess the orthogonality of a two dimensional separation [3-5], which can be applied for evaluation of different separation mechanisms during method development. Gilar et al. [4] developed the following equation for calculation of orthogonality based on plotting a 2D separation space and spotting data points into rectangular bins:
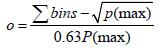
P(max) is the total number of bins and Σbins is the number of bins occupied by data points. Highest orthogonality is reached at a surface coverage of normalized separation space of 63%, lowest orthogonality at 10%. Another approach to evaluate orthogonality of a 2D separation space is based on the entropy H. With X and Y as the two dimensions of a separation, the following equation has been developed [5]:
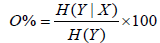
If the separation system is nonorthogonal, H(Y|X) is equal to zero. In contrast, if the separation system is fully orthogonal, H(Y|X) is equal to H(Y). Nevertheless, no agreement has been attained relating to the ideal method to calculate orthogonality. Consequently, not only different stationary and mobile phases but also pH values, gradients and modifier effects have to be evaluated during method development. Besides the possible issues with the miscibility of solvents, flow rates and timing of the ultra short analysis in the second dimension have to be optimized [6]. Especially, the sampling time is essential for 2DLC because of its effect on resolution. As short sampling times usually leads to better resolution, each first dimension peak should be sampled three to four times into the second dimension [7]. In consideration of the wide concentration range of metabolites in biological samples, choosing the optimal sampling time can be challenging.
For 2D-LC-MS/MS experiments, following instrumentation was applied [8]: 1290 Infinity Quaternary Pump (G4204A), 1290 Infinity Binary Pump (G4220A), 1290 Infinity Autosampler (G4226A), 1290 Thermostat (G1330B), 1290 Infinity Valve Drive (G1170A) with 2pos/4- port Duo Valve (Figure 3), 6460 triple quadrupole mass spectrometer (Agilent, Waldbronn, Germany) equipped with electrospray ionization source (Agilent Jet Stream).

Figure 3: Schematic depiction of the valve/loop configuration (blue: first dimension; red: second dimension).
Final chromatographic gradient (1D): 0-20 min, 2% B; 20-45 min; 2-30% B; 45-65 min, 30% B; 65-75 min, 30-50% B; 75-85 min, 50-75% B; 85-90 min, 75% B; 90.1 min, 2% B.
Following MS settings were applied: capillary voltage, 4000 V; nozzle voltage, 500 V; gas temperature, 300°C (7 l/min); sheath gas, 350°C (7 l/min); nebulizer pressure, 50 psi. Positive ionization mode was applied with a step size of 0.1 amu, threshold of 0 and cell accelerator voltage of 7 V at centroid data storage.
For data acquisition and post processing following software was applied: Agilent MassHunter Workstation Data Acquisition B.04.01; Agilent OpenLab CDS ChemStation 2D LC A.01.05; Agilent MassHunter Qualitative Analysis B.04.00; LCxLC-HRMS Version 2.4b2 (GC Image, Lincoln, Nebraska, USA); Interface Suite™ v 4.11 (United States Environmental Protection Agency, Washington, DC, USA).
Modified nucleosides from RNA metabolism can occur in different, highly complex biological matrices, e.g. urine [9], blood [10], cell culture supernatants [11]. Consequently, we have established a 2D-LC method coupled to a triple quadrupole mass spectrometer, aiming towards maximization of peak capacity and minimization of matrix effects. We have analysed different urinary samples of healthy volunteers which have been prepurified by application of phenylboronic acid affinity chromatography [11] resulting in purification of cis-diols. In 2D-LC analysis the effluent from the first chromatographic dimension was alternately transferred to two identical 80 μl loops and further analysed on the second dimension column (Figure 3). Alternate loop filling was achieved by switching the 2-position/4-port valve. Combination of an Eclipse Plus C18 (150 × 2.1 mm, 1.8 μm) in the first and a Zorbax Eclipse XDB-C18 (50 × 3 mm, 1.8 μm) in the second dimension (Figure 4a) lead to an additional separation of some target compounds (Box in Figure 4a) and separation of numerous matrix substances. Aiming towards enhanced orthogonality of separation, we combined a Zorbax SB-Aq (100 × 2.1, 3.5μm) and Zorbax Bonus-RP (50 × 3 mm, 1.8 μm pore size) column as a combination with more different chromatographic selectivity. We observed an increased separation in the second dimension (Box in Figure 4b), but still an inadequate overall peak capacity. In order to increase the separation in the second dimension we aimed towards minimization of the injection volume from the first chromatographic dimension onto the second dimension in relation to the second dimension column volume which is crucial in 2D-LC. This can be realized either by choosing a lower solvent flow in the first dimension or a higher second dimension column volume. To achieve this goal, we coupled the Eclipse Plus C18 (150 × 2.1 mm, 1.8 μm) with a Zorbax Bonus-RP (50 × 4.6 mm, 1.8 μm) in the second chromatographic dimension. For the second dimension we applied shifted gradients with an analysis time of 54 s at high flow rate (2.5 ml/min). Altogether, we detected up to 29 compounds from RNA metabolism and cross-linked pathways in urinary samples (Figure 5). Detection has been executed in full scan, neutral loss scan and multiple reaction monitoring. Exemplary, the MS/MS spectrum of N6-Threonyl-carbamoyladenosine is depicted in Figure 6. Application of 2D-LC-MS/MS has shown increased peak capacity and adequate reproducibility in repeated measurements. Eventually, application of 2D-LC has great potential for metabolomics in due consideration adequate column orthogonality and dimensions.

Figure 4: Urinary sample analyzed by 2D-LC-MS with a) Eclipse Plus C18 and Zorbax Eclipse XDB-C18 b) Zorbax SB-Aq and Zorbax Bonus-RP (black arrows: target compounds, peak numbers are summarized in Table 1 / red arrows: unknown compounds).

Figure 5: Urinary sample analyzed by 2D-LC-MS/MS with Eclipse Plus C18 and Zorbax Bonus RP column in MRM scan mode (Peak numbers are summarized in Table 1).

Figure 6: Urinary sample analyzed by 2D-LC-MS/MS with Eclipse Plus C18 and Zorbax Bonus RP column in MRM scan mode (Peak numbers are summarized in Table 1).
| Peak No.(Figure 2a) | Peak No.(Figure2b) | Peak No. (Figure 3) | Compound | Formula | [M+H]+ [m/z] | MRM transitions (Quantifier / Qualifiers) [m/z] | Frag-mentor [V] | Collision Potential [V] |
|---|---|---|---|---|---|---|---|---|
| 1 | 1-Ribosyl-imidazolenicotinamide | [C11H15N2O5]+ | 255.1 | 123.1 / 106.1, 80.1, 78.1 | 100 | 10 / 20, 40, 40 | ||
| 2 | 2 | 2 | 1-Ribosylimidazole-4-acetic acid | C10H14N2O6 | 259.2 | 127.1 / 109.1, 81.1, 54.1 | 100 | 10 / 30, 40, 50 |
| 4 | 4 | 3 | 5,6-Dihydrouridine | C9H14N2O6 | 247.2 | 115.2 / 97.1, 73.2, 55.2 | 70 | 5 / 17, 17, 25 |
| 1 | 1 | 4 | Cytidine | C9H13N3O5 | 244.2 | 112.2 / 95.1, 69.2, 67.2 | 80 | 5 / 45, 41, 60 |
| 3 | 7 | 5 | Pseudouridine | C9H12N2O6 | 245.2 | 209.2 / 155.2, 125.1, 82.1 | 100 | 4 / 5, 13, 29 |
| 5 | 3 | 6 | 3-Methylcytidine | C10H15N3O5 | 258.2 | 126.1 / 109.1, 95.1, 66.1 | 100 | 10 / 40, 40, 60 |
| 6 | 5 | 7 | 1-Methyladenosine | C11H15N5O4 | 282.2 | 150.2 / 123.2, 108.2, 94.2 | 110 | 13 / 45, 60, 45 |
| 8 | 6 | 8 | 3-(3-Amino-carboxypropyl)-uridine | C13H19N3O8 | 346.2 | 214.1 / 197.1, 168.1, 113.1 | 100 | 10 / 20, 20, 40 |
| 7 | 9 | 9 | 5-Aminoimidazol-4-carboxamid 1-β-D-Ribofuranosid | C9H14N4O5 | 259.2 | 127.2 / 110.1, 82.2, 55.2 | 80 | 5 / 21, 49, 60 |
| 10 | Uridine | C9H12N2O6 | 245.2 | 113.1 / 96.1, 70.1, 57.1 | 70 | 9 / 33, 33, 25 | ||
| 9 | 10 | 11 | Guanosine | C10H13N5O5 | 284.2 | 152.2 / 135.1, 110.1, 55.1 | 70 | 9 / 41, 41, 60 |
| 10 | 11 | 12 | 1-Ribosyl-pyridin-2-one-5-carboxamide | C11H14N2O6 | 271.2 | 139.1 / 122.1, 94.1 | 100 | 10 / 30, 60 |
| 11 | 12 | 13 | Adenosine | C10H13N5O4 | 268.2 | 136.4 / 119.4, 94.3, 92.3 | 100 | 13 / 49, 49, 60 |
| 12 | 8 | 14 | Isoguanosine (ISTD) | C10H13N5O5 | 284.2 | 152.2 / 135.1, 107.1, 57.2 | 110 | 13 / 41, 57, 33 |
| 15 | Inosine | C10H12N4O5 | 269.2 | 137.3 / 119.2, 110.2, 55.3 | 60 | 4 / 45, 45, 68 | ||
| 13 | 13 | 16 | 1-Ribosyl-pyridin-3-one-4-carboxamide | C11H14N2O6 | 271.2 | 139.1 / 122.1, 94.1 | 100 | 10 / 30, 60 |
| 15 | 15 | 17 | 1-Methylguanosine | C11H15N5O5 | 298.2 | 166.2 / 149.1, 135.1, 110.1 | 100 | 9 / 41, 45, 49 |
| 18 | Xanthosine | C10H12N4O6 | 285.2 | 153.2 / 136.1, 57.2, 55.2 | 60 | 4 / 33, 25, 25 | ||
| 14 | 16 | 19 | 1-Methylinosine | C11H14N4O5 | 283.2 | 151.1 / 110.1, 94.1, 82.1 | 80 | 10 / 40, 40, 50 |
| 17 | 14 | 20 | N2,N2,7-Trimethylguanosine | C13H19N5O5 | 326.2 | 194.2 / 149.1, 124.1, 55.2 | 70 | 9 / 45, 45, 68 |
| 19 | 21 | 6-Methyladenosine | C10H14N2O6 | 282.2 | 150.2 / 123.2, 94.2, 57.2 | 130 | 13 / 49, 49, 45 | |
| 16 | 17 | 22 | N2-Methylguanosine | C9H14N2O6 | 298.2 | 166.2 / 149.1, 110.1, 57.2 | 90 | 9 / 37, 45, 60 |
| 18 | 18 | 23 | N4-Acetylcytidine | C9H13N3O5 | 286.2 | 154.1 / 112.1, 95.1, 69.1 | 80 | 5 / 25, 57, 53 |
| 19 | 20 | 24 | N2-N2-Dimethylguanosine | C9H12N2O6 | 312.2 | 180.1 / 135.1, 110.1, 46.1 | 100 | 10 / 40, 40, 40 |
| 20 | 21 | 25 | N6-Succinyloadenosine | C10H15N3O5 | 384.2 | 252.1 / 162.1, 136.1, 119.1 | 100 | 10 / 40, 30, 60 |
| 21 | 22 | 26 | 5-Deoxy-5-methylthioadenosine | C11H15N5O4 | 298.2 | 136.2 / 119.1, 75.2, 61.2 | 90 | 13 / 57, 33, 33 |
| 22 | 23 | 27 | N6-Threonyl-carbamoyladenosine | C13H19N3O8 | 413.2 | 281.1 / 162.1, 136.1, 119.1 | 100 | 10 / 20, 30, 60 |
| 23 | 24 | 28 | N6-Methyl-N6-threonylcarbamoyladenosin | C9H14N4O5 | 427.3 | 295.1 / 150.1, 94.1 | 100 | 5 / 25, 60 |
| 24 | 29 | 2-Methylthio-N6-threonylcarbamoyladenosine | C9H12N2O6 | 459.2 | 327.1 / 208.1, 182.1, 134.1 | 100 | 10 / 30, 30, 60 |
Table 1: Compound setup.
The developed 2D-LC-MS/MS method enabled the separation of numerous analytes, which can easily interfere with each other and enabled the identification of all target substances in a single run. The additional separation reduces interferences and allows a stable robust analysis for investigation of metabolic signatures.