Journal of Chromatography & Separation Techniques
Open Access
ISSN: 2157-7064
ISSN: 2157-7064
Research Article - (2016) Volume 7, Issue 2
Multicollector ICP-MS was used to comprehensively analyze different types of isotopically modified glass created to investigate the processes of glass corrosion in the water. Analytical methods were developed for the analyses of synthesized, isotopically modified solid glass and the release of glass constituents upon contact with deionized water. To validate the methods, results from an acid digestion sample of the Analytical Reference Glass showed good agreement when compared to data from multiple prior analyses on the same glass [1]. In this paper, we present the results of the comprehensive analysis of the acid digestion of six types of isotopically modified glass and the release of glass constituents into water corrosion after one year of aqueous corrosion.
Keywords: Isotopically modified glass; Multicollector; Isotopic ratios; Water corrosion
ARG: Analytical Reference Glass; DSN: Desolvating Nebulizer; HR: High Resolution; ICP: Inductively Coupled Plasma; IS:Internal Standard; LA: Laser Ablation; MC: Multicollector; MS: Mass Spectroscopy; RR: Round Robin.
Vitrification is used by many countries to immobilize radioactive wastes due to the technical reliability of the process and long-lasting stability of the material. Nevertheless, glass can corrode in aqueous environments over long time periods. To investigate the mechanisms of glass corrosion in water, experiments were conducted in which coupons of glasses with nominally equivalent chemical compositions but two different isotopic ratios were immersed in 90°C water for extended times. Periodically, small aliquots of solution were sampled and analyzed. After a certain period of time, the coupon solutions were swapped, effectively creating a system in which the chemical composition of the solution was unchanged but in which the isotopic differences enabled tracking of the provenance of ions into and out of the corroding glass systems. To be specific, the diffusion and exchange of ions between solid and liquid phases is measurable if there is a way to distinguish between ions in the solid phase, either from the pristine glass or from alteration layers formed as a result of aqueous corrosion, and those in solution.
Glass is one of the most difficult objects for elemental analysis because of its complexity and the presence of many elements in high concentrations that can produce interferences with the detection of other elements in lower concentrations. In recent years, Laser ablation inductively coupled plasma-mass spectroscopy (LAICP- MS) has been considered the method of choice for elemental analyses of solid glass samples [2,3]. The LA-ICP-MS method does not require time- and labor-consuming sample preparation; it can be conducted on relatively low-volume samples with satisfactory levels of accuracy and precision. Although, as we can see from Trejos et al. [2,3] the level of precision for the LA-ICP-MS method (~10%) is noticeably higher than the precision normally achieved in the liquid solution aspiration ICP-MS method (0.1-1.0%). In our isotope substitution study, we had very limited amounts of each glass type and needed to analyze the full content of the small glass samples with a simple sample preparation. Simple sample preparation techniques were developed and the solid glass and solutions in acidic water were analyzed by three different methods: 1) isotopic ratio analysis for seven elements with modified isotopic ratios: Li, B, Si, Ca, Fe, Zn, and Mo; 2) compositional analysis of all elements of interest in the glass; and 3) group analysis of five selected elements of interest, where the combination of elemental and isotopic methods was used. During the method development, Analytical Reference Glass (ARG) was used as a model sample. The composition of ARG had previously been analyzed by seven different laboratories during six rounds of round-robin tests [1]. A wide range of analytical procedures have been used by the participating laboratories, including atomic absorption spectroscopy, inductively coupled plasma-atomic emission spectroscopy, direct current plasma-emission spectroscopy, and ICP-MS techniques. The consensus average relative error for round-robin tests 1 through 6 was 5.4%, with values ranging from 9.4 to 1.1%. The results of our ARG analyses are in good agreement with previously reported results of the round-robin research.
Instrumentation
The instrument used in our study was a multicollector (MC) ICP-MS Nu Plasma HR (Nu Instruments, Wrexham, UK) fitted with a desolvating nebulizer (DSN) (Aridus II, CETAC, NB, USA). The MC is equipped with 14 Faraday cups and 3 ion counters. The use of the Aridus II was essential because it accounts for much lower molecular ion interferences relative to the use of wet plasma. The sampler cone and the skimmer cone diameters for dry plasma were 0.9 mm and 0.6 mm, respectively. Aridus II was used in all analyses, except the analyses for boron. Typical instrument and acquisition settings have had relatively small variations from one element to another and are listed in Table 1.
| HR MC-ICP-MS Settings | |
|---|---|
| Forward power | 1050−1300 W |
| Coolant gas | 13−14 L/min |
| Auxiliary gas | 1.2−2.0 L/min |
| Nebulizer pressure | 33−39 psi |
| Resolution | 400 |
| Aridus II Desolvating Nebulizer Settings | |
| Sweep gas flow | 4−6 L/min |
| Spray chamber | 110°C |
| Desolvator | 160°C |
| Solution introduction rate | 150−200 μL/min. |
Table 1: Instrument and acquisition settings for the Nu Plasma HR MC-ICPMS (the optimal setting values change from day to day).
Sample preparation
The amounts of glass material available for analysis were very small-a few hundreds of milligrams. Therefore, there was no possibility for replicate sample preparations with fractionations. The glass was ground before digestion. The 20-100 mg samples of glass were digested first with 1 mL of concentrated HF with 0.1 g of mannitol at 50°C for 48 hr. After digestion, the samples were evaporated to 25-75 μL of liquid and further digested with 1 mL of concentrated HNO3 at 50°C for 9 hr. After the second digestion, 15 mL of deionized water was added to the digests and the solutions were sonicated. This was considered a stock solution, which were diluted 200-10,000 times for various analyses.
Mannitol plays a significant role by retaining the boron in solution, as was mentioned in Ref. [4]. In addition, the results of Ref. [5] indicated that the addition of mannitol and proper control in the evaporation process were effective in preventing the loss of several other elements, including Ti, Ge, Sn and Sb. In Ref. [6], the authors suggest that closed-vessel microwave digestion and H3PO4–HNO3–HF reagents may limit boron volatilization during both digestion and subsequent acid-drying processes. We have also found that the presence of mannitol is essential for preventing the loss of Si. The losses of Si in the absence of mannitol were observed to be in the range of 20-50%.
ARG also was used to evaluate the fusion method as an alternative to the acid digestion method [7]. The analytical results for the fusion method in the experiments done with ARG turned out to be unsatisfactory: the sample dissolutions were significantly contaminated by the impurities in the fusion reagents and some of the elements exhibited poor recoveries.
Standards
For quantitative and isotopic analyses, separate standards with natural ratios for each element at 1000 ppm concentration were used (High Purity Standards, SC, USA). The natural isotopic ratios of the standards were confirmed when the samples with natural isotopic ratios were analyzed after calibration and determination of mass bias factors. The difference in the isotopic ratios of interest between the standards and the samples with presumably natural ratios did not exceed 0.2%, which was sufficient for the work conducted in this experiment.
As a control, two glasses with the same nominal composition but natural isotopic ratios were also tested under the same corrosion conditions as the isotopically modified samples. It was confirmed that, despite the growing concentration of all elements in the water solution during the experiments, the isotopic ratios of the elements of interest remained natural for two non-modified glasses. This fact confirms the validity of the method, indicating that the correct isotopic analyses are possible even in such complex mixtures without significant interferences from other elements.
During the method development, the Internal Standard (IS) method for quantitative analyses was attempted through the addition of an IS, containing eight elements: Bi, Ho, In, Lu, Rh, Sc, Tb, and Y (High Purity Standards, SC, USA). In order to cover the low side of the mass scale, Be was also added to this standard. The routine external standard method does not work accurately for ICP-MS analyses because of the instability of the flow rate of the solution and corresponding change of the MS response.
With the IS method, aliquots of IS solution were added to both the analyzed solution and the CalibrationStandard so that the concentration of the IS was 20 ppb in both. The closest IS was used for the quantitation of the analytes. For example, Be was used for quantitation of Li, Sc was used for quantitation of Ca, etc. It was found that, although in many applications such an approach can work, in comprehensive glass analyses the implementation of this method is problematic. The reason is that IS contains some elements in relatively low concentrations, which we have to analyze in the glass, and glass samples contain some elements of IS.
Therefore, the use of an External Standard method was required, and for more accurate analyses every sample was bracketed with two Calibration Standard runs, before and after the sample. The bracketing compensates very significantly for the drift of flow rate of the DSN and, accordingly, for the drift of MS response. As a result of this approach, the accuracy of our quantitative elemental analyses was typically in the range of 2-5%.
The isotopic ratios of some of the elements in water changed by 2-3 orders of magnitude over the course of these experiments. Therefore, the requirement for isotopic analysis accuracy was not as strict and the mark was set at 1%. In most cases, our accuracy significantly exceeded the requirements. When the signals from the isotope ions were comparable in value and significantly exceeded the background level, like for Li and Mo, our accuracy was better than 0.1% and precision was in the range of 0.01%.
Zinc and iron were present in the solutions in much lower concentrations than other elements of interest. For Zn and Fe, when the intensities of measured ions were in 1 × 10⁻³ – 1 × 10⁻⁴ V range, the precision and accuracy for isotopic ratios were significantly lower and in the range of 2-3%.
Background
The MS reading for a certain m/z value, when only the blank solution of 2% HNO3 is aspirated, is considered a background or zero-point baseline. It consists of elements present in the Milli-Q water and nitric acids used in the process of preparing 2% nitric acid as well as some single atom or polyatomic interferences (e.g., ArO for 56Fe). Whatever it is, we use on-peak zeros when we measure the signal in the 2% nitric acid blank solution, save it in the memory, and subtract it from the signal measured during the standard or sample runs. In cases when the background was more or less substantial (in other words, was significantly higher than the off-peak background, as for example, for Li and B), the sample dilution was adjusted such that the signal from the measured element was much higher than the ever-changing background. In this way, the effect of the instability of the background on the results is minimized. For Li, for example, the samples were diluted so that the measured value for 7Li was in the region of 2-5 V. The background peak for 7Li was in the region 2-5 × 10⁻³ V. It is obvious that the observed changes in the background-in the range of 5 × 10⁻⁵ to 2 × 10⁻⁴ V-could not have significant effect of the final results of the analyses.
Li isotopic analyses
For Li analyses, two Faraday cup detectors on opposite sides of the detector array were used: L4 and H6 (Table 2). Other Faraday cups (H5-H1 and L1-L3) and ion counters (IC0-IC2 detectors) were not used in this work.
 |
Table 2: Detector layout for Li analysis.
The tuning parameters of MS for Li isotopic analyses are rather extreme, because Li is on the lower limit of the mass range of MS. The electronic lenses of MS are involved, which are not normally involved in the tuning for other elements. Once tuning values are determined, it is important to keep once found tuning values saved in the tuning file.
The most important part of Li isotopic and quantitative analyses is the minimization of the background, which consists of Li impurities present in acid and water used in preparation of solutions, some scattered ions, and C2+ and N2+ [8]. The problem is that when minimizing the interferences the sensitivity of the system decreases. Therefore, a compromise between minimization of the background and optimization of sensitivity must be found.
The DSN, Aridus II, is also used for Li analyses. Normally, for other elements, we use a QuickWash attachment with a 5% HNO3/0.02% HF washing solution to wash the previous analytical run materials from the system, This washing solution cannot be used for Li analyses, because when we use it the background rises significantly and does not diminish for a few minutes. Instead of an acid solution, pure Milli-Q water was used for quick removal of Li from the spray chamber of the DSN.
One of the main sources of instability in Li and other element isotopic ratio measurements is the instability of the DSN flow rate. This instability causes changes in the mass bias correction factor. Although our method of bracketing the sample with two standards runs partially compensates for this instability, stabilizing the solvent flow rate can significantly increase the accuracy of analyses. Currently, the DSN uses the self-aspiration mode for delivering solvent into the MS.
Boron isotopic analysis
Boron cannot be analyzed with the DSN because of losses in the process of desolvation, so the direct self-aspiration method was used. The same detector layout was used for B as for Li (Table 3).
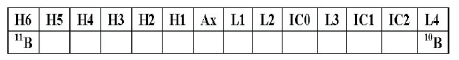 |
Table 3: Detector layout for B analysis.
The main problem with boron analyses is the very slow washout from the spray chamber of the MS. According to Ref. [6] and Ref. [9], the use of 2% ammonia as the rinse solution may effectively eliminate memory effects and accelerate the washout of boron during ICP-MS analysis. We have found that maintaining the spray chamber at room temperature, when Peltier is turned off, can reduce washout time by approximately 50%.
Silicon isotopic analyses
Isotopic analyses of silicon are complicated by the presence of polyatomic interferences such as 14N2+ and 12C16O+ for 28Si, 14N2 1H+ and 12C16O1H+ for 29Si, and very strong 14N16O+ and some minor interferences like 60Ni2+ for 30Si [10,11]. It is possible, by using higher resolution and a 0.05 mm source slit, to partially resolve 30Si+ from 14N16O+. The interferences for 28Si+, 29Si+, and 30Si+ are minimized by adjusting the parameters of the DSN, mostly sweep gas flow rate. Interferences measured during the blank run are subtracted from the measurements obtained during the sample or standard run. As one can see, the proper conditions for the DSN allow for a nearly complete elimination of interferences for 29Si and 30Si. It is worthwhile to mention that we do not use nitrogen as makeup gas for DSN, which is recommended to be added at a small rate to the flow Ar to reduce the noise and increase the response of MS. The absence of nitrogen in this particular case is partially responsible for minimizing the interferences. Previously, the reduction of 90% of polyatomic interferences for Si by the Aridus II DSN compared to wet plasma was reported [10]. In our experiments, the reduction of interferences is estimated to be two orders of magnitude as compared to the wet plasma. As shown in Figure 1, the total coincidence of all peaks was not required, which is different than our typical procedure for most elements. Calcium is a good example of good coincidence of all peaks (Figure 2). In the case of Si, the peaks were adjusted in such a way that only part of the flat top of 30Si coincided with 28Si and 29Si, leaving the part of peaks affected by the interference aside.

Figure 1: Analysis of Si. Top: 400 ppb of Si natural; L4- 28Si (purple), Ax- 29Si (blue), H6- 30Si (dark). Bottom: 10 ppb of Si with interferences. Intensities for each ion are shown in small boxes against every Faraday cup.

Figure 2: Analysis of Ca. Top: 400 ppb of Ca natural; L2- 42Ca (grey), H3- 43Ca (orange), H6- 44Ca (dark). Bottom: interferences. Intensities for each ion are shown in small boxes against every Faraday cup. Interferences are given on the scale of 0.002 V, which is magnified 100−1000 times compared to the standard.
The bottom part of Figure 1 shows the analysis of 10 ppb with interferences. This is not the optimal tuning of MS for Si. These interferences can be reduced significantly by adjusting the parameters of MS and DSN. This condition was chosen for demonstration that even in the presence of relatively high interferences one can do isotopic analyses using the left part of the peaks free of interferences.
Ca isotopic analysis
Calcium is one of the elements most difficult to analyze using ICP-MS methods because of significant interferences for practically all Ca isotopes. 40Ca+ has a very strong interference from 40Ar+, 42Ca+ is affected by 40Ar1H2+ and 14N3+, 43Ca is influenced by 27Al16O and 14N3 1H+, and 44Ca is influenced by 12C16O2, 14N2 16O and 28Si16O [11,12]. Because of the abundance of Ar in the plasma, the influence of 40Ar on 40Ca is so strong that in normal conditions it is practically impossible to analyze 40Ca. It is possible, though, when the RF Power is low and we work with cold plasma. In this case, the 40Ca signal can be measured at the top of the 40Ar peak. This method has been described in the literature [13] and the results are satisfactory for some applications. The shortcoming of this approach is its relatively low sensitivity and we could not afford it in our experiments. We have used hot plasma and concentrated our efforts on measuring 42Ca/44Ca and 43Ca/44Ca ratios. In these experiments, the analyzed mixtures contained natural Ca and isotopically modified Ca, the ratios of which were known. In these circumstances, knowledge of 42Ca/44Ca and 43Ca/44Ca allows for simple calculations of 42Ca/40Ca, 43Ca/40Ca, and 44Ca/40Ca ratios, which were essential for the experiments. Figure 3 demonstrates the analysis of the 400 ppb Ca standard and shows interferences on different scales, because the interferences are 100-1000 times lower in intensity than in the Ca isotope readings. The interferences are minimized by optimizing the parameters of the plasma and AridusII DSN.

Figure 3: Analysis of Fe. Top: 400 ppb of Fe natural; L4- 54Fe (purple), Ax- 56Fe (blue), H3- 57Fe (orange). Bottom: interferences. Intensities for each ion are shown in small boxes against every Faraday cup. Interferences are given on the scale of 0.001 V, which is magnified 100−1000 times compared to the standard.
Iron isotopic analyses
The problems associated with isotopic analyses of iron are related to strong interferences from Ar40O16+ for 56Fe+ and Ar40N14+ for 54Fe+ [14,15]. The molecular mass of Ar40O16 is so close to 56Fe that the maximum resolving power available is required. For these purposes, the source slit is set up in middle position (0.05 mm slit) and alpha slits are set up in the positions: α1=65 and α2=75. The ratio of interest was 57Fe/56Fe, but the ratio 54Fe/56Fe was also measured. This ratio is strongly affected by the presence of 54Cr in the solution [15] so the data obtained for this ratio were not used in the final analysis.
Zn and Mo isotopic analysis
Compared to Ca, Si, and Fe isotopic analyses, the Zn and Mo isotopic analyses are much more straightforward. The detector layouts for Zn and Mo are shown in Tables 4a and 4b.
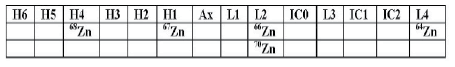 |
Table 4a: Detector layout for Zn analyses. Mass separation: 0.333. Two cycles are implemented with 70Zn measured in the second cycle.
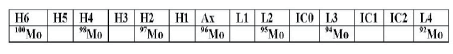 |
Table 4b: Detector layout for Mo analyses. Mass separation: 0.5. All isotopes are analyzed in one cycle.
The significant ratios for the experiments were 68Zn/64Zn for Zn and 95Mo/98Mo for Mo, although other ratios, such as 66Zn/64Zn, 67Zn/64Zn, and 70Zn/64Zn for Zn and 92Mo/98Mo, 94Mo/98Mo, 96Mo/98Mo, 97Mo/98Mo and 100Mo/98Mo for Mo have been measured.
Group analysis
During the experiment, a group of five elements (La, Ba, Ce, Pr, Nd) had to be analyzed quantitatively with accuracy better than the accuracy of elemental analyses, but they did not require isotopic analyses. For this purpose, we developed a method we term “group analysis.” Normally, MC-ICP-MS has two different modes of analyses: isotopic and elemental. As mentioned before, when using the elemental method the peaks are quickly scanned from the bottom to the top, but there is no centering on the middle of the peak. For the above-mentioned elements, we used the isotopic mode with centering on one of the peaks of one isotope of every element with five different cycles and the detector layout shown in Table 5. This allowed for quick elemental-mode-like jumps from one element to another with the advantage of using the centering made possible by using the isotopic method.
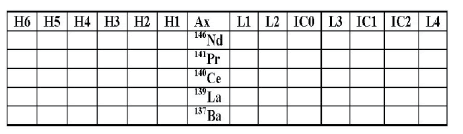 |
Table 5: The detector layout for group analysis.
It is possible to run these kinds of analyses in two or three cycles [16] by involving detectors other than Ax Faraday cups. However, it was decided to use this slower method to allow for precise centering on every chosen isotope.
Elemental analysis
In the elemental analysis mode, only the central Faraday cup (Ax) is used and the system quickly jumps from one isotope peak of a certain element to the isotope peak of another element. The scan rate is 1000 ms/amu and the dwell time is 2 s. Unlike in isotopic analyses, where the MS has the ability to find precisely the center of the peak, the accurate centering of every peak is unavailable in the elemental analysis. Therefore, it is important to calibrate the mass scale very accurately.
To do so, two different standards are used: 1) the IS, containing eight elements: Bi, Ho, In, Lu, Rh, Sc, Tb, Y (High Purity Standards, SC, USA) and 2) the ICP-MS standard, containing 68 elements (High Purity Standards, SC, USA). Beryllium is also added to the IS to cover the low side of mass scale. The IS provides a 9-point mass range calibration, followed by the ICP-MS standard, which provides a 66-point calibration. The concentration of the ICP-MS standard is 10 ppb, and it is used also as a quantification standard.
After the mass scale is calibrated, and the AridusII and MS are thoroughly washed, the blank sample (2% HNO3) is run. After the blank sample is run, the background values, obtained during the zero run, are subtracted from the standard and from the sample values. The blank cannot be run before the standard, because the precise mass range calibration is not available before the standard is run.
The actual results of the isotope substitution studies will be reported separately in a paper dealing specifically with what those findings reveal about the mechanisms behind long-term glass corrosion. As an example, however, the results for boron are presented here. The measured value of 10B/11B as a function of time is presented in Figure 4 for the two non-exchanged solutions (SN1-7 and SE1-7) and their exchanged counterparts (SN8-14 and SE8-14). The initial 10B/11B ratios for both the enriched samples (SE1-7 and SE8-14) and the non-enriched samples (SN1-7 and SN8-14) are also presented as solid lines to lead to the eye. As expected, the 10B/11B ratio for the non-exchanged samples remains relatively constant throughout the duration of experiment. On the other hand, the 10B/11B ratio for the exchanged samples changes dramatically, by roughly two orders of magnitude, following the exchange of the two solutions containing the different boron isotopic signatures. After the solution exchange, the glass coupons continue to corrode and the 10B/11B ratio slowly evolves as a greater amount of either enriched or non-enriched boron is leached into the contacting solution.

Figure 4: The 10B/11B ratio as a function of time for the non-exchanged samples (SN 1-7 and SE 1-7) and the exchanged samples (SN 8-14 and SE 8-14).
Table 6 shows a comparison of the results of our analysis of ARG glass and the results of the round-robin test. The average difference for the concentrations of the element oxides between the round-robin (RR) results and ours is 0.80%. The results for each element were calculated as a percentage of the mass of each element oxide relative to the total sample mass. In theory, if the results are correct, the sum of all results for all of the elements should be close to 100%, depending on the accuracy of the analytical method. As can be seen from in Table 7, the total sum for the RR tests was 99.48% while the results from this study total 100.92%. It appears that sensitivity of our method was somewhat higher than the RR test and we were able to quantify more elements.
| Concentration Mass% Oxide | Difference, % | |||
|---|---|---|---|---|
| Round Robin | This Research | |||
| Isotopic Method |
Elemental Method |
|||
| Ag2O | nd | |||
| Al2O3 | 4.66 | 4.20 | -9.87% | |
| As2O3 | 0.0006 | |||
| B2O3 | 8.54 | 8.34 | -2.34% | |
| BaO | 0.09 | 0.078 | ||
| BeO | 0.005 | |||
| Bi2O3 | 0.0001 | |||
| CaO | 1.42 | 1.524 | 7.32% | |
| CdO | ||||
| CeO2 | 0.0013 | |||
| CoO | 0.0068 | |||
| Cr2O3 | 0.1 | 0.1038 | 3.84% | |
| Cs2O | 0.0008 | |||
| CuO | 0.01 | 0.0059 | ||
| Er2O3 | ||||
| Eu2O3 | ||||
| Fe2O3 | 14.02 | 15.05 | 7.35% | |
| Ga2O3 | 0.011 | |||
| Gd2O3 | ||||
| HfO2 | 0.0026 | |||
| K2O | 2.68 | 2.48 | -7.46% | |
| La2O3 | 0.0006 | |||
| Li2O | 3.18 | 3.58 | 12.58% | |
| MgO | 0.87 | 0.74 | ||
| MnO2 | 2.32 | 2.24 | -3.50% | |
| MoO3 | 0.0007 | |||
| Na2O | 11.2 | 12.14 | 8.39% | |
| Nb2O5 | 0.0079 | |||
| Nd2O3 | 0.0004 | |||
| NiO | 1.04 | 1.0578 | 1.72% | |
| P2O5 | 0.27 | 0.4359 | ||
| PbO | 0.0005 | |||
| PdO | ||||
| Pr2O3 | 0.00015 | |||
| Rb2O | 0.0068 | |||
| Re2O7 | ||||
| Rh2O3 | ||||
| RuO2 | ||||
| SO3 | ||||
| Sb2O3 | 0.00027 | |||
| Sc2O3 | 0.00070 | |||
| SeO2 | ||||
| SiO2 | 47.75 | 47.50 | -0.52% | |
| Sm2O3 | ||||
| SnO2 | 0.0090 | |||
| SrO | 0.0037 | 0.0030 | ||
| Ta2O5 | 0.0017 | |||
| TeO2 | 0.0067 | |||
| TiO2 | 1.17 | 1.2077 | 3.22% | |
| Tl2O3 | 0.00007 | |||
| U3O8 | 0.00067 | |||
| V2O5 | 0.0242 | |||
| WO3 | 0.0006 | |||
| Y2O3 | 0.0007 | |||
| ZnO | 0.02 | 0.0246 | ||
| ZrO2 | 0.14 | 0.1256 | -10.31% | |
| Sum | 99.4837 | 92.33 | 8.59 | 0.80% |
| 100.92 | Sum for both methods | |||
Table 6: Comparison of the results of our analysis of ARG and the results of round-robin test.
| Concentration reported as Wt% Oxide | ||||||
|---|---|---|---|---|---|---|
| AFC1 natural | AFC1 full | AFC1 enriched | SON68 natural | SON68 full | SON68 enriched | |
| Ag2O | 0.037 | 0.053 | 0.074 | 0.035 | 0.050 | 0.058 |
| Al2O3 | 8.16 | 10.33 | 11.32 | 6.36 | 6.46 | 5.92 |
| As2O3 | 0.0014 | 0.0014 | 0.0015 | 0.0005 | 0.0039 | 0.0214 |
| B2O3 | 9.89 | 11.67 | 8.43 | 14.69 | 17.30 | 12.46 |
| BaO | 0.662 | 0.716 | 1.012 | 0.506 | 0.551 | 0.678 |
| BeO | ||||||
| Bi2O3 | 0.00002 | 0.00019 | 0.00015 | |||
| CaO | 3.200 | 5.463 | 6.645 | 4.581 | 2.907 | 5.774 |
| CdO | 0.0389 | 0.0447 | 0.0504 | 0.0353 | 0.0349 | 0.0339 |
| CeO2 | 0.124 | 0.124 | 1.301 | 0.049 | 0.348 | 1.000 |
| CoO | 0.00054 | 0.00096 | 0.00060 | 0.00069 | 0.00073 | 0.00111 |
| Cr2O3 | 0.0012 | 0.0007 | 0.0015 | 0.581 | 0.611 | 0.596 |
| Cs2O | 1.224 | 1.248 | 1.266 | 1.306 | 1.241 | 1.298 |
| CuO | 0.0026 | 0.0041 | 0.0050 | |||
| Dy2O3 | 0.0007 | 0.0012 | 0.0039 | 0.0014 | 0.0037 | 0.0002 |
| Er2O3 | ||||||
| Eu2O3 | 0.016 | 0.028 | 0.129 | |||
| Fe2O3 | 0.052 | 0.059 | 0.027 | 3.40 | 3.36 | 3.31 |
| Ga2O3 | 0.0825 | 0.0759 | 0.0949 | 0.0485 | 0.0914 | 0.0961 |
| Gd2O3 | 0.0285 | 0.0319 | 0.1370 | |||
| HfO2 | 0.0153 | 0.0159 | 0.0191 | 0.0436 | 0.0473 | 0.0463 |
| K2O | ||||||
| La2O3 | 0.0460 | 0.0410 | 0.4940 | 0.0190 | 0.2160 | 0.7110 |
| Li2O | 3.993 | 4.424 | 4.382 | 1.913 | 2.039 | 4.006 |
| MgO | 0.0208 | 0.0401 | 0.0168 | 0.0211 | 0.0381 | 0.0088 |
| MnO2 | 0.0007 | 0.0009 | 0.0007 | 0.4389 | 0.4692 | 0.4206 |
| MoO3 | 1.891 | 1.770 | 1.794 | 1.964 | 2.109 | 2.254 |
| Na2O | 7.911 | 7.862 | 8.918 | 12.003 | 11.276 | 12.074 |
| Nb2O5 | ||||||
| Nd2O3 | 0.2077 | 0.3036 | 1.9011 | 0.1888 | 0.9879 | 1.8935 |
| NiO | 0.4893 | 0.4731 | 0.5059 | |||
| P2O5 | 0.0703 | 0.1225 | 0.1653 | 0.3425 | 0.4508 | 0.3835 |
| PbO | 0.0002 | 0.0003 | 0.0004 | 0.0002 | 0.0005 | 0.0005 |
| PdO | ||||||
| Pr2O3 | 0.0545 | 0.0677 | 0.5344 | 0.0305 | 0.1863 | 0.4280 |
| Rb2O | 0.1840 | 0.1726 | 0.1816 | 0.0007 | 0.0010 | 0.0005 |
| Re2O7 | ||||||
| RhO2 | 0.0192 | 0.0211 | 0.0194 | |||
| RuO2 | 0.0461 | 0.0444 | 0.0419 | |||
| SO3 | ||||||
| Sb2O3 | ||||||
| Sc2O3 | 0.0015 | 0.0014 | 0.0018 | 0.0034 | 0.0044 | 0.0045 |
| SeO2 | 0.0075 | 0.0073 | 0.0302 | |||
| SiO2 | 57.00 | 55.46 | 51.56 | 43.20 | 41.77 | 40.30 |
| Sm2O3 | 0.0408 | 0.0698 | 0.3309 | |||
| SnO2 | 0.0306 | 0.0289 | 0.0318 | 0.0245 | 0.0244 | |
| SrO | 0.2520 | 0.3230 | 0.4037 | 0.2249 | 0.3266 | 0.4171 |
| Ta2O5 | ||||||
| TeO2 | 0.0847 | 0.0762 | 0.0867 | 0.0755 | 0.0759 | 0.0571 |
| TiO2 | 0.0119 | 0.0119 | 0.0032 | 0.0094 | 0.0129 | 0.0047 |
| Tb2O3 | 0.0005 | 0.0009 | 0.0034 | 0.0002 | ||
| U3O8 | 0.0003 | |||||
| V2O5 | 0.0015 | 0.0014 | 0.0011 | 0.0009 | 0.0012 | 0.0007 |
| WO3 | 0.0051 | 0.0036 | 0.0488 | 0.0059 | 0.0090 | 0.0448 |
| Y2O3 | 0.0217 | 0.0272 | 0.2060 | 0.0160 | 0.1081 | 0.1895 |
| ZnO | 0.0014 | 0.0013 | 0.0065 | 2.832 | 3.061 | 2.628 |
| ZrO2 | 0.73 | 0.74 | 0.99 | 1.99 | 2.50 | 2.58 |
| Sum, % | 96.17 | 101.48 | 102.66 | 97.43 | 99.17 | 100.21 |
Table 7: The elemental analyses results obtained for six different isotopically modified glass samples.
Methods for comprehensive analyses of glass-sourced solutions by MC-ICP-MS have been developed and the validity of the methods was confirmed on different glass samples, including digestions, fusions, and solutions resulting from aqueous glass corrosion. Although some errors in isotopic analyses of are still possible with such complex samples due to mutual interferences of different elements, it was proven for seven selected elements that accurate isotopic analyses for the ratios of interest are achievable. All major and relatively minor components of the glass were identified and their concentrations were measured, and the total summarized content of six different isotopically modified glasses was close to 100%. The capabilities of MC-ICP-MS for comprehensive analyses of glass dissolution and glass corrosion samples with simple sample preparation have been demonstrated.
These studies were supported by the U.S. Department of Energy (DOE) through the Office of Nuclear Energy. We would like to thank Carmen Rodriguez of PNNL for help in glass preparation