Journal of Probiotics & Health
Open Access
ISSN: 2329-8901
ISSN: 2329-8901
Research Article - (2020)Volume 8, Issue 3
The identification of protoplast of bacterial cells has previously utilized phase contrast microscopy. This method determines protoplast by their size and change in shape. A more verifiable method can be used utilizing fluorescent stains that target the specific cellular components. The goal of this study was to utilize fluorescence microscopy techniques to determine the presence or absence of bacterial cell walls in the probiotic Lactobacillus acidophilus, after exposure to cell wall digestive enzymes. Bacterial cells were treated with different concentrations of lysozyme [0, 175, 250, 425 μg/ml] and were incubated at 37°C for ten minutes. Following lysozyme treatment cells were fluorescently stained with different concentrations (1x, 2x, 10x, and 100x) of two fluorescent dyes, Wheat-germ agglutinin (WGA) and Hoechst 33342. The WGA [CF®594 WGA, a red-fluorescent dye] was used to selectively bind to residues of the peptidoglycan layer of the cell wall and Hoechst 33342, a blue fluorescent dye, was used for specifically binding to nucleic acids of double-stranded DNA of bacterial cells. The standard method for sample preparation for fluorescence microscopy was followed. Three fields were studied for each lysozyme and stain combination. A one-way ANOVA was performed to determine differences in lysozyme concentrations. A p-value < 0.05 was noted as significantly different. Cell wall structural integrity began to deteriorate at 175 and 250 μg/ml of lysozyme and cell lysis and striations of DNA increased at a concentration of 425 μg/ml. Lysozyme concentration of 175 μg/ml produced an average of 41% protoplast or partial digestion of cell wall. An increase from 175 to 250 μg/ml concentration of lysozyme resulted in a decreased average percentage of protoplast (4%). At a concentration of 425 μg/ml, the average percentage of protoplast decreased to 1%, while also showing an increase in striations of DNA. At 1x dye concentration, partial staining of the cell wall was observed. At 2x, complete staining of the cell wall was recorded. At 10x, complete staining of cell wall and nuclei was observed similar to dye concentrations at 2x with no significant saturation of dyes. Dye concentration at 100x produced an oversaturation of the dyes in the cell wall and nuclei causing them to mix and inhibit the efficacy of identifying bacterial cells and protoplasts. 2x was most optimum for complete staining of cell wall and nucleus. Background fluorescence noise was observed as concentration of dye increased. In Lactobacillus acidophilus, a lysozyme concentration of 175 μg/ml was sufficient for cell wall digestion. Efficacy of dye concentration was best at 2x with the least amount of background noise.
Fluorescence microscopy; Lactobacillus acidophilus
Public interest in functional foods containing healthy bacteria have been rapidly increasing in popularity within the U.S. and worldwide. This is most likely accredited to the numerous health effects associated with specific probiotic strains and the rising interests in personal health. Currently, probiotics are commercialized as foods or nutritional supplements and has gained widespread consumer acceptance for their health benefits. This has created a huge market for brands and manufacturers to design novel probiotic products and supplements. As of 2014 probiotic retail sales, marketed as functional foods, were valued to be 31.7 billion U.S. dollars globally [1]. This trend is believed to rise with some reports estimating the functional food market to grow at a pace of 5 to 20% by 2024 and value over 66 billion in the U.S. [2].
In enough numbers, metabolites produced by lactic acid bacteria inhibit the growth of pathogens and alter the ecological balance to promote health. Lactobacillus spp. are progressively being investigated for their probiotic properties [3-5]. Benefits associated with these species are due to their ability to withstand low pH and bile acid, production of antimicrobials substances, reduction of serum cholesterol, treatment for irritable bowel disease (IBD) and many other physiopathological benefits [6-8]. Additionally, various lactobacillus species have been associated with the improvement of gut health by modulating the ecological environment within the gut allowing for growth of beneficial fermenting bacteria and/or inhibition of pathogenic microbes within the gut microflora.
New exploratory efforts need to be undertaken to identify and discern the potential benefits and risks involved in identifying probiotic strains. Protoplasts are defined as a plant or bacteria cell whose cell wall has been removed. However, light microscopy techniques used in identifying protoplast are inhibited by resolution. Fluorescence microscopy techniques are beneficial in identifying specific stained structures that may be too small to identify, due to limitations in resolution. Adopting the fluorescence microscopy method can not only improve on identification of protoplast through the fluorescent staining of structural proteins, but also allows multiple fluorescent dyes to be used to identify both the wall and nucleus in gram positive cells, thereby ensuring the efficacy of protoplast formation. Previous studies identified bacterial protoplast by size, shape and metabolite production [9], however, advancements in fluorescence microscopy makes it possible to explore formed protoplasts.
The objectives of this study were to determine the optimal concentrations of lysozyme required for L. acidophilus to produce the highest rate of protoplast and to optimize the concentration of two fluorescent dyes needed to identify the cell wall and nuclei of the probiotic L. acidophilus.
Microorganisms L. acidophilus (LA-K) was purchased from CHR Hansen. A 1% (v/v) MRS medium solution was created by the transferring of L. acidophilus culture into MRS broth (1ml/ 100ml). The MRS cultured medium was incubated at 37°C for 16 hours. 500 μl of the cell suspension (diluted 10e-2) was mixed with the same volume of protoplast formation buffer. Protoplast formation buffer: HEPES buffer (20 mM HEPES buffer with 1.0 M sucrose, pH 7.0) containing lysozyme concentrations (0, 175, 250, or 425 μg/ml). The mixtures were gently agitated for 20 seconds and incubated at 37°C for 10 mins. Following incubation, cell mixtures were harvested by centrifugation (10,000 x g, 5 min) and washed once in 500 μl of BSA-NaCl (0.25% Bovine Serum Albumin (BSA), 0.15 M NaCl sterilized by 0.2 μm filtration)) and pelleted by centrifugation (10,000 xg, 5 min) Cells were then resuspended in 50 μl of BSA-NaCl.
Fluorescent staining of L. acidophilus cell wall and nuclei (1x, 2x, 10x, 100x) WGA dye concentrations were added to cells suspended in BSA-NaCl and mixed by pipetting up and down several times. To prepare a 1x concentration of WGA, 5 μl of WGA stock solution (40x concentration) was mixed with 195 μl of BSA-NaCl; 2x concentration was prepared by mixing 5 μl of WGA with 98 μl of BSA-NaCl, 10x concentration was prepared by mixing 5 μl of WGA with 20 μl of BSA-NaCl, and 100x concentration was prepared by mixing 5 μl of WGA with 2 μl of BSA-NaCl. WGA treated cells were incubated for 10 minutes at 22°C and then pelleted by centrifugation (3000 rpm, 5 mins) to remove WGA staining solution. To prepare a 1x concentration of Hoechst dye 5 μl of Hoechst 33342 stock solution was mixed with 5 ml of BSA-NaCl to obtain a 1 μl/ml concentration, 2x concentration was prepared by mixing 1 μl of Hoechst 33342 with 500 μl of BSA-NaCl, 10x concentration was prepared by mixing 1 μl of Hoechst 33342 with 100 μl of BSA-NaCl, and 100x concentration was prepared by mixing 1 μl of Hoechst 33342 with 10 μl of BSA-NaCl. Following staining and removal of WGA dye by centrifugation, cells were resuspended in 50 μl BSA-NaCl and Hoechst 33342 (1x, 2x, 10x or 100x) was added and incubated (37°C) for 5 mins in the dark at 22°C. Cells were viewed using an epifluorescence microscope (Leica DM6 B upright microscope with a Hamamatsu sCMOS camera) at excitation/emission wavelengths 360/461 nm for Hoechst 33342 stain and 562/583 nm for WGA stain.
Statistical analyses were performed with SAS version 9.4 using a one-way ANOVA. An average of each protoplast and intact cell was calcμlated based on 3 representative fields taken at each lysozyme treatment. The univariate procedure was utilized to test for normality (Shapiro-Wilk), equal variance (Chi-Square) and to identify possible outliers Results were considered significant by an F-statistic p-value<0.05 (Table 1).
| Groups | % Protoplast | p-value (F) |
|---|---|---|
| Lysozyme (175 µg/ml) | 40.9 | 0.0001 |
| Lysozyme (250 µg/ml) | 4.2 | 0.0001 |
| Lysozyme (425 µg/ml) | 1 | 0.0001 |
Data were collected from 3 representative fields (viewed by fluorescence microscopy) after lysozyme treatment of 175, 250 and 425 µg/ml. (F) represents an F-ANOVA that tests for differences between sample means denoting significant differences (p<0.05) between group mean.
Table 1: Protoplast formation
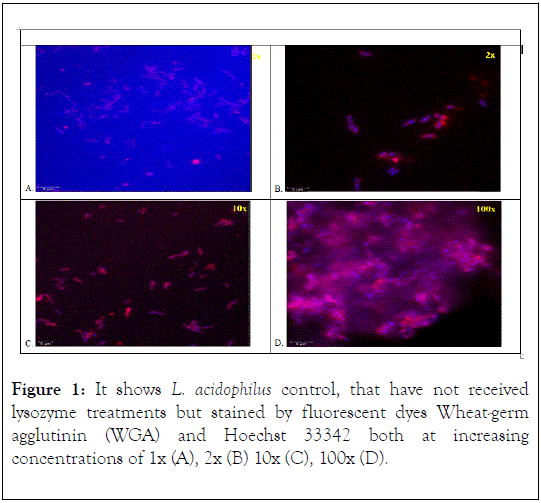
The control L. acidophilus cells did not receive any Lysozyme treatment but were stained by the 2 fluorescent dyes Wheatgerm agglutinin (WGA) and Hoechst 33342 both at increasing concentrations of 1x (A), 2x (B) 10x (C), 100x (D) (Figure 1). At a stain concentration of 1x an incomplete staining of the cell wall, was observed by the partial red staining at the poles of the cell wall (Figure 1A). The nuclei were observed to be stained a light blue color. At 2x complete red staining of the cell wall and a clear blue staining of the nuclei was observed (Figure IB). As the stain concentration increased to 10x (Figure 1C) the WGA red stain was brighter in appearance, while the Hoechst 33342 blue stain for the nuclei stayed relatively the same. Some mixture of dyes could be observed at this concentration giving the cells a purplish hue. At 100x (Figure 1D) the selective stains were observed to over saturate the L. acidophilus cells and mixed with each other giving a purplish background around the stained cells. Hoechst 33342 fluorescent dye has been previously used for its effectiveness and fluorescent intensity but also typically resulted in background fluorescence [10]. This was noticeable as dye concentrations increased for each lysozyme treatments.

Figure 1. It shows L. acidophilus control, that have not received lysozyme treatments but stained by fluorescent dyes Wheat-germ agglutinin (WGA) and Hoechst 33342 both at increasing concentrations of 1x (A), 2x (B) 10x (C), 100x (D).
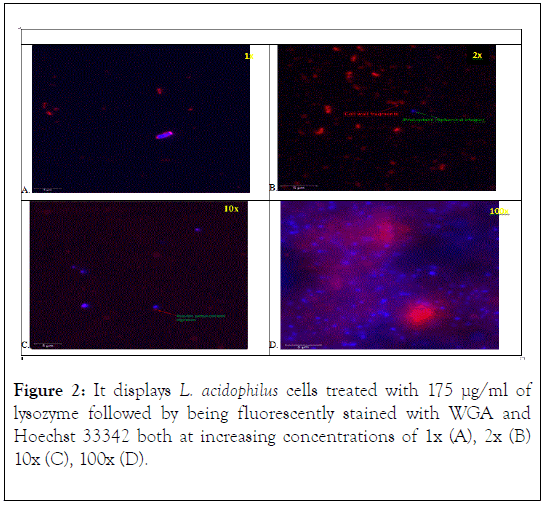
The L. acidophilus cells treated with 175 μg/ml of lysozyme followed by being fluorescently stained with WGA and Hoechst 33342 both at increasing concentrations of 1x (A), 2x (B) 10x (C), 100x (D) are shown in Figure 2. In all stain concentrations many of the rod cells subsequently became round spherical, indicating intact membranes and likely viable protoplast (Figure 2). Stain concentrations at 1x (Figure 2A) showed staining at the poles of the rod-shaped bacterial cells, similar to the control (no lysozyme) at 1x dye concentration. Additionally, some of the peptidoglycan containing cell wall components (stained red) were observed to not be enclosed around the bluestained nuclei (Figure 2A). At 2x (Figure 2B) stain concentrations cell wall fragments (stained red) were noticeable, and nuclei were observed to be a defined blue spherical shape with some having a small thin red lining around the perimeter. The red arrow (with red text) points to the digested cell wall fragments. The green arrow (with green text) points to the cell’s nucleus surrounded by a thin red lining. This red lining is believed to be residual peptidoglycan layer still present around the surface of the cell’s nucleus. At stain concentrations of 10x (Figure 2C) a shift to a more defined red background was observed, identifying more cell wall fragments. Similarly, to the 2x stain concentration blue spherical shaped nuclei were noted. The green arrow points to a partial fragment of the red-stained cell wall still attached to the blue spherical-shaped nucleus of the cell. This could possible represent a cell that had partial digestion of its cell wall. At 100x (Figure 2D) an increase in nonspecific staining was observed along with background noise. This increase in stain concentration caused concentrated staining in areas which led the two stains (WGA and Hoechst 33342) to mix creating a purplish hue around the noticeable clusters of blue spherical nuclei. In other areas, blots of bright red were observed. The purplish mixture surrounding the cluster of nuclei was most likely attributed to the oversaturation of the red-stained cell wall fragments and the blue-stained nuclei of the cell mixing together.

Figure 2. It displays L. acidophilus cells treated with 175 μg/ml of lysozyme followed by being fluorescently stained with WGA and Hoechst 33342 both at increasing concentrations of 1x (A), 2x (B) 10x (C), 100x (D).
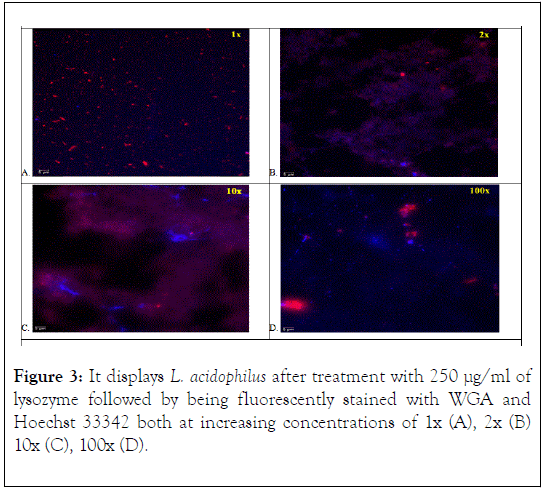
The L. acidophilus cells treated with 250 μg/ml of lysozyme followed by being fluorescently stained with WGA and Hoechst 33342 both at increasing concentrations of 1x (A), 2x (B) 10x (C), 100x (D) are shown in Figure 3. At 1x (Figure 3A) dye concentration red-stained (WGA) cell wall fragments were noted, but few blue-stained (Hoechst 33342) nuclei were observed. At 2x (Figure 3B) dye concentration blue and purple splotches and red staining of partially or completely digested cell walls were observed. These splotches are believed to be cells that have had their cell wall completely digested and lysed, losing the integrity of their cellular membrane and resulting in the leakage of nuclear DNA material. The mixing of the Hoechst 33342 blue-stained nucleic acids and the digested cell wall residues stained red by WGA resulted in the purplish smearing appearance. At 10x (Figure 3C) the purplish smearing appearance, due to the mixture of the red-stained (WGA) digested cell wall fragments and the blue-stained (Hoechst 33342) intercellular chromosomal (DNA) released from the cell, were more defined. Extracellular DNA released from the bacterial cell was noted by its bright blue filamentous appearance. At 100x (Figure 3D) extracellular DNA debris by blue-stained striations were observed. The digested cell wall (peptidoglycan) debris was observed to clump together creating bright red splotches (Figure 3D).

Figure 3. It displays L. acidophilus after treatment with 250 μg/ml of lysozyme followed by being fluorescently stained with WGA and Hoechst 33342 both at increasing concentrations of 1x (A), 2x (B) 10x (C), 100x (D).
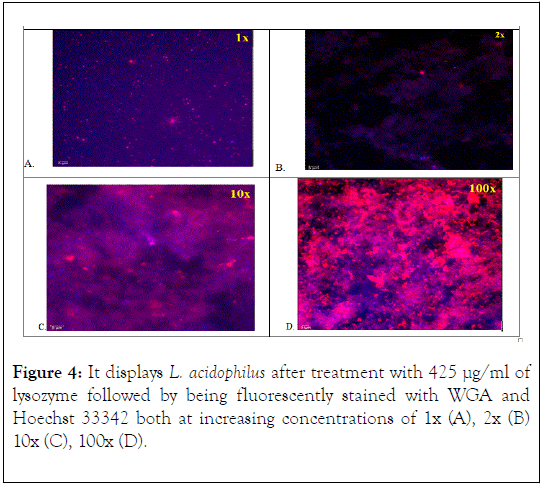
The L. acidophilus cells treated with 425 μg/ml of lysozyme followed by being fluorescently stained with WGA and Hoechst 33342 both at increasing concentrations of 1x (A), 2x (B) 10x (C), 100x (D) are shown in Figure 4. At 1x (Figure 4A) dye concentrations, pieces of digested cell wall fragments, stained red by WGA, were dispersed throughout the observed fields. A blue tint background appearance was also noticeable. At 2x (Figure 4B) concentration striations of blue-stained DNA was observed with splotches of red-stained cell wall peptidoglycan components also noticeable. As the concentration of dye increased to 10x (Figure 4C) a mixture of the two stains (WGA (red) and Hoechst 3342 (blue)) formed a purplish mixture due to the lysing of the cell and the extracellular stained components mixing. At 100x (Figure 4D) dye concentration mixture of the DNA and cell wall material was more evident due to the increase in dye, thus giving the background a deeper and brighter mixture of colors.

Figure 4. It displays L. acidophilus after treatment with 425 μg/ml of lysozyme followed by being fluorescently stained with WGA and Hoechst 33342 both at increasing concentrations of 1x (A), 2x (B) 10x (C), 100x (D).
Utilization of fluorescence microscopy was successful in determining protoplast formation of the probiotic L. acidophilus following treatment of cell wall with digestive enzyme lysozyme and subsequent exposure to fluorescent dyes. However, there were differences in cell wall degradation and fluorescent viewing at different lysozyme and dye concentrations. The optimal concentration of lysozyme for cell wall degradation of the probiotic L. acidophilus was observed to be 175 μg/ml. An increase in lysozyme concentration greatly above 175 μg/ml caused L. acidophilus cells to lose membrane integrity and lyse. The treatment of 2x fluorescent dye concentration of WGA and Hoechst 33324 was shown to provide adequate staining of both the cell wall and nucleus of the probiotic L. acidophilus. Protoplast formation of the probiotic L. acidophilus could be obtained and confirmed using fluorescence microscopy.
This research was supported by USDA Hatch funds and Louisiana State University Agricultural Center.
There is no conflict of interest.
Citation: Page R, Burk D, Aryana K (2020) Cell Wall Integrity and Protoplast Formation of the Probiotic Lactobacillus acidophilus through Fluorescent Staining and Fluorescence Microscopy. J Prob Health. 8:218.
Received: 29-Apr-2020 Accepted: 11-May-2020 Published: 18-May-2020
Copyright: © 2020 Page R, et al. This is an open-access article distributed under the terms of the Creative Commons Attribution License, which permits unrestricted use, distribution, and reproduction in any medium, provided the original author and source are credited.
Sources of funding : USDA Hatch funds andLouisiana State University Agricultural Center