Journal of Hotel and Business Management
Open Access
ISSN: 2169-0286
ISSN: 2169-0286
Research Article - (2022)Volume 11, Issue 1
This study investigated the intra-trade intensity among Common Market for Eastern and Southern Africa (COMESA) region, with a specific focus on export trade from the period 2000 to 2016 by utilizing panel data. The study used trade intensity index to measure the intensification of trade among member states. The results from the Trade Intensity Index (TII) measure indicate that although the intra-COMESA trade remains low for most of the members, the intensity result appear to increase at slow rate at regional level. The analysis indicates that the trade strength of intra-COMESA exports increased from 11 percent in 2000 to 13.6 percent in 2016 at regional level. More specifically, Egypt and Kenya have expanded their export trade among other members of COMESA, while Libya has the smallest export trade share followed by Eretria. It is recommended that COMESA members need to invest on complementary products (export diversification) where they have comparative advantage through identification of priority products in the region, improving the economic size, implementation of AU`s 2012 declaration of Continental Free Trade Area (CFTA), development of regional transport infrastructure and strengthening of institutional democracy to expand bilateral trade among member states.
Regional economic integration has been considered as a crucial ingredient for economic growth and development among countries and regions. Regional integration initiatives started particularly after independence of most of the African countries and witnessed the establishment of a number of Regional Trade Agreements (RTAs) to strengthen their economic growth and development. However, the performance of the trade agreements among African regions have not resulted as expected. In support of this argument as cited in Ebaidalla, Economic Commission for Africa (ECA) (2012) reported that the situation of intra-African trade is disappointing, since it remains consistently low compared with the continent’s external trade. Additionally, WTO (2011) reported that more than 80% of Africa’ exports go to external markets, while African countries import more than 90% of their imports from outside of the continent. This indicates the effect of regional trade agreement between African countries and regions are weak which needs more investigation [1,2].
Common Market for Eastern and Southern Africa (COMESA) is one of the Africa`s regional economic communities formed to enhance the economic growth and development of the member states through increasing intra-trade and hence strengthening the economic integration process. As pointed out by Albert, the aim of COMESA is to promote sustainable economic and social development for all its member countries through enhanced cooperation leading to regional integration especially in the areas of trade, customs, infrastructures (transport and communications), science and technology, agriculture and natural resources [3].
Despite these efforts, the success of COMESA trade integration in terms of intensification of trade volume among its member states has been limited. Reasons for the failure of trade integration to succeed as pointed out by some researchers like Alemayehu and Haile, are related to issues of limited measures in fully reducing tariffs and eliminating non-tariff barriers, lack of adopting common economic policies, issues of revenue loss, compensation issues and poor private participation. Geda and Seid also added that in spite of the proliferation of RECs, African continent has not shown success in expanding intra-regional trade; and most of these regional economic communities have achieved very little.
Therefore, this study is motivated to investigate the determinants of intra-COMESA trade that influence the trade intensification among member states from 2000 to 2016. It would be recalled that intra-trade is one means of economic integration that plays an important role in the process of economic growth of the region. Regional integration has long been viewed in Africa as a vehicle for enhancing economic growth through encouraging intra-regional trade. It has also been a means of achieving industrialization and modernization through promoting trade and securing economies of scale and market access. The large number of preferential trade agreements signed in the past five decades has led to a “spaghetti bowl” of intertwined and overlapping regional organizations. Every African country is a party to at least one regional economic agreement, and many are members of five or more. Despite these efforts, intra-African trade remains low. Regional exports are less than 10 percent of Africa’s total merchandise exports, and models estimating the trade potential between countries based on economic size, geographical distance, and other characteristics consistently find that trade among Africa’s economies is below the levels predicted (World Bank, 2009).
In addition, other researchers come up with different outcome as to why intra-trade has been limited in the regional integration process. These low performances of intra-trade are marked by issues of revenue loss, compensation issues and variation in initial condition, poor private sector performance, lack of political commitment and institutional issues, issues of overlapping membership, high transaction cost due to inadequate infrastructure, macroeconomic instability, distorted trade regimes, low resource complementarity and small market size [4-6].
Furthermore, despite the long history of regional integration on the continent, the level of intra-African trade remains low in comparison with other developing regions. Intra-African exports represent 9.6 percent of the region’s total exports, compared to 20 percent for Latin America and 48 percent for developing Asia. This proportion is substantially higher for sub-Saharan Africa (around 12 percent) than for North Africa (around 3 percent), which has systematically featured very low levels of intra-regional trade. ECA also added that regional integration is a key strategy for development and intra-trade and is expected to produce considerable economic gains for Africa. Although it is widely recognized that intra-African trade could play a significant role in accelerating economic growth and poverty reduction and enhancing food and energy security in Africa, the continent continues to trade little with itself [7].
In contrast to other regional trading blocs, regional integration in COMESA failed to increase trade among the member countries. Accordingly, the growth in intra-trade in ASEAN and SADC from 1980 to 1990 was 1.20 percent and 8.80 percent respectively, while in COMESA it was only 0.60 percent. From 1990 to 1995 the period in which the three regions decided to establish FTA among their respective member. Countries, the growth of intra-regional trade were 1.90 percent for ASEAN, 2.90 percent for SADC and only 0.15 percent for COMESA [8-11].
Objectives of the study
Specifically, the study intends to identify the intensity of export trade through trade-linkage and identify the major trade partners of each member focusing on the potential expansion of export trade flows among the COMESA members.
Significance of the study
This research is intended to provide a better understanding of the determinants of intra-trade performance in Economic Community of Africa in general and COMESA member states in particular by identifying in which area COMESA is not doing better so that more effort and new measures can be taken to increase intra-trade. This study provides some useful contributions to assist policy makers having a detailed policy orientation on intra-trade determinants.
The policy implications from the gravity model analysis could help caution policy makers about possible consequence of the determinants of intra-trade of COMESA. The study will enable the member states of COMESA to consider their policies and regulations in trade intensity, multi-membership, good governance and other cost related issues which have impact on intra-trade in the bloc. International development partners and investors can also use this as an input to whether to participate in the development process by forming bilateral trade policies with COMESA member states.
Lastly, I expect to add contribution to the existing literature, academician, and researchers in relation to trade among COMESA members. The study will provide an up-to-date analysis of trade flows.
Scope the study
Based on availability of balanced panel data under consideration, this study is generally limited to COMESA member countries such as Burundi, Democratic Republic of Congo, Comoros, Djibouti, Egypt, Eritrea, Ethiopia, Kenya, Libya, Madagascar, Malawi, Mauritius, Rwanda, Seychelles, Sudan, Swaziland, Zambia, Uganda and Zimbabwe and six IGAD members such as Ethiopia, Djibouti, Eritrea, Kenya, Uganda and South Sudan.
Organization of the study
This study is organized in to five chapters. The first chapter of the study provides the introduction of the research, the problem statement, objectives, significance, scope and limitations of the study. The second chapter is concerned with literature review closely related to the topics and variables under consideration, including conceptual frame work and empirical, theoretical and theoretical literature. Chapter three addresses the methodological approaches of the study using trade intensity index. Chapter four examines results and discussions. Chapter five presents some conclusions and policy implications based on the results and discussions.
Theoretical review on regional integration
Regional economic integration may be defined as an attempt to link together the economies of two or more countries, in defined geographic areas, designed to reduce economic barriers such as tariffs and immigration controls, aimed at raising the living standards as well as achieving peaceful relations among the participating countries.
Depending upon the level of integration amongst participating nation-states, RTAs can be divided into the following categories: Firstly, trade barriers are lowered when the countries conclude Preferential Trading Agreements (PTAs) at the most basic level. Such preferential trade is usually limited to the portion of actual trade flows from LDCs and is often non-reciprocal in nature. Papua New Guinea-Australia Trade represents an example of such an agreement. Second, when two countries strike a bilateral trade agreement whereby trade barriers i.e. Tariffs are abolished among the participating countries; such an arrangement is called Free Trade Agreement/Area (FTA). However, each member is free to formulate its external trade policies against the countries, which are not part of FTA. Under this arrangement, barriers to trade are reduced gradually over a period, but it does not mean that all trade has become completely free of national barriers, which at times stay intact. A prominent example of an FTA is the North American Free Trade Agreement (NAFTA). The formation of the Customs Union comes at the third level of economic integration. Customs Union is a stage where trade barriers among the member countries are abolished and a common external trade policy is adopted by the member nations (e.g. Common External Tariff regime or CET), vis-à-vis non-members. A Customs Union can be likened to an FTA, which is accompanied by a common external trade policy. The Customs Union of the Southern Cone-Mercosur can be referred to as an example in this regard. The Common Market represents the fourth level in the process of economic integration. A Common Market is established when the member countries facilitate movement of both goods and factors by removing all trade barriers. They also continue to retain the common external trade policy. It can be likened to a Customs Union plus free mobility of factors of production. The relevant example of a common market is the Common Market for Eastern and Southern Africa (COMESA).
Economic Union is the climactic point and the last level of economic integration. The participating countries pursue common macroeconomic policies in an Economic Union and also allow free movement of goods and factors. An example of Economic Union is manifestly the European Union.
Research design
In order to achieve the objectives of the study this research uses quantitative design methods to analyze intra-regional trade among the Common Market for Eastern and Southern African member countries in the period 2000-2016. The research used the trade intensity index which is used to examine the trade pattern and to see whether increased cooperation is possible between the members of COMESA.
The methodological sources consists of annual total bilateral export trade data obtained from IMF, Direction of Trade Statistics (DOTS), UN COMTRADE data base, World Integrated Trade Solution, World Development Indicators (WDI) database, CEPII, AU, and UNECA.
Study area
The study area encompasses the nineteen (19) member of Common Market for Eastern and Southern Africa (COMESA) among the eight regional economic community of Africa recognized by African Union. One of the objectives of COMESA is to increase trade among its members to strengthen their economic growth and development through regional economic integration.
Data collection and sources
This section presents variables and sources of data used in the study. The analysis covers a cross section of 19 COMESA member states and time series from 2000 to 2016. The researcher uses secondary data sources to collect information from the different international organizations data bases. This has been found appropriate because of the credibility and recognizable data availability for the research study for each member country in COMESA region. Document review technique was also used to collect secondary data necessary for the research study.
Annual total bilateral export trade data in thousands of US dollars was obtained from Direction of Trade Statistics (DOTS), UN Commodity Trade Statistics (UN COMTRADE) online data base, World Integrated Trade Solution. Annual GDP or populations of a country as a proxy for economic size are obtained from World Development Indicators (WDI) database.
Method of data analysis
In this sub-section, we proceed to specify the models that are used to measure and analyses the bilateral trade to addresses each specific research questions.
Measures of intra-regional trade intensity index
To answer the research question, the study specify a relative intra- trade intensity measure between COMESA member states using the trade intensity index which is used to examine the trade pattern and to see whether increased cooperation is possible between the members of COMESA. Trade Intensity Index is calculated for member countries of COMESA for the period 2000 to 2016 taking data from Direction of Trade Statistics (DOTS), World Development Indicator (WDI). An index value of one indicates bilateral trade is following the pattern of rest of the world and the value above one show there is trade intensity between partners.
According to Hyun and Hong the measure can be expressed as follows:
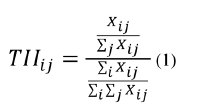
Where X ij is country i’s exports going to country j. The numerator indicates the share of country i’s export to country j in total export of the country i, and the denominator indicates the share of country j’s imports of the total world imports. If the bilateral trade intensity index has a value greater than 1, the export of country i outperforms in country j considering country i’s export ability and country j’s import capacity. It implies that country j is relatively important to country i. If the bilateral trade intensity index has a value smaller than 1, country j is not relatively important for country i’s export.
Trends and patterns of intra-trade in COMESA
This part discusses the reviews of COMESA`s trends and patterns of intra-trade using up-to-date trade data to understand the background of the study in a better way before we proceed to the next data analysis. It reviews the major trade patterns, and compositions of the members.
The Direction of Trade Statistics (DOTS) presents the value of merchandise exports and imports disaggregated according to a country's primary trading partners. Imports are reported on a cost, insurance and freight (CIF) basis and exports are reported on a free on board (FOB) basis. Kenya is the highest exporting country from 19-members of COMESA trading bloc, which is mainly comprised agricultural products, especially tea and tobacco, animal products and it’s also emerged as the top performer in the EAC and serving as the largest trade market in the east African countries (Table 1).
| Type | Free trade area | Customs union | Common market | Economic union | Total political union |
|---|---|---|---|---|---|
| Policy action | |||||
| Removal of tariffs and quotas |  |
|
|
|
|
| Common external tariff | |
|
|
|
|
| Factor mobility | |
|
|
||
| Harmonization of economic policies | |
|
|||
| Total unification of economic policies | |
Table 1: Types and characteristics of International Economic Integration.
All members of COMESA intra-export values were varying across the years. Kenya and Egypt dominate the intra-export values in the region. Kenya exported goods valued at $1,459.2 and$1,553.4 million in 2008 and 2015 respectively. After Kenya, the second largest share of export country within COMESA members was Egypt valued at $1,084.0 and $1,654.0 million in 2008 and 2015 respectively. Between these years the two countries were also characterized by higher GDP and FDI inflows which indirectly encourage the production of goods and services to export to other members. Democratic Republic of Congo was the third country in selling goods valued at $578.2 million in 2008 which has been increased to $999.6 million in 2015. But the rest of the countries like Burundi, Comoros, Eritrea, Swaziland and Seychelles were relatively insignificant and recorded the least intra-export trade within the region. The total export worth in 2015 for the three countries was almost the same as Egypt which could lower the total trade patterns of COMESA against other regions in the world. At region level intra-export of COMESA rising from 5,844 million in 2008 to 11,693 million in 2013. This shows some dynamism which brings positive news for boosting intra-COMESA trade that could come from the increasing export level by other members, although more detail investigation of the composition of such trade is needed at disaggregate level. However, the performance of intra- regional export trade declined to 9,099 million in 2015 (Figure 1).

Figure 1: COMESA total intra-export in million USD from 2008 to 2015.
The aim of COMESA is to enhance the economic and social relations among member countries through increasing intra-trade. Even though the volumes of intra-trade among members are scanty (most of them are primary products) in relation to other regional blocks, intra-trade has been performed among most of the members in different quantity since the establishment of regional trade agreement. This study analyzed the determinants for the dynamism of intra-regional trade within COMESA members from 2000 to 2016 by applying trade intensity.
The study used to measure the trade intensity index to assess the export share of each COMESA member states and the augmented gravity model approach to identify factors affecting intra-regional trade in COMESA member states. Trade intensity index at regional level indicated that the intra-export-COMESA trade remains low and stood at 13.6 in 2016. The analysis indicates that share of intra-COMESA exports averaged to 11 between 2000 and 2016. COMESA intra-export-regional trade was significantly increasing from 2000 to 2003 and from 2013 to 2016. From 2000 to 2016 intra-regional trade Intensity were above eight and stood at 14.24 in 2003 and 13.59 in 2016. In contrary it was below eight in 2008, 2009 and 2010 which stood at 7.33, 7.85 and 7.99 respectively.
As a country level, Egypt and Kenya were observed to have the highest share, while Libya, Sudan and Seychelles were the least intra-trade performer in the region with most of their bilateral TII showing less than unity with other members of the region. The analysis of trade intensity between these countries and other members of COMESA point out that, they are not fully taking the advantage of their trade potential in the region. From the result we can conclude that for Libya, Sudan and Seychelles other members of COMESA are not very important trade partner considering at policy level and economic decision-making.
In contrary to other members of COMESA, Egypt and Kenya have shown an increasing tendency to trade intensively with geographically distant trading partners in COMESA with different magnitude in which their TII were greater than unity. This indicates that both countries have strong trade potential to expand and benefit more trade opportunities from the region to boost its economic growth and development.
Generally, most of the COMESA members are trading more with their neighbor than distant members because of geographical proximity, as well as cultural and economic links. This suggests that there may be other factors such as transport costs, logistical impediments, poor infrastructural development and lack of trade complementarities that made most members to trade with nearby countries. This shows most of the countries prefer to trade more with the bordering partner countries to decrease the cost of transportation of goods and services associated with the distance between the members in the region. This goes mainly with the natural trading partner location and transport cost hypothesis of Wonnacott and Lutz suggesting that geographical proximity between countries tends to increase trade between them and reduce trade diversion.
Generally, it can be concluded that the regional trade integration among COMESA was not as satisfactory as expected and the intra- export volume is limited among members. In 2016 the export trade intensity of the region stood at 13.6 percent. This indicates more than 80 percent of the region`s export trade has been performed with the rest of the world. The poor performance of trade might be associated with some of trade barriers like poor infrastructure, low commitment to regional integration, overlapping memberships, lack of institutional democratic election, low inward flows of FDI, lack of complementarities of products (most of them have similar export profiles), small and fragmented economies with low incomes, low percapita-income, lack of access to seaport for some members, unequal distribution of benefits among member countries after join the FTA of COMESA. Example Egypt and Kenya is the most beneficiary than other members. This problem arises because the more developed members benefit more than the less developed ones, whilst there are mostly no compensation mechanisms to help the losers.
In line with this, Yang and Gupta also summarized the general unsuccessfulness reasons of Africa in promoting intra-trade and foreign direct investment due to high external trade barriers and low resource complementarity between member countries limit both intra- and extra regional trade. Small market size, poor transport facilities and high trading costs also make it difficult for African countries to reap the potential benefits of RTAs. To increase regional trade and investment, African countries need to undertake more broad-based liberalization and streamline existing RTAs, supported by improvements in infrastructure and trade facilitation.
[Crossref] [Google Scholar]
Citation: Kerore TS (2022) Assessment of Intra-Trade Intensity within Common Market for Eastern and Southern Africa. J Hotel Bus Manage. 11:005.
Received: 24-Jan-2022, Manuscript No. JHBM-22-47741; Editor assigned: 27-Jan-2022, Pre QC No. JHBM-22-47741 (PQ); Reviewed: 11-Feb-2022, QC No. JHBM-22-47741; Revised: 18-Feb-2022, Manuscript No. JHBM-22-47741 (R); Published: 25-Feb-2022 , DOI: 10.35248/2169-0286.22.11.005
Copyright: © 2022 Kerore TS. This is an open-access article distributed under the terms of the Creative Commons Attribution License, which permits unrestricted use, distribution, and reproduction in any medium, provided the original author and source are credited.