Fungal Genomics & Biology
Open Access
ISSN: 2165-8056
ISSN: 2165-8056
Research Article - (2022)Volume 12, Issue 5
The Z and Laplace transforms are mathematical techniques applied to solve difference equations and differential equations, respectively. Mathematical models used to describe cell growth, substrate consumption and product formation in bioprocesses can be represented by these types of equations. Thus, in this work, the fermentation process of the yeast Saccharomyces cerevisiae was modeled using different models from the literature, and the Z- and Laplace transforms were applied to solve the equations. Once the equations were solved, the models were represented in state space and simulated in Octave® software. Finally, the models were compared to experimental data from previous studies and to each other. Verhulst was the model that best described the process, with an average error of 4.74% for cell growth and 13.9% for substrate consumption. This work is unprecedented since no works that use the Z transform and discrete models for the representation of fermentation of this yeast were found in the literature. Even more importantly, this work proved that discrete-time models can be applied to bioprocesses with the same precision as continuous-time models.
Saccharomyces cerevisiae; Bioprocess; Modeling; Simulation
According to a report by Mcwillians in BCC Research, the market for the yeast Saccharomyces cerevisiae will grow by 7.1% per year, from the current revenues of 7.6 billion dollars in 2017 to 10.7 billion dollars in 2022 [1]. Part of this increase in sales comes from the beverage market (beers, wines, etc.), which tends to show an average growth of 8.3% per year (driven by Asia and Latin America). The yeast market for bread (yeast) will grow 5.7% per year over the same period, from 4.4 to 5.8 billion dollars. Bioethanol, after being stagnant for a while, has a growth outlook of $124 million to $264 million, corresponding to 16.3 percent growth per year. This scenario stimulates the development of studies aimed at optimizing processes. Many tools in the literature can be used to improve the productivity of a process, including mathematical modeling. According to Finlayson, this technique is able to determine, based on experimental results, the best operating conditions for a process and, consequently, to predict the best operating conditions when some process parameters change [2]. Many types of models can be applied to describe a process: linear models, nonlinear models, network models, multiobjective optimization and discrete models. After a model is established, it is necessary to simulate it. However, the mathematical resolution of these models is not always trivial, and in most cases, the use of mathematical techniques is necessary. The Laplace transform method is very useful for solving ordinary differential equations. The Laplace transform allows the conversion of more complex functions into algebraic equations of a complex variable, "s", including the conversion of differential equations into algebraic equations. Once differential equations are transformed into algebraic equations, the necessary operations are performed on the domain "s" and then returned to the time domain by the inverse Laplace transform [3]. The Z-transform is widely used for discrete-time system analysis. It can be applied in linear difference equations, which, when converted to the Z domain, are transformed into algebraic equations that are easier to solve. After solving the algebraic equation in the Z domain, the inverse Z-transform is applied, thus providing the final system response [4]. It can be said that the Z-transform has the same function as the Laplace transform, except for discrete-time systems. Although many studies have already been performed in the area of bioprocessing modeling, no work that has applied the Z-transform to construct discrete models for fermentation under the conditions studied in this work has been found in the literature. In this work, we applied different kinetic models found in the literature, in addition to the Z- and Laplace transforms, to the fermentation process of the yeast Saccharomyces cerevisiae and compared the results with experimental results and with each other in Figure 1.

Figure 1: Graphic of Protein contents of different strains of Pleurotuscystidiosus mushrooms (g/100 mg of dried sample). Results show mean ± SEM in three trials.
Yeasts play the major role in various processes in the food industry and in bioethanol production. The most commonly used yeast is Saccharomyces cerevisiae. In addition, other yeasts known as nonconventional yeasts (Scheffersomyces stipitis, Yarrowia lipolytica, Kluyveromyces lactis and Dekkera bruxellensis) are already being used in some processes [5]. Currently, there are many studies looking for alternative yeasts for the baking process; however, Saccharomyces cerevisiae still dominates the market. Yeasts can metabolize glucose in two different ways: by oxidation or by fermentation. The oxidation mechanism provides cell growth, while fermentation provides the formation of ethanol. The metabolism of yeasts is influenced by oxygen and glucose concentrations; for example, a high concentration of glucose combined with a low concentration of oxygen may result in the Crabtree effect, which inhibits cell growth and favors the formation of ethanol [6]. Saccharomyces cerevisiae yeast shows cellular growth at both high and low oxygen concentrations, which is why it is so widely used [7]. Carbon and nitrogen are important sources of energy for Saccharomyces cerevisiae cells, and the availability and concentration of nitrogen can be associated with biosynthesis and ethanol; there are studies relating these effects [8]. Variations in temperature and pH impact the ethanol production in the fermentation process of Saccharomyces cerevisiae yeast [9]. A decrease in pH indicates a reduction in the formation of the product, whereas the inverse effect occurs with the temperature: the higher the temperature is, the smaller the amount of product formed. Yeasts present six main phases of growth: lag phase, acceleration phase, log phase, deceleration phase, stationary phase and decline phase [10-12]. With regard to the operation regime, the fermentation process can be batch, semi continuous or continuous [13]. According to Cinar, the batch process continues to be the one most commonly applied in bioprocesses because it is less susceptible to contamination [14]. The batch process consists of placing the inoculum and the culture medium in the bioreactor at the beginning of the process and removing the products only after the fermentation is completed; subsequently, the bioreactor is sterilized, and a new cycle begins. Bioreactors can be divided into two main types: conventional bioreactors (stirred tank type and aerated mechanical agitation) and pneumatic bioreactors. Each bioreactor is better adapted to the culture of a certain species of microorganism [15]. Among the different types of pneumatic bioreactors is the concentric cylinder airlift type. In this type of bioreactor, the air is injected by the base through the central cylinder (riser) and is returned the base by the external cylinder (down comer). The air promotes both the agitation of the culture medium and the aeration, with the advantage of causing fewer traumas to the cells and lower energy consumption than mechanical agitation bioreactors. A model is nothing more than a dynamic relation between variables. There are many ways to represent the same mathematical model, but a given representation may apply better to one system than to another [16]. According to Aguirre, the most commonly used types of representation of mathematical models are transfer functions and state–space representations [17]. As mentioned by Jacob and Zwartd, representation in state space is able to describe the relationship among several variables (inputs and outputs), and its difference from the transfer function is its ability to establish general control strategies [18]. The simulation of continuous mathematical models involves the resolution of differential equations, while the simulation of discrete models involves the resolution of difference equations. To solve analytically linear differential equations, the Laplace transform is used, and to solve linear difference equations, the Z-transform is used [17].
Modeling of the Saccharomyces cerevisiae fermentation process
Experimental data: The results from Ferreira et al., who carried out four experiments in an airlift bioreactor, were used to calculate the parameters and compare the results of the models developed in this paper [19]. The experiments were performed in a 6 L bioreactor at 32°C. Table 1 shows the experimental conditions of each experiment.
| Airlift bioreactor | ||
|---|---|---|
| Experiment | Air flow (L.m-1) | Substrate concentration |
| (g.L-1) | ||
| 1 | 15 | 5 |
| 2 | 10 | 5 |
| 3 | 5 | 5 |
| 4 | 15 | 10 |
Note: Adapted from Ferreira et al.
Table 1: Fold reduction in well area covered (WAC) by influenza virus spots (%) in TIZ treated cultures compared to untreated cultures in single cycle infection.
Microorganism: Fresh commercial yeast was utilized in this work. This yeast is found in baker’s yeast or supermarkets that sell baker yeast. This kind of yeast (Saccharomyces cerevisiae) has 30% dry mass and 70% humidity [19].
Culture media: The culture media were prepared in an appropriated recipient with distilled water, and the pH was regulated to 4.6 using acid. This media was sterilized in an autoclave with all necessary equipment and tools [8]. Table 2 shows the composition of the culture media.
| pH | Glucose | KH2PO4 | MgSO47H2O | Yeast extract | (NH4)2SO4 | Distilled water | Surfynol |
|---|---|---|---|---|---|---|---|
| 4.6 | 10 g.L-1 | 5.0 g.L-1 | 0.5 g.L-1 | 1.5 g.L-1 | 4.0 g.L-1 | - | 1.0 mL |
Note: Adapted from Ferreira et al.
Table 2: Composition of the culture media.
Process modeling: The process was modeled by three kinetic models, namely, those of Monod, Andrews and Verhulst. These models were solved in continuous and discrete time by using the Laplace and Z transforms, except for the Verhulst model. The ode 45 technique was applied on GNU Octave software, copyright © 1998–2018 John W. Eaton, to solve the continuous Verhulst model. Finally, to solve the Verhulst model in discrete time, the model equations were linearized, and the Z transform was applied to obtain the discrete model equations.
Model representation: The space state representation was used to solve the equation in the GNU Octave software.
The first step was to apply the mass balance on the Saccharomyces cerevisiae fermentation process using the Monod kinetic model. After obtaining the Monod model equations, they were represented in a state space matrix as shown in Equation 1, which is the process representation for the continuous Monod kinetic model.
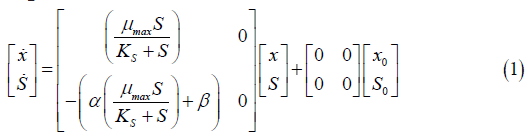
x=Variation of cell concentration over time; S=Variation of substrate concentration over time; μ max=Maximum specific rate of cell growth; KS=Saturation constant.
Equation 2 represents the same state space as Equation 5, but in discrete time. This model was obtained through the application of the Z transform to the continuous Monod equations.
xn=Cell concentration at time n.
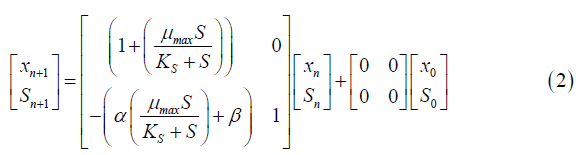
The same methodology applied in the Monod model was also applied to the Andrews model. The state space for continuous and discrete time is represented in Equations 3 and 4, respectively.
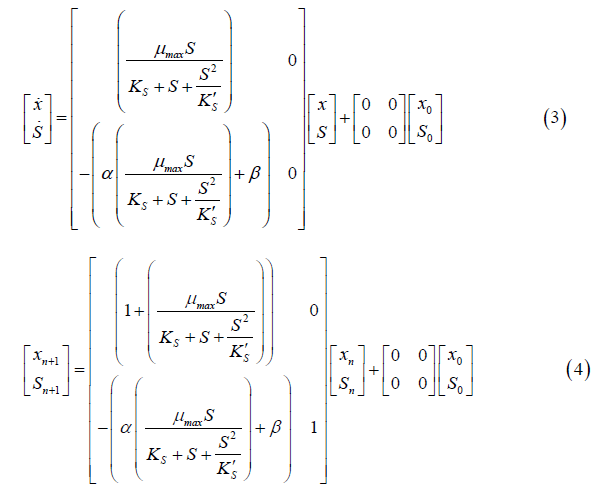
To solve the continuous Verhulst model, the differential Equations (5 and 6) and the ode 45 technique were applied. This model was not presented in state space representation because it is nonlinear.
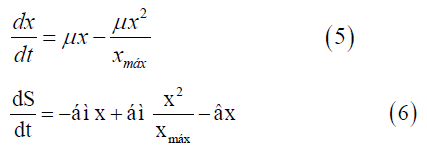
dx/dt=Variation of cell concentration over time; dS/dt: Variation of substrate concentration over time;
xmax=Maximum cell concentration.
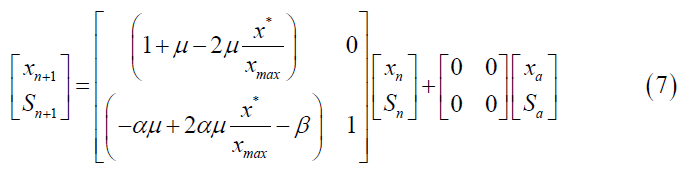
The Z transform cannot be applied to a nonlinear model. To write the Verhulst model in discrete time, the continuous model was first linearized. Then, the Z transform was applied to the difference equations, and the state space for the discrete Verhulst model was obtained (Equation 7).
After obtaining the mathematical representations for the Monod, Andrews and Verhulst models, the next step was to calculate the parameters. Table 3 shows the values obtained for the parameters. The continuous Monod model was plotted using all the parameter values. A comparison of the model and experiment 4 points is shown in Figure 2. For cell growth, which includes 2 h of fermentation, the experimental points are closer to the model curve than are the points after 2 h. For substrate consumption, the points are close to the model curve until the substrate concentration of the model curve reaches 0 g.L-1. Compared with the points of experiment 4, the same trend is observed for the discrete Monod model (Figure 3). Conceptually, the discrete model is more suitable for describing fermentation processes. These processes can describe population variations because individuals (in this case, cells) are always integer numbers, not fractions (for example, a population cannot contain 1000.5 cells). Analyzing the Andrews models in Figures 4a and 4b, the models (discrete and continuous) show a slower cell growth rate for 2 h of fermentation. The substrate consumption also decreases more slowly than do the experimental points until it reaches 0 g.L-1.
| Parameter | Unit | Estimation |
|---|---|---|
| μmax | (L.h-1) | 0.8109* e 1.3** |
| ks | (g.L-1) | 5.136 |
| k's | (g.L-1) | 42.1577 |
| α | Dimensionless | 2.8649 |
| β | Dimensionless | 0.012 |
| μmonod | (h-1) | 0.5357 |
| μandrews | (h-1) | 0.48 |
*μmáx=0.8109 was applied for the Andrews and Monod model. **μmáx=1.3 was applied for the Verhulst model.
Table 3: Composition of the culture media.

Figure 2: Comparison of the continuous Monod model and the experimental points (Experiment 4).
Note:  X exp.

Figure 3: Comparison of the discrete Monod model and the experimental points (Experiment 4).
Note: X exp.

Figure 4a: Comparison of the Andrews models continuous and the experimental points (Experiment 4).
Note: X exp.

Figure 4b: Comparison of the Andrews models discrete and the experimental points (Experiment 4).
Note: X exp.
Finally, we analyze the Verhulst model. In contrast to the Monod and Andrews models, the trends of the continuous and discrete time are not similar in the Verhulst models. This difference occurred because the continuous model was linearized prior to applying the Z transform and obtaining the discrete models. The Z transform can only be applied to linear systems. In Figures 5a and 5b, all the points of experiment 4 are closer to the curves of the continuous model than are all the other models. By contrast, the trends seen from the Monod model are observed in the discrete Verhulst model, in which the points of cell growth are closer to the model curve for 2 h of fermentation. The next step was to compare all continuous models and all discrete models. Figures 6a and 6b shows that even without calculating the accuracy of each model, the Verhulst model showed the best adjustment to the points of experiment 4 among the continuous and discrete models. To confirm the information observed in Figures 6a and 6b, the medium error for each model was calculated. The results are shown in Table 4. After the models were compared, the discrete and continuous Verhulst models were simulated for another initial condition, namely, a cell concentration of 1.2 g.L-1 and a substrate concentration of 5 g.L1. The results were compared with experiments 1, 2 and 3. The results are shown in Figures 7a and 7b. The Verhulst model showed the best accuracy for describing the Costa xanthan gum work [20]. Finally, the precisions of the continuous and discrete Verhulst models were calculated, and the results are shown in Figure 8.

Figure 5a: Comparison of the Verhulst models continuous and the experimental points (Experiment 4).
Note: X exp.

Figure 5b: Comparison of the Verhulst models discrete and the experimental points (Experiment 4).
Note: X exp.

Figure 6a: Comparison of all the continuous models.
Note:  S-S(t);
  X exp.

Figure 6b: Comparison of all the discrete models.
Note: S-S(t); X exp.

Figure 7a: Comparison of the Verhulst models discrete and the experimental points (Experiment 4).
Note:  X(E1);

Figure 7b: Simulation of the continuous and discrete Verhulst models for an initial cell concentration of 1.2 g.L-1 and an initial substrate
concentration of 5.0 g.L-1, and comparison with experiments 1, 2 and 3.
Note:  Xexp2;
  Sexp1.

Figure 8: Dispersion chart for the accuracy of the Verhulst model. The initial cell concentration was 1.2 g.L-1, and the initial substrate concentration was 5.0 g.L-1.
Note:  Modelo × Exp1;
Although discrete representations are not largely applied to bioprocesses, this work shows that the discrete representation has the same accuracy as the continuous models do. This finding indicates that the Z transform can be applied to fermentation processes. The parameters obtained for the Saccharomyces cerevisiae culture on a batch process in an Airlift bioreactor were μmáx=0.81 h-1 and Y(x/S)=0.35 gcel.gsac-1. The linear models (continuous or discrete) describe the cell growth for two hours of fermentation and the substrate consumption until it is completely depleted. The Andrews model does not accurately describe this process because it does not account for substrate inhibition. The model that best represents this process is the nonlinear Verhulst model, as observed in a similar process by Costa, with a medium error of 0.166 g.L-1 for cell growth and 0.346 g.L-1 for substrate consumption. When the initial conditions were changed, the precision of the Verhulst model did change, but it still satisfactorily represented the process.
The authors thank UFSJ and the Fundação de Amparo à Pesquisa do Estado de Minas Gerais (FAPEMIG) for their financial support.
Ethics approval and consent to participate
Not Applicable
Consent for publication
Not Applicable
Competing interests
The authors declare that they have no competing interests.
Founding
Not Applicable
Authors contributions
ERN conceived of the study, and paticipated in its design and coordenation and helped to draft the manuscript. IJBS carried out the fermentation tests to obtain the data. JCBN developed the methodology for modeling the process. ASO adapted the equations and obtained the parameters by creating and simulating mathematical models and drafted the manuscript. All authors read and approved the final manuscript.
[Crossref], [Google Scholar]
[Crossref], [Google Scholar]
[Crossref], [Google Scholar]
[Crossref], [Google Scholar]
[Crossref], [Google Scholar]
[Crossref], [Google Scholar]
[Crossref], [Google Scholar]
Citation: Oliveira AS, Nucci ER, Neto JCB, Santos IJB (2022) Application of the Z and Laplace Transforms to Panification Yeast Production Using an Airlift Bioreactor. Fungal Genom Biol. 12:197.
Received: 25-Jul-2022, Manuscript No. FGB-22-18550; Editor assigned: 28-Jul-2022, Pre QC No. FGB-22-18550 (PQ); Reviewed: 08-Aug-2022, QC No. FGB-22-18550; Revised: 15-Aug-2022, Manuscript No. FGB-22-18550 (R); Published: 22-Aug-2022 , DOI: 10.35841/ 2165-8056.22.12.197
Copyright: © 2022 Oliveira AS, et al. This is an open-access article distributed under the terms of the Creative Commons Attribution License, which permits unrestricted use, distribution, and reproduction in any medium, provided the original author and source are credited.