Poultry, Fisheries & Wildlife Sciences
Open Access
ISSN: 2375-446X
ISSN: 2375-446X
Research Article - (2023)Volume 11, Issue 3
This research mainly studies the application of GIS technology in the conservation field of New Zealand from two aspects. First, the GIS data in the Auckland region is used for the analysis of deforestation and reforestation. The publicly available GIS data downloaded from New Zealand’s website can be effectively used for forest conservation application. This study analyzed the annual reports of the Department of Conservation (DOC), Land Information New Zealand (LINZ), and New Zealand GIS in Conservation (GiC) in the past five years. The findings show that although the three organizations have different directions in the application of GIS technology, GIS technology has been and is being applied to their conservation work to a tremendous extent by the three organizations. The use of GIS technology meets their resource management, analysis, display, and decision making needs in the conservation field. Through the analysis of various GIS technology applications in New Zealand’s conservation, this study summarizes the value of GIS technology used in New Zealand’s conservation work and gives some recommendations for improvement in New Zealand’s conservation work.
Geographic information system; Technology; Conservation; Deforestation; Reforestation
Conservation in New Zealand
Conservation plays an important role in the health and wellbeing of New Zealanders. Conservation refers to the protection of valuable resources, including natural resources such as animals, vegetation and forests, as well as indigenous culture, parks and other resources. New Zealand has a number of protected areas, including its famous national parks, a large number of reserves, various conservation parks and stewardship areas. Although people have now generally accepted the fact that the natural environment is good for health. Blaschke in his report systematically studied the relationship between conservation and Health and Wellbeing (HWB) benefits, and he pointed out the importance of conservation management to the well-being of New Zealanders in New Zealand Public Conservation Areas (PCAs). Public parks and green spaces may largely be seen as key areas that mediate between natural and social capital (between ‘people and nature’) in areas where most people live, work and recreate. The exposure to natural environments has direct positive effects on HWB. The researchers have studied specific conservation fields. Landscape conservation, bat conservation, wetland conservation, seabird conservation, water conservation were studied [1].
Conservation has made a significant contribution to New Zealand's economy. The conservation of New Zealand is not only to maintain the various resources in the protected areas, but also to provide humans with use and entertainment. Over time, conservation has not only been about protecting the environment and resources, but has become a big business in New Zealand. According to research conducted by the department of conservation, Fiordland national park alone, one of New Zealand’s natural attractions, can generate $196 million in regional economic output and 1,600 jobs. New Zealand is famous worldwide for its beautiful scenery and indigenous culture. Millions of tourists visit New Zealand every year. Tourism industry has always contributed enormous economic value to New Zealand. Before COVID-19, the tourism industry directly employed 8.4% of New Zealand's labor force, and it was New Zealand's largest export industry. The beauty of New Zealand is inseparable from the conservation of the natural environment and its historical heritage by the whole society [2].
The New Zealand government and local people attach great importance to conservation. There are many organizations, institutions and companies dedicated to conservation in New Zealand such as the Department of Conservation (DOC), Land Information New Zealand (LINZ), and New Zealand GIS in Conservation (GiC). As a public service department of New Zealand, DOC is committed to the conservation of New Zealand's natural and historical heritage. DOC’s responsibility is to advocate and promote the conservation of various natural and historical resources to guarantee the long term interests of New Zealanders for generations. DOC is also responsible for promoting the recreation of natural and historical resources and the use of tourism under the precondition of ensuring resource conservation. In 1987, New Zealand passed the ‘conservation act 1987’, which defined conservation as the protection of natural and historical resources, to ensure that the public can enjoy these inherent resources for generations [3,4]. This act also confirmed the establishment of DOC. The DOC’s budget for the 2006/2007 fiscal year was $277.2 million, of which about 47% of the expenses were spent on the protection of species, natural heritage and landscapes. In addition, 42% of the expenses were spent on managing the recreational use of conservation resources. The backcountry huts, bridges, trails and other tourist facilities managed by DOC are worth $400 million. DOC needs to manage 30% of New Zealand's land area and less than 1% marine environment. Due to New Zealand’s isolated geographical location, the diversity of New Zealand’s native flora and fauna is vulnerable to damage by invasive species. Therefore, managing the diversity of New Zealand’s indigenous species is of vital importance. The GIS technology studied in this report is regarded by the DOC as a vital biodiversity management tool [5].
GIS application for conservation in New Zealand
GIS, also known as geoinformatics, is a subject about acquiring, storing and analysing spatial and geographic data. GIS technology has been already widely used for conservation worldwide. GIS technology could play a huge role in natural resource management and planning. GIS technology can be used as a management tool to assist decision-making in solving natural resource problems. This is achieved through the GIS functions of producing geographic information, monitoring, analysis, forecasting, and visualization (Figure 1) [6].
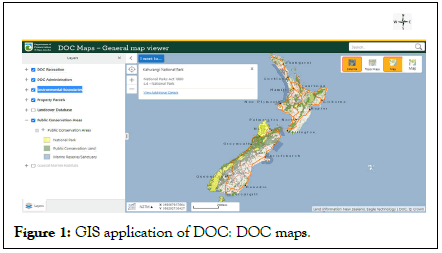
Figure 1: GIS application of DOC: DOC maps.
GIS technology has been used for conservation by the organizations, institutions and companies in New Zealand. The application of GIS technology can help conservation practitioners to better plan, design and develop resources. DOC uses two GIS technologies, web mapping application and map data, to manage conservation resources. DOC uses the GIS application ‘DOC maps’ to manage the information and display the locations of PCAs, environmental boundaries, and property parcels, etc. These geospatial information help DOC to manage resources including PCAs, tracks, huts, campsites, hunting permit areas, deer and pest distribution. Studying New Zealand’s efforts and progress in the use of GIS technology in conservation work is instructive for improving conservation work, so that conservation work can better serve tourism and promote New Zealand’s economic and socially sustainable development [7].
Challenges in conservation
People have gradually realized the importance of conservation and have begun to take actions which include various challenges. New Zealand has cleared 44% of its land area, approximately 11.9 million hectares of agricultural land to try to reduce the degree of deforestation. In addition, New Zealand passed the 'forestry rights registration act 1983' to defend the rights of forests, but it was considered that the effect was not obvious. New Zealand has also established a world class property data collection structure to support its 'climate change response act 2002'. New Zealand regards forestry development as the main tool to respond to the 'Kyoto protocol'. Accordingly, New Zealand has implemented the REDD programmes, linking reforestation and deforestation with carbon emissions. The implementation of the REDD plan allows private forest owners to have the opportunity to access carbon emission credits, thereby reducing deforestation. New Zealand uses 1080, a kind of poison to control pests. 1080 can kill most invading rats and protect threatened species. However, the use of 1080 has always been accompanied by some controversies. Some people in the hunting community, anti-fluoride campaigners and animal rights groups oppose the use of 1080 [8,9].
Complex conservation work brings challenges to conservation managers. Many protected areas must not only protect biodiversity for future generations, but also provide recreational functions, and at the same time provide tourism jobs for the communities. These multiple goals conflict with each other and pose complex challenges for conservation managers. Ensuring the richness of species is an important aspect of conservation. Performing detailed primary surveys is a good way to quantitatively understand species richness, but this approach is often time consuming and laborious, and brings difficulties to conservation management. In wetland conservation, satellite images can be used to locate wetland locations, but this process is very time consuming and increases the difficulty of conservation management [10].
Research questions
This research attempts to answer the following questions:
• How can GIS data have used for conservation in Auckland?
• How are organizations of New Zealand DOC, LINZ and GiC
using GIS technology for conservation?
Research objectives
The overall goal of this study is to explore the application situation and identify the potential and deficiencies of GIS technology in the conservation field of New Zealand. The main objectives include the following:
• To use GIS data to verify whether it can be effectively used in
the conservation industry of New Zealand.
• To determine the GIS technology which is applied by New
Zealand’s conservation organizations?
• To identify the strengths and limitations of GIS technology
applications in New Zealand’s conservation.
Research design
This research conducts GIS data analysis and annual report analysis. The GIS data analysis chooses the Auckland region to justify that the GIS data can be used for the conservation of Auckland. Annual report analysis uses the three organizations LINZ, DOC and GiC in New Zealand to identify how GIS technology is being used by New Zealand’s organizations. This research generates new insights on how currently GIS technology is being used in New Zealand's conservation [11].
Data collection
This research data includes GIS data and annual reports.
GIS data
New Zealand land cover data and area codes data are needed to conduct GIS data analysis. Land cover data includes the information about different land cover classes such as forest resources. Area codes data includes all regional boundary information of New Zealand. The New Zealand government provides online map browsing and downloading of environmental data and land cover data [12]. They can be downloaded on the websites of the New Zealand Land Resource Information System (LRIS).
Annual reports
The three organizations DOC, LINZ, and GIC in New Zealand are using GIS technology for conservation. This research uses their annual reports to analyse. This research chooses their most recent annual reports to analyses. Their annual reports can be downloaded on their websites shown in Table 1. Most of the annual reports are in the form of PDF files and can be downloaded directly. DOC's annual reports include complementary technical information such as their factsheets, some of which are in the form of online documents and can only be opened and viewed online. The annual report analysis determines how these organizations use GIS technology for conservation every year [13].
| Organization name | Years of annual report |
|---|---|
| DOC | 2015/16, 2016/17, 2017/18, 2018/19, 2019/20 |
| LINZ | 2015/16, 2016/17, 2017/18, 2018/19, 2019/20 |
| GIC | 2014/15,2015/16, 2017/18, 2018/19, 2019/20 |
Table 1: Organizations to be annual report analysed.
Data analysis
GIS data analysis: Deforestation analysis can be used to monitor and protect forest resources. To get the deforestation result is to find all plots when they change from forest class to non-forest class. Reforestation is the opposite analysis to find all plots changing from non-forest class to forest class. If a plot was forest in one year and changed to non-forest in another year, it is a deforestation area [14].
This analysis uses ArcGIS software to compute the deforestation and reforestation based on the land cover map within a specific area of New Zealand, and then show the result in the form of thematic map. ArcGIS is well-known GIS software developed by Environmental Systems Research Institute (ESRI). Which can be used to process, display and analyse massive GIS data? The cover map of New Zealand is the GIS data analysed in this research. The map is a kind of classification data of New Zealand's land cover. This map includes numerous resources including those needs to be protected, such as forests, rivers, etc. The process of this analysis can show GIS technology can be applied to the conservation field in New Zealand [15].
This analysis selects Auckland region as the research area. Auckland is the largest city in New Zealand with a population of approximately 1.5 million. Auckland is one of New Zealand's most developed regions and is the industrial and commercial centres of New Zealand. With the rapid growth of New Zealand’s population, the Western and Southern regions of New Zealand have been developed. Therefore, Auckland is selected as the research area to analyse the degree of its deforestation as a verification of the application of GIS technology in the conservation field of New Zealand.
Using thematic maps to display the results of deforestation/reforestation can make the results better understood. In this thematic map, deforestation plots are displayed in red and reforestation plots are displayed in green. At the same time, map elements such as north arrow and scale are added to the thematic map.
Annual reports analysis: This research analyses the latest five years annual reports of three organizations DOC, LINZ, and GiC that are committed to the conservation related work in New Zealand [16]. This analysis of the annual report uses content analysis. Content analysis is a method that obtains patterns from texts to help researchers extract meaningful knowledge from texts. The analysis mainly looks for the applications of GIS technology in the conservation organizations. Which helps to understand how GIS technology including GIS data and GIS functions helps the organization to carry out conservation work, and how GIS technology has improved their work?
The findings of the study are presented in two parts. The findings in part one are from the GIS data analysis. Part two is from analysis of annual reports.
GIS data analysis
Deforestation: This research aims to get the deforestation result between 2008 and 2018, which compares the codes stored in field ‘class_2008’ and field ‘class_2018’. By looking up Table 2, code ‘1’ represents ‘built-up area (settlement)’ and code ‘71’ represents ‘exotic forest’, so the selected plot is a forest area in 2008 and changed to non-forest area in 2018, this plot is a deforestation area. ArcGIS has powerful analysis functions. It can quickly find all the deformation plots from millions of plots within minutes. ArcGIS can also present deforestation and reforestation results in the form of a thematic map with its cartography functions [17].
The data sample of this analysis is opened in ArcGIS and then zoomed to an area around Auckland. The attributes of map features are structured and stored in the data table. The ‘table’ window shows the attributes of all the plots in the map. Moreover, the ‘identify’ window shows the attribute data of the selected plot. By using identify tool to click one plot within the map window, the attribute can be displayed in the ‘identify’ window. This map data includes many attributes storing different numbers. For example, ‘class 2018’ stores the code representing the class of this area in 2018, while ‘class 2008’ represents the class of this area in 2008. Table 2 gives a whole list of meanings of different codes. The codes ‘68’, ‘69’, ‘70’ and ‘71’ among all classes belong to forest class.
| Class code | Class name | Class code | Class name |
|---|---|---|---|
| 0 | Not land | 44 | Depleted grassland |
| 1 | Built-up Area (settlement) | 45 | Herbaceous freshwater vegetation |
| 2 | Urban parkland/Open space | 46 | Herbaceous saline vegetation |
| 5 | Transport infrastructure | 47 | Flaxland |
| 6 | Surface mine or dump | 50 | Fernland |
| 10 | Sand or gravel | 51 | Gorse and/or broom |
| 12 | Landslide | 52 | Manuka and/or Kanuka |
| 14 | Permanent snow and ice | 54 | Broadleaved indigenous hardwoods |
| 16 | Gravel or rock | 55 | Sub alpine shrubland |
| 15 | Alpine grass/Herbfield | 56 | Mixed exotic shrubland |
| 20 | Lake or pond | 58 | Matagouri or grey scrub |
| 21 | River | 80 | Peat shrubland (Chatham Is) |
| 22 | Estuarine open water | 81 | Dune shrubland (Chatham Is) |
| 30 | Short-rotation cropland | 70 | Mangrove |
| 33 | Orchards, Vineyards or other perennial crops | 64 | Forest-harvested |
| 40 | High producing exotic grassland | 68 | Deciduous hardwoods |
| 41 | Low producing grassland | 69 | Indigenous forest |
| 43 | Tall tussock grassland | 71 | Exotic forest |
Table 2: Land covers class code of New Zealand.
This analysis selects Auckland region as the research area. Auckland shown in Figure 2 is chosen as the research area to analyse the degree of its deforestation as a verification of the application of GIS technology in the conservation field of New Zealand.
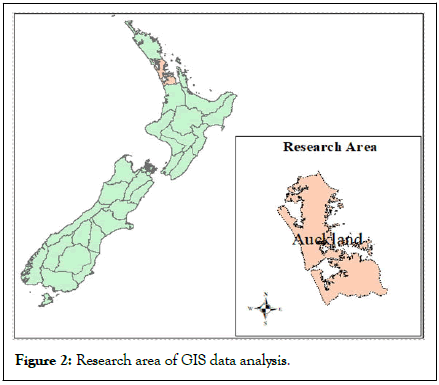
Figure 2: Research area of GIS data analysis.
The select clauses used in the ‘select by attributes’ function of ArcGIS are shown in Table 3.
| Select clause | Meaning | |
|---|---|---|
| Deforestation select clause | "Class_2008" <=71 AND "Class_2008" >=68 AND ("Class_2018" >71 OR "Class_2018" <68) | The value of ‘Class_2008’ falls between 68 and 71 and the value of ‘Class_2018’ does not fall between 68 and 71 |
| Reforestation select clause | "Class_2018" <=71 AND "Class_2018" >=68 AND ("Class_2008" >71 OR "Class_2008" <68) | The value of ‘Class_2018’ falls between 68 and 71 and the value of ‘Class_2008’ does not fall between 68 and 71 |
Table 3: Select clause used in ArcGIS.
Figure 3 shows the result of deforestation analysis of Auckland from 2008 to 2018. The thematic map uses the red region to represent the region change from forest area to non-forest area shown in the left map. The right map shows the reforestation using green areas from year 2008 to year 2018 [18].
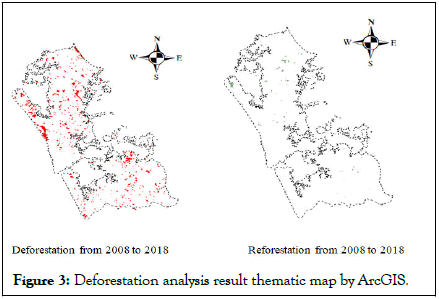
Figure 3: Deforestation analysis result thematic map by ArcGIS.
Annual reports analysis
DOC: As shown in Table 4, DOC has applied GIS technology in their conservation work in five main aspects from 2015/16 to 2019/20, such as pest control, weed control, native plants and animals, ecosystems conservation and recreation, a summary of analysis results of DOC’s annual reports are listed.
| GIS technology related application used for | |
|---|---|
| Pest control |
|
| Weed control | |
| Invasive species | |
| Native plants and animals |
|
| Ecosystems conservation |
|
| Recreation |
|
Table 4: GIS application for conservation in DOC’s annual reports from 2015/16 to 2019/20.
Because the content of each DOC’s annual report includes the main document in form of a pdf file and its complementary technical information in the form of online web pages which are the fact sheets referred by the main document. GIS technology related keywords and maps using GIS technology are both found within DOC’s annual reports.
Pest control
Pests: DOC is using GIS technology to control the amount of pests, such as possums, hares, ungulates, rabbits, mustelid and commercial deer. They are all the targets of pest control.
In 2015/16, GIS technology was used by DOC to direct possum control and hare control efforts. Because more possums occur in the woody areas and fewer occur in the non-woody area. In contrast, more hares are in non-woody ecosystems, and rare are in woody ecosystems. Thematic maps, shown in Figure 4, created based on GIS technology are used to show the locations of woody areas including forests and shrublands and non-woody areas in New Zealand. The map can clearly represent the relationship spatially between ecosystems and the locations of possums and hares. It can help DOC analyse the distribution of possums and hares and calculate the abundance of possums and hares. DOC also used this method for ungulate control [19].
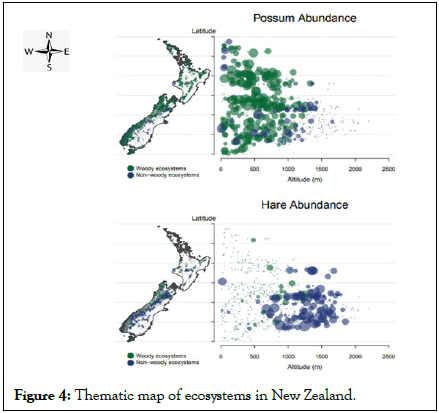
Figure 4: Thematic map of ecosystems in New Zealand.
From 2016/17 to 2019/20, another type of GIS technology was used by DOC to direct possum control efforts. An embedded web mapping application developed based on GIS technology shown in Figure 5 was used to display the distribution of possums in PCL of New Zealand. This application uses an interactive map to show different abundance indices, such as TCI, WTI and CCI. The map provides a nationwide view and shows various index levels with gradual colors. It can clearly show the abundance indices of different sites in PCL all over New Zealand. GIS technology provides an easy way to show those professional indicators and help users to better understand the national distribution of possums. DOC also uses this method for hare, ungulate and rabbit controls from 2016/17 to 2019/20.
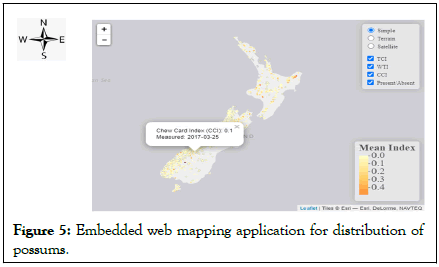
Figure 5: Embedded web mapping application for distribution of possums.
As shown in Figure 6 below, DOC used GIS technology based thematic maps in 2017/18 to show the landscape of pest control including possum and mustelid. The locations where continuous pest control is active at significant scale are displayed in the maps. The use of a map can easily analyse and clearly represent pest control in a nationwide view.
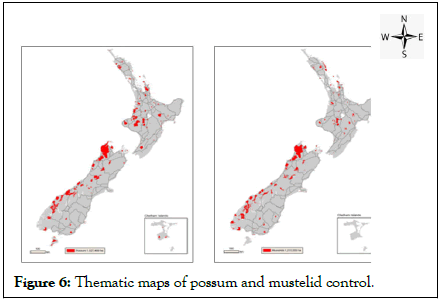
Figure 6: Thematic maps of possum and mustelid control.
The increase in the number of commercial deer threatens the forests and vegetation of New Zealand’s national parks. DOC uses GIS technology as a tool to monitor commercial deer locations in the central Fiordland and Secretary Island in 2019/20. As shown in Figure 7 below, an interactive map created based on GIS technology could show the exact positions of monitoring sites of commercial deer. Users can also get the site name by simply clicking the icons of the sites. Based on this map, DOC produced advanced analysis methods on commercial deer control [20]. This GIS application helps DOC to monitor the number of commercial deer and make decisions to adopt control actions.
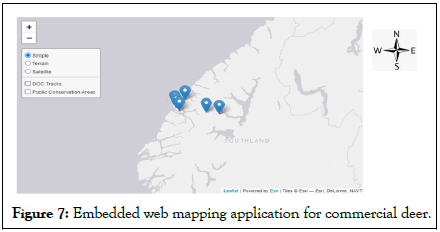
Figure 7: Embedded web mapping application for commercial deer.
Mammalian pressures: From 2015/16 to 2019/20, DOC applied a web mapping application based on GIS technology to display the mammal distributions in New Zealand shown in Figure 8 below. This application provides a list of all mammal predators in New Zealand. It provides key clues of each mammal on its left panel such as distinctive features, size and eye shine. Which helps the users to understand significant features of the mammal predators? This application also provides an interactive map in a nationwide view to show the locations of each mammal in New Zealand. The users can get the name and area of the selected region by simply clicking the map. The use of GIS creating this web mapping application helps DOC conduct the work of pest control efficiently and effectively.
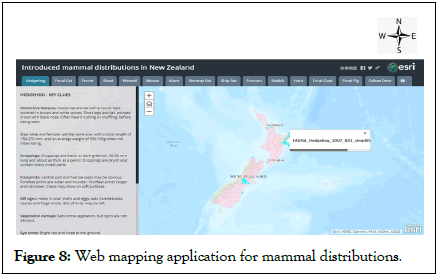
Figure 8: Web mapping application for mammal distributions.
Seeding: Seeds can be used as food for New Zealand birds and introduced mammals, so the frequency of seeding has a certain degree of impact on the local ecosystem. Monitoring the relationship between seeding frequency and local species is a challenge for conservation managers. The mapping application developed based on GIS technology can help conservation managers solve this problem. DOC adopted this GIS application shown in Figure 9 from 2015/16 to 2017/18. The monitoring sites are displayed on an interactive map. With a simple click, the user can obtain detailed information about the monitoring site, such as species name and seeding density. In addition, different colours are used to indicate the density of seeding, light colours represent low density, and dark colours represent high density. The clear expression and spatial display brought by GIS technology can help conservation managers to understand the relationship more easily between the detected species and the seeding intensity and to identify priority areas for pest control [21].
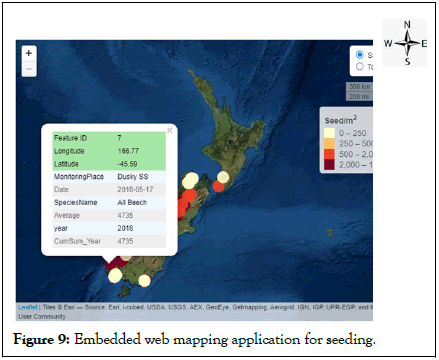
Figure 9: Embedded web mapping application for seeding.
Pesticides: New Zealand uses pesticides to control the number of pests, such as controlling possums to prevent them from spreading diseases to poultry. How to prevent the installation of pesticides from affecting the public to go to PCL is a challenge. DOC used GIS technology in 2017/18 to help the implementation of this work.
This is a web mapping application based on geographic information system technology. The public can obtain detailed information on recent and upcoming pesticide operations from this website. The interactive map provided by the website allows users to click to view the pesticide operation information of pest control in each region. The use of GIS technology helps the public to understand how DOC is protecting threatened species by using pest control operations.
Weed control: Because conifers are flammable species, the continuous spread of invasive conifers has become a growing problem in New Zealand's conservation management. For example, in the eastern part of the South Island of New Zealand, because of the rampant conifers, it is thought that there will be huge fires, which will have a negative impact on the surrounding biodiversity and economy. GIS technology is used to control conifers.
GIS technology based thematic maps were used by DOC in 2015/16 to show the locations of woody weeds, non-woody weeds, and conifers shown in Figure 10. Because more nonwoody occurred throughout most PCL. In contrast, fewer wood weeds occurred, and invasive conifers as a kind of woody weeds fit this feature. The use of GIS creating the thematic maps can easily analyse and clearly represent spatially non-wood weeds area, wood weeds area, and conifer area. Based on the maps from GIS technology, the conservation management conducted further control operations.
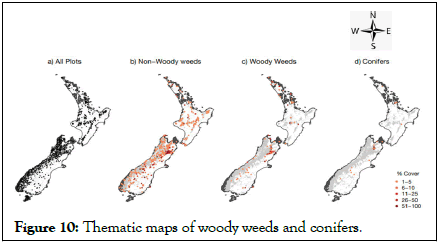
Figure 10: Thematic maps of woody weeds and conifers.
Invasive species: New Zealand's native ecosystem is facing pressure from invasive species. Scientific evaluation of these pressures can help conservation managers to formulate reasonable protection plans instead of applying excessive protection resources to areas that do not need protection. Calculating the pressure index of invasive species across New Zealand requires consideration of various spatial factors such as regional temperature, forest intensity and distance to roads. GIS technology is good at the analysis of different spatial factors overlapped.
DOC used GIS technology in 2015/16 to map pressure index and plant endemism in New Zealand shown in Figure 11. Thematic maps are used to show the locations of pressure index and plant endemism. Because invasive species including mammals weeds and introduced birds are the source of pressure of native ecosystems including forests and shrublands. In addition, plant endemism depends on the pressure. The use of a map can easily analyse and clearly represent spatially the result of pressure index and plant endemism.
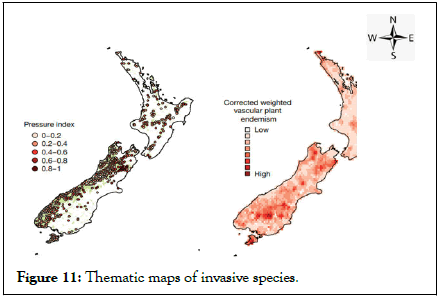
Figure 11: Thematic maps of invasive species.
Native plants and animals
Native tree species: It is one of the important tasks for conservation managers of New Zealand to confirm whether the tree recruitment rate and mortgage rate are in balance. Because through this indicator, conservation managers can evaluate whether the tree species is in a healthy and sustainable status. GIS technology was used to map the balance of native tree species in New Zealand in 2015/16 shown in Figure 12. The thematic maps show the distribution of tree recruitment and tree mortality. The use of GIS technology creating the thematic map can clearly represent tree mortality and tree recruitment spatially, easily find out geographic differences between, and help the conservation managers to make good decisions whether they should take further actions.
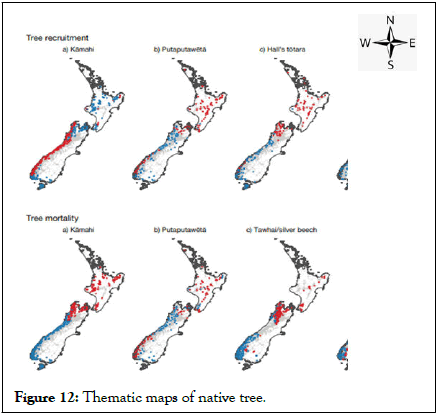
Figure 12: Thematic maps of native tree.
Native animals: New Zealand’s native animals are facing various threats, and increasing the population of these species is a challenge for conservation managers. GIS can be used for the management of protected animals. DOC is trying to use GIS technology to protect these threatened animals such as long tailed bats, Australasian bittern, South Island robin, kakapo, birds, kaka, kiwi, nocturnal birds and short tailed bats.
The conservation team set up a monitoring site in Eglinton valley and studies the relationship between pest control efforts and the population of South Island long tailed bats then make future plans based on monitoring results. In 2015/16, 2016/17, 2018/19 and 2019/20, a GIS application, embedded web mapping application, was used to monitor the population of long tailed bats in Eglinton valley in New Zealand shown in Figure 13. This application can switch the background between satellite imagery and topographic map by simply clicking on the tile in the upper right corner of the window. This GIS technology based mapping application is an effective tool helping conservation teams conducting monitoring work. Greaves, et al., successfully used GIS technology to predict the habitat of the endangered long tailed bat in New Zealand’s South Island. They parameterized the environment of long tailed bat life, including slope, land cover, etc., DOC also applied this GIS technology to South Island robin from 2015/16 to 2016/17, kakapo from 2015/16 to 2018/19, short tailed bats from 2015/16 to 2018/19, and kaka in 2019/20.
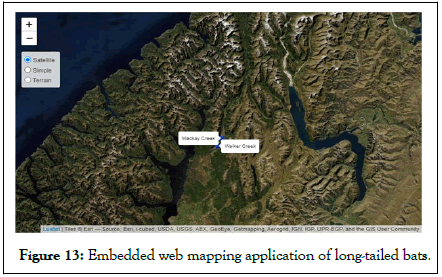
Figure 13: Embedded web mapping application of long-tailed bats.
From 2015/16 to 2016/17, a GIS application, an embedded web mapping application shown in Figure 14, was used to display the distribution of the Australasian bittern pre 1900 and post 1990 in New Zealand. This application can link two windows. The left window shows the pre 1900 distribution of Australasian bittern, and the right shows the pro 1900 distribution. By moving any side of the window and zooming in, users can compare the different distributions easily between the two maps. The use of GIS technology creating this web mapping application can help conservation managers understand after 1900 what areas the number of Australasian bitterns has been greatly reduced and should take priority actions.
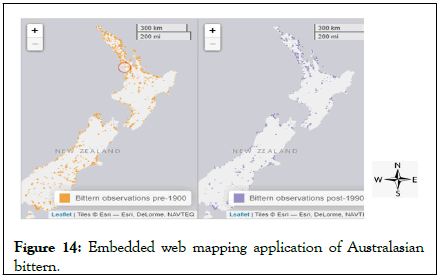
Figure 14: Embedded web mapping application of Australasian bittern.
From 2016/17 to 2019/20, DOC used a GIS application, an embedded web mapping application shown in Figure 15, to monitor the estimated species richness in PCL of New Zealand. This application uses an interactive map to show species richness including several indices including dominance, total, indigenous and introduced. It provides a nationwide view and shows richness levels from 0 to 100 with gradual colors. Users can get the richness information of any site by simply clicking the map. Users can switch the background between satellite imagery, topographic map, and simple map by simply clicking on the tile in the upper right corner of the window. Users can also switch the richness between dominance, total, indigenous and introduced. The use of GIS technology based maps can help users clearly understand the species richness all over New Zealand and seems like an excellent decision supporting tool for conservation managers.
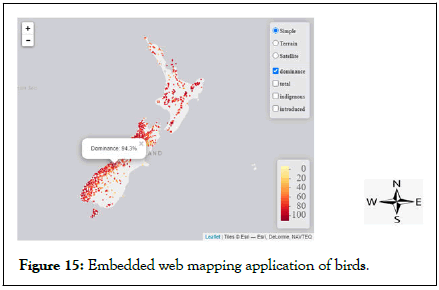
Figure 15: Embedded web mapping application of birds.
A GIS application, an embedded web mapping application shown in Figure 16 below, was used in 2016/17 to show abundance and distribution of kaka in specific study sites from 2006 to 2015 in Waitutu forest of New Zealand. It shows abundance and distribution levels from 0 to 6+ with gradual colors. If the user clicks the map, the abundance and distribution will switch from 2006 to 2015. The GIS technology based map can clearly show the change between different years in the same region. Based on which conservation managers can make better decisions for kaka conservation.
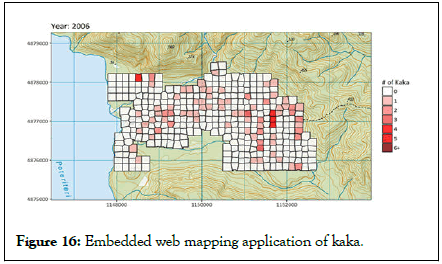
Figure 16: Embedded web mapping application of kaka.
As part of the kiwi protection plan, GIS technology is used for territory mapping in 2018/19, which provides basic information for kiwi protection, can help understand the population of kiwi, and provide decision support for predator control.
GIS applications, three embedded web mapping applications shown in Figure 17, were used in 2019/20 to monitor nocturnal bird distributions on PCL of New Zealand. The first interactive map shows nocturnal species distributions based on the data from recordings of automatic recording devices. It provides a nationwide view and shows tranquillity levels with gradual colours. Users can see distributions for only one species by only clicking the species list on the right of the window. Similarly, the second and third maps respectively show the distribution of previously unknown populations discovered by automatic recording devices and the detection probability of one bird. The conservation staff uses automatic recording devices to record the number of birds at each site. These maps can synchronize with the data of these devices. Based on these GIS technologies based maps, DOC has developed a national monitoring project to evaluate and predict the status and trends of more than 1,400 locations in PCL.
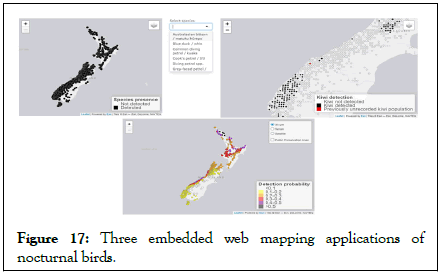
Figure 17: Three embedded web mapping applications of nocturnal birds.
Ecosystems conservation
Climate and conservation: Climate can affect the distribution of species, which in turn affects the priority of conservation efforts. Using GIS, climate data and protected area species data can be overlapped on the same map. In 2015/16, DOC used GIS technology to map what areas need to be a focus for protection in New Zealand shown in Figure 18. Thematic maps are used to show different grades from 0 to 100 with different colours. Because humidity and temperature determine the area to be protected, climatic databases and spatial databases are used as data sources for analysis. The use of a GIS creating the map can help conservation managers analyze and clearly represent the relationship spatially between climate and conservation, and determine which areas needed to be a focus for protection.
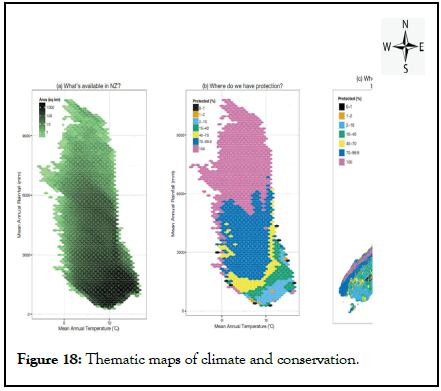
Figure 18: Thematic maps of climate and conservation.
Protection status: GIS technology was used from 2015/16 to 2019/20 to map and analyse how well the threatened ecosystems are protected in New Zealand. Naturally, uncommon ecosystems have been mapped. Ecosystems are mapped as a combination of GIS data including points linear, and polygons features. Landsat enhanced thematic mapper satellite imagery are used to define the contemporary extent. The data sources are from surveys, fieldwork, and imagery of local and central government. GIS analysis functions are used to examine protection status.
Marine: From 2015/16 to 2019/20, a GIS application, an embedded web mapping application shown in Figure 19, was used to display the distributions of marine reserves and marine mammal sanctuaries in New Zealand. This application uses an interactive map to show the locations of each area of marine reserves and marine mammal sanctuaries. Users can get the detailed information of the area by simply clicking the map. All the data shown in this mapping application are from GIS summaries and calculations. The use of GIS technology helps users understand the status of marine regions in the whole New Zealand.
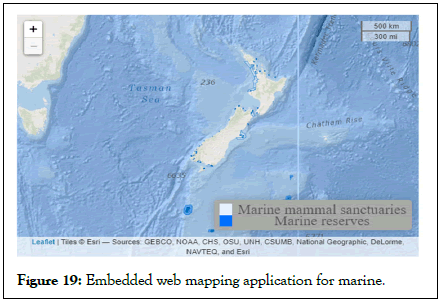
Figure 19: Embedded web mapping application for marine.
Freshwater: In 2015/16, DOC developed a GIS application, an embedded web mapping application for the estuarine program team to display the estuarine related resources in New Zealand. This application uses three interactive maps to show places of interest as well as places where management agencies and local estuary care groups are active. It provides a nationwide view and shows up estuaries where less conservation activity is going on or is recorded.
The same GIS technology as 2015/16 was used in 2016/17, and more GIS data around New Zealand are added to the interactive maps including wader sites, wetland, restoration groups, and sites monitored. DOC invested $2.6 million and is developing a GIS tool in 2018/19. This project has a four years period and requires mapping for the protection of threatened fish species in the freshwater ecosystem. The use of GIS technology can help prioritise and provide decision support for management. Eikaas, et al., proposed a spatial modelling method to predict the habitats of two diadromous fish in New Zealand rivers based on the characteristics of their preference for low density development and small streams.
Managed ecosystem: From 2017/18 to 2019/20, a GIS application, an embedded web mapping application shown in Figure 20, was used to represent change in Ecological Integrity (EI) of Ecosystem Management Units (EMUs) on PCL in New Zealand. This application uses an interactive map to show ecological integrity of EMUs over the long-term management in 2017/18. It provides a nationwide view and shows EI and change in EI with gradual colors. Users can switch EI options by simply clicking on the tile in the window. This GIS application can help to represent the EI related information of the EMUs in PCL all over New Zealand.
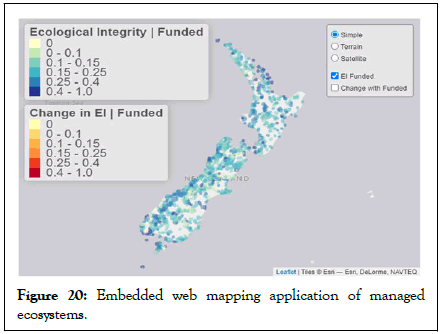
Figure 20: Embedded web mapping application of managed ecosystems.
Estuaries: In 2018/19, GIS technology is used to protect estuarine environments in New Zealand. An interactive map application is developed to guide users for restoring estuaries. Best practice resources are highlighted in this application. GIS data of mangroves and seagrass are also used for estuarine conservation.
Recreation
DOC assets: From 2016/17 to 2019/20, a GIS application, an embedded web mapping application shown in Figure 21, was used to display the distribution of visitor assets in New Zealand. This application uses an interactive map to show different inventory levels. It provides a nationwide view and shows distribution levels with gradual colours. Users can get the detailed inventory of the region by simply clicking the map. Users can also switch the asset type by simply clicking on the tile in the window. The use of GIS technology creating this mapping application can help public users find out the visitor assets of the regions all over New Zealand.
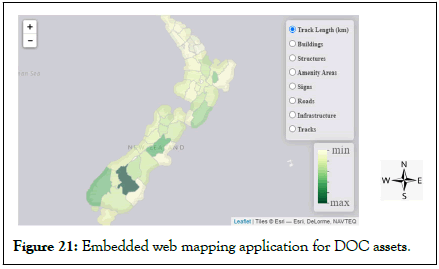
Figure 21: Embedded web mapping application for DOC assets.
Visitor satisfaction: DOC used GIS technology in 2017/18 to map natural tranquility and soundscapes in national parks of South Island in New Zealand. The use of the map can help management better understand visitor experiences in national parks and make informed plans to improve visitor satisfaction.
A GIS application, an embedded web mapping application shown in Figure 22, is used in 2019/20 to display the locations of day hikes and short walks in New Zealand. This application uses an interactive map. Users can choose to display only day hikes or short walks or both. If the user clicks the map, the name of the location is shown in a pop-up window. Conservation staff of DOC used this GIS application to analyse visitor satisfaction.
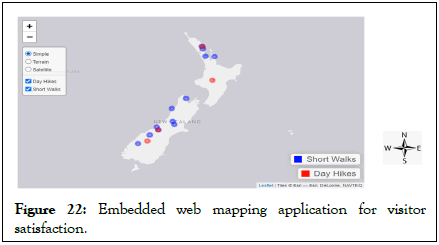
Figure 22: Embedded web mapping application for visitor satisfaction.
Tranquility mapping: In 2018/19, DOC used a GIS application, an embedded web mapping application shown in Figure 23, to represent tranquility level in Aoraki/Mt Cook and Westland Tai Poutini national parks of New Zealand. This application uses an interactive map to show five tranquility levels from very low to very high. It provides a nationwide view and shows tranquility levels with gradual colours. Users can also see locations of public tracks by using the tool at the top right. This GIS application can help conservation managers to monitor the impact of recreation on conservation areas.
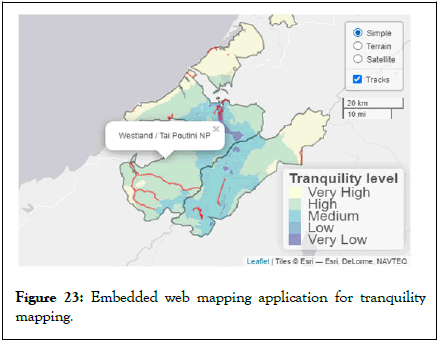
Figure 23: Embedded web mapping application for tranquility mapping.
Damaged tracks and assets: GIS technology is used in 2019/20 to map damaged tracks and assets across the southern South Island shown in Figure 24. Thematic maps are used to show the locations of damages. This is part of the emergency response to the Southland flood. The use of GIS creating the map can easily analyze and clearly represent the damage locations and help management to make decisions to prioritize.
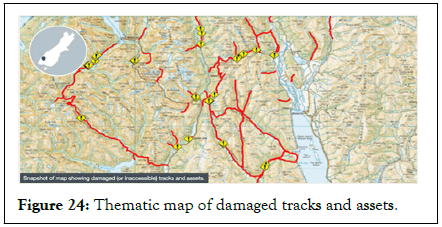
Figure 24: Thematic map of damaged tracks and assets.
LINZ: LINZ leads the open government information and data programme, which makes government held information more usable and available. Therefore, the establishment of spatial basic geographic information infrastructure is one of the important targets and work of LINZ. The geographic information datasets of LINZ include aerial imagery, nautical charts, property information and topographic maps. Location information, spatial information and geospatial information have the similar meaning and can be used interchangeably. Therefore, in the analysis process, the above keywords such as ‘property information’ and ‘nautical’ are also used as the search keywords. GIS technology was used by LINZ in their conservation work from 2015/16 to 2019/20 in four main aspects, including natural events, supporting Maori, weed control and land resources.
Natural events: This research analyses LINZ’s annual report and the GIS data managed by LINZ, such as topography, elevation, and aerial imagery, can be used to understand climate change's perception of environmental issues such as floods, storms, and sea level rise. In December 2015, LINZ provided critical data for scientists who traveled to Antarctica to help them monitor global climate change.
In 2016/17, LINZ supported the recovery of Kaikoura after the earthquake by providing GIS data such as aerial imagery with updated coordinates and 3D data of the ocean floor. Aerial imagery is the basic for repairing roads and other infrastructure and 3D data can ensure vessels of Australian defense force safe at sea. LINZ supports Environment Canterbury in 2016/17 by providing them with geographic information. The geographic information is helpful to the protection of Canterbury’s braided river network. LINZ also plans to map the data and make it available publicly. LINZ provided GIS data for the risks of flood in 2016/17. These data can be used to help find high risk areas for flooding, and can also help find the nearest defense point to save response time.
In 2017/18 and 2018/19, LINZ provides two main support involving GIS technology for climate change as well as earthquake events. One is providing GIS data about climate change information; another is to help agencies understand the data. Data is essential for decision making to make emergency plans and management plans to improve resilience and response capabilities. Marine geospatial information is one GIS data. LINZ leads the production of marine geospatial information. They try to provide mariners better data products in 2018/19.
This can help users gain resilience and users can better plan for natural events and prepare for climate change. Nautical chart is one GIS data. In 2019 LINZ began to produce nautical charts for Marlborough sounds. The work will finish in late 2020. Nautical charts can be used by Marlborough sounds to manage marine environments (Figure 25).
Supporting Maori: LINZ supports Maori by providing them with better property information in 2015/16. Maori land law is reforming. LINZ plays an important role to provide service for Maori by technology and infrastructure. GIS technology can help Maori monitor the environment, manage land resources and make smart decisions. In 2019/20, LINZ held a three day workshop and guided Maori to use GIS tools and data. This workshop helped Maori learn about cultural mapping and improve their GIS ability.
Weed control: LINZ developed software based on GIS technology from 2016/17 to 2017/18. This software can be used for the mapping of infestations and the control of pest trees. Information from the software can monitor the spread of pine trees and provide decision support for managers to arrange control activities.
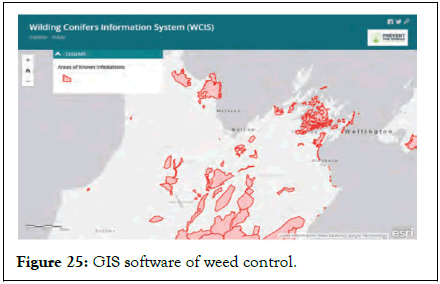
Figure 25: GIS software of weed control.
Land resources: Elevation data is a kind of GIS data. From 2015/16 to 2019/20, KINZ was using LiDAR which was advanced equipment usually used for GIS data capturing to collect elevation data. This technology can prove the accuracy of the national elevation data shown in Figure 26. Accurate elevation data is very important for the management of land resources and can help managers provide better decision support.
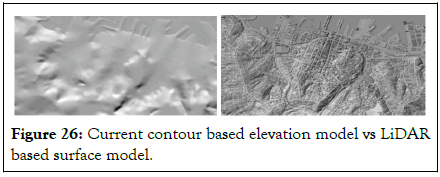
Figure 26: Current contour based elevation model vs. LiDAR based surface model.
GiC: Because the content of the GiC annual report is relatively short, usually only a dozen pages, there is no search method of keywords or maps used in this research. GiC's main work in the conservation field based on GIS technology included the development of planting application and weed control application, mapping of assets, capturing Maori oral history, protecting the native flora and Hapu sites, etc. In 2014 and 2015, GiC used GIS related technology to help more than 20 conservation groups, more than 25 conservation groups in 2015 and 2016 and 11 conservation groups in 2017 and 2018. In 2018 and 2019, GiC also helped iNaturalist and Trap. NZ to understand how GIS technology improved their databases. In 2019 and 2020, GiC used GIS technology based solutions to help predator free communities. The specific examples of GIS application from 2014/15 to 2019/20 are shown in Table 5.
| GIS technology related application examples | Year | |
|---|---|---|
| Plants and animals | Planting project. | 2014/15 |
| Little blue penguin monitoring project. | 2014/15, 2019/20 | |
| Endangered bird monitoring project. | 2015/16, 2017/18 | |
| Kiwi conservation project. | 2018/19 | |
| Ecosystem conservation project. | 2018/19 | |
| Pest control | Embedded maps. | 2014/15 |
| Back-yard trapping program. | 2017/18, 2018/19 | |
| Pest monitoring project. | 2018/19, 2019/20 | |
| Biosecurity conservation project. | 2018/19 | |
| Weed control | Weed control software. | 2014/15, 2015/16, 2017/18, 2019/20 |
| Moth plant control project. | 2018/19, 2019/20 | |
Table 5: GiC’s examples of GIS application for conservation from 2014/15 to 2019/20.
Plants and animals: GiC volunteers completed the development of the planting project based on ArcGIS Online in 2014/15 shown in Figure 27. The software of the project supports both Android and iOS devices. Users can download this software through google or apple stores. This software provides maps and data to allow users to complete planting related fieldwork. Based on the same technology, GiC volunteers also participated in the development of weed control software.
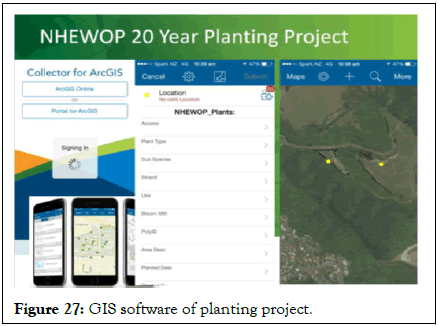
Figure 27: GIS software of planting project.
In 2014/15, GiC used GIS software PDFMaps as a solution for the little blue penguin monitoring project shown in Figure 28. This software is installed in the smart devices of GiC volunteers, and GiC uses it to track check routes. GiC also engaged in a little blue penguin conservation project in 2019/20. GIS technology is used to map nesting locations, monitor chicks status and predator trapping results. The data can be shared with the local councils. The councils can make informed decisions for sea wall upgrade and oil spill response based on the data.
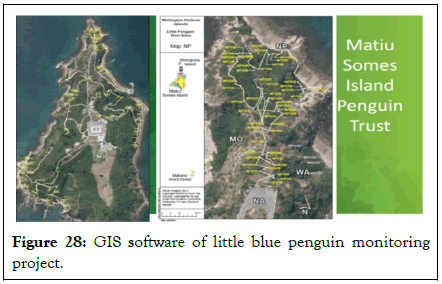
Figure 28: GIS software of little blue penguin monitoring project.
GiC completed the development of the endangered bird monitoring project based on ArcGIS Online from 2015/16 to 2016/17. The software of the project supports both Android and iOS devices. Users can download this software through Google or Apple stores. This software provides maps and data to allow users to complete planting related fieldwork.
In 2018/19, GiC participated in the kiwi conservation project of Wellington city. This project uses GIS technology to support planning, implementation, and monitoring. It mainly includes monitoring of pest control, population, and kiwi movement. GiC participated in the ecosystem conservation including native birds, endangered trees, and other flora. This project uses GIS technology to reduce the risk of failure of the old system. GIS technology can be used to collect the location data of species in the wild and can update attribute information. This system can also be used offline, while ensuring the efficient and effective data collection.
Pest control: In 2014/15, GiC also worked to develop embedded maps into some conservation websites. The embedded maps are helpful to show locations of conservation resources which are helpful to pest control. GiC also used ArcGIS Online for a back yard trapping program in 2017/18 shown in Figure 29. GIS technology is used to collect, store, and display the locations of more than 1,000 rats and mice caught by almost 800 households in an online map.
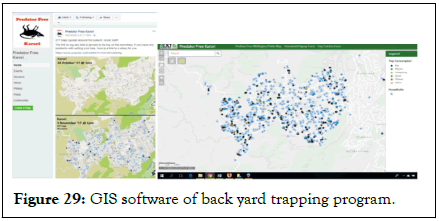
Figure 29: GIS software of back yard trapping program.
GiC engaged in a community conservation project from 2018/19 to 2019/20. GiC used GIS to create a reporting system for pest monitoring. ArcGIS Online was used to collect and store GIS data and build tailored maps and dashboards This GIS application helps trappers track the number of different species caught, and provides them with management and decision support.
In 2018/19, GiC participated in the biosecurity conservation project of Glenfern sanctuary. This project uses GIS technology to update, analyse and display the information of the trap. The people can click on the interactive map to sponsor a trap. The field workers update data after they check the trap through GIS technology. The real time information of the traps will be automatically created and displayed in the bespoke dashboard.
Weed control: GiC engaged the development of weed control software based on ArcGIS Online in 2014/15, 2015/16, 2017/18 and 2019/20. The software of the project supports both Android and iOS devices shown in Figure 30. Users can download this software through Google or Apple stores. This software provides maps and data to allow users to complete the fieldwork. In 2019/20, GiC engaged in an ecological restoration project. GiC used GIS technology to develop weed control applications including adopt a trap, trapping results, etc.
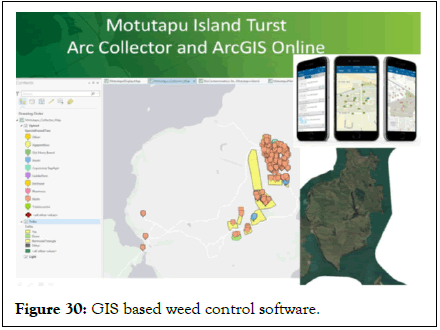
Figure 30: GIS based weed control software.
In 2018/19, GiC worked on a moth plant control project. GiC used GIS to change the data collection method of users and used ArcGIS Online to develop a web mapping application, which can visually track the user's movement. This GIS application changes the customer strategy for rechecking sites and improves their efficiency. In 2019/20, GiC develop a moth plant control app based on GIS technology. Users can use this app to collect and update moth plant data on their smartphones. Then the information can be displayed within a mapping application. This information includes the status of weeds and location of moth plant infestations and status.
Result of the deforestation analysis
The GIS data analysis uses GIS software to conduct deforestation analysis based on GIS data, land cover data, in the Auckland region between 2008 and 2018. From the two thematic maps deformation thematic map and reforestation thematic map of the analysis results, we can see that there are more red areas than green areas. Therefore, we can conclude that from 2008 to 2018, deformation is more than reforestation more places have changed from forest to non-forest areas. This result can be used as an example of GIS technology used in the conservation of New Zealand. In addition, this result verifies that New Zealand's publicly available GIS data can be used for forest protection research.
Data availability of GIS data analysis
This analysis result firstly benefits from the availability of the data. According to the research by Mwape, it is very troublesome for the author to obtain data when conducting GIS case studies because the Zambia government does not do a good job in providing data. Instead, New Zealand has done a good job in the openness of government data. I can download hundreds of megabytes of data for free just by registering an account through my email. There are no restrictions on data download. This is because New Zealand has passed an 'Open data' programme, which is a cross government department program, which proved that government data can be reused through collaboration between government departments and departments. The GIS data used in this study is a national land cover data set and belongs to the part of this program.
In addition, the national land cover data used in this research also contains relevant documents describing the data in detail, which increases the usability of the data. Because the ‘class code’ attribute in the data of this study tells specific category descriptions, as shown in Table 1, such as built-up area, urban parkland and sand or gravel. Based on this detailed information, more in depth research can be carried out. For example, when a forest region becomes a non-forest region, and what kind of specific it becomes, the detailed category information can help relevant researchers conduct more concrete research. Overall, this GIS data analysis verifies that New Zealand's publicly available GIS data can be applied for forest conservation in New Zealand.
This study has successively analyzed the annual reports of three organizations in New Zealand. From the analysis results, the three organizations DOC, LINZ, and GiC are all using GIS technology for conservation application. The use of GIS technology is helpful to their work in the conservation field.
According to the findings, the three organizations have different directions for GIS technology application. There are more GIS technologies applied by DOC in two aspects, the use of thematic maps and embedded mapping application. The use of thematic maps can usually help DOC show the spatial distribution of different protected species, the classification of species, and the spatial relationship between species and other resources. In addition to the features of the thematic map mentioned above, the embedded map application has the advantage of adding user interaction functions; such as users can zoom the map according to their needs, select the species they need to view, and so on. For LINZ, its application to GIS is mainly to provide GIS data to other organizations and help other organizations understand GIS data. LINZ is an organization with data production as its core responsibility. GiC's application of GIS technology mainly lies in the development of GIS software. As GiC is a non-profit organization, it mostly provides GIS services to other organizations in the form of volunteers (Supplementary Figure 1).
The analysis of the annual reports also shows that the situation of GIS application in each organization is different each year. Taking DOC as an example, the classification of conservation in the annual report will be clearer each year than in the previous year. The GIS technology used will be more in depth than in the previous year. For example, in the GIS application of estuary conservation, more GIS data were added in 2016/17 compared to 2015/16, and more analysis indicators expressed by GIS were added in 2017/18 compared to 2015/16. In addition, the types of conservation applications will increase year by year. For example, 2016/17 added the category of recreation compared to 2015/16. For example, 2017/18 has more sub items than 2016/17 in the recreation category.
In general, GIS technology, as an information technology related to geospatial location, meets the needs of three different organizations in the field of conservation, and provides technical support for their application in the field of conservation.
Tourism in New Zealand is thriving. This is inseparable from its conservation efforts. Conservation needs to ensure the protection of natural resources and historical resources to prevent them from being destroyed as well as guarantee their recreation function. The emergence of GIS technology can help managers achieve this goal. However, there is a lack of systematic research on the application of GIS technology in the conservation field of New Zealand.
This research demonstrates how GIS data can be effectively used for conservation in New Zealand. The study shows that the land cover data and area codes data downloaded free through the New Zealand government agency website can be opened processed, analyzed through GIS software to generate a thematic map of deformation for the protection of forest resources of New Zealand. In this research, the Auckland region was selected as the research area. The Auckland area was extracted from the original data, and the land cover classes table was used to figure out the type of class represented by each feature, and the 2008 and 2018 classes were compared automatically with GIS software. The analysis function of the GIS software can select all the deformation and reforestation areas in a short time and produce the thematic maps of deformation and reforestation.
This research also demonstrates how GIS technology is being used for conservation in three organizations of New Zealand which are DOC, LINZ and GiC. This research shows that all the three organizations are applying GIS technology to their conservation work. GIS technology has improved their ability to analyze and solve problems in their conservation work and can provide them decision making support. In this study, the recent five years annual reports of the three organizations were selected as the object of analysis. Through the analysis of each annual report, it can be found that the three organizations have applied different GIS technology on their conservation work. DOC uses GIS technology mainly in thematic maps and embedded map applications. LINZ realizes the application of GIS mainly by providing GIS data to other organizations. GiC mainly develops map software to realize the application of GIS.
Overall, this research shows that GIS technology is widely used in the field of conservation in New Zealand in the form of GIS data, thematic maps, and web mapping software, etc. The systematic research of GIS technology in the conservation field will have certain value for conservation work of New Zealand.
There are some limitations in this study. This research attempts to systematically understand the application of GIS technology in the conservation field in New Zealand. However, within a limited time, all relevant documents cannot be included. Conservation has the functions of protection and recreation, limited by the number of references and my own background, I focus on the application of protection, and there is less research on the aspect of recreation.
This article studies the application of deforestation and reforestation in the field of conservation from the perspective of GIS technology. For professional forestry researchers, this result may not be applicable as Forestry is an independent subject.
Based on the results of this research, the following recommendations are presented.
In terms of GIS data acquisition, in addition to traditional field surveying and image recognition, New Zealand has also begun to try to use PPGIS to reduce the difficulty and cost of data acquisition through public participation. In recent years, Munoz et al., Have proposed that using social software to obtain geotagged images can complement traditional data acquisition. New Zealand can learn from and try. According to the analysis of the annual report, the conservation applications of the three organizations in New Zealand are mainly domestic. The impact of climate change on indigenous species is a global issue, and these organizations can consider further international cooperation with other countries, such as Australia, a neighboring country mentioned in the literature, which also attaches great importance to conservation work.
Through the above recommendations, New Zealand can use GIS technology in the field of conservation more deeply, which will improve New Zealand's conservation capacity to a certain extent to meet various challenges that currently exist and may appear in the future.
The data involved in this study mainly include annual report data and GIS data. These two kinds of data are secondary data. When using the data obtained in the research, ethics should be considered, and no harm should be done to others. Using the annual report needs to respect copyright and indicate the source when quoting. Downloading map data needs to register an account and agree to abide by the website's privacy and ethics agreement. Ethics application was submitted to the ICL research ethics committee as a formal agreement for ethical consideration.
Future work should conduct in depth research on a specific area of conservation, such as forest conservation and native animal conservation. Due to the limitations of time, this research only conducts general research on all conservation applications. In the future, it is possible to conduct in-depth research on the application of GIS in a certain conservation direction by consulting professionals from conservation organizations. Future work can also be in the aspect of GIS data acquisition, studying how to extract GIS data using geo tagged pictures in social media software such as Flickr and Instagram in a specific area of New Zealand. Because the current public data acquisition methods in New Zealand still mainly rely on professional operations and government investment. The way of GIS acquiring data through social software will use data acquired by ordinary people, which will greatly reduce the cost of acquiring GIS data. This will be an interesting and meaningful research direction.
[Crossref] [Google Scholar] [PubMed]
[Crossref] [Google Scholar] [PubMed]
[Crossref] [Google Scholar] [PubMed]
Citation: Ali ZS, Chu H (2023) Application of Geographic Information System Technology for Conservation in New Zealand. Poult Fish Wildl Sci. 11:243.
Received: 05-Apr-2023, Manuscript No. PFW-23-23179; Editor assigned: 07-Apr-2023, Pre QC No. PFW-23-23179 (PQ); Reviewed: 21-Apr-2023, QC No. PFW-23-23179; Revised: 19-Jun-2023, Manuscript No. PFW-23-23179 (R); Published: 26-Jun-2023 , DOI: 10.35248/2375-446X.23.11.243
Copyright: © 2023 Ali ZS, et al. This is an open-access article distributed under the terms of the Creative Commons Attribution License, which permits unrestricted use, distribution, and reproduction in any medium, provided the original author and source are credited.