Journal of Chromatography & Separation Techniques
Open Access
ISSN: 2157-7064
ISSN: 2157-7064
Short Communication - (2020)Volume 11, Issue 1
A high performance liquid chromatographic method for estimation of Transitmycin (Tr) in human plasma was developed. The analyte was extracted using solid phase cartridges and the analysis of the eluent was carried out using Atlantis T3 column (150 cm × 4.6 mm ID) and photo diode array detector set at wavelength of 214 nm. The assay was specific for Tr and linear from 0.5 µg/mL to 20.0 µg/mL. The relative standard deviations for intra- and inter-day assays were less than 10%. The method yielded a recovery for Tr that ranged from 94% to 107% and could be used in toxicology and pharmacokinetic studies.
Transitmycin; HPLC Method; Plasma
Tuberculosis (TB) is the greatest infectious killer in India as well as in other developing countries and its high incidence worldwide is an important global health concern. Although several drugs are available for treatment of TB, resistance to existing anti-TB drugs necessitates the development of newer drug molecules and testing them in TB treatment. Thus, novel anti-TB drug development assumes significance.
Transitmycin (Tr) is a novel antibiotic isolated from the producer strain Streptomyces sp. MTCC 5597. It has a high potential to treat HIV and TB at the same time. The physico-chemical properties of this compound have been established [1]. This molecule was found to be active against Mycobacterium tuberculosis, Bacillus subtilis, Bacillus pumilus, Bacillus cereus, Staphylococcus aureus, and Acinetobacter baumanii. In addition, it was found to be active against drug resistant Mycobacterium tuberculosis [2]. The structure of Tr is given in Figure 1.
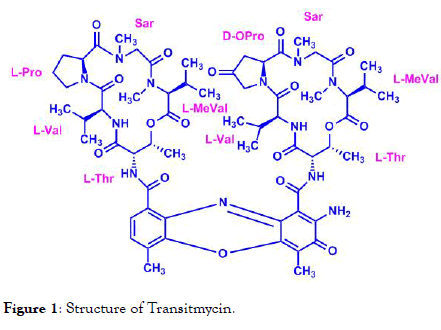
Figure 1. Structure of Transitmycin.
Chemical formula: C62H84N12O17
Exact Mass: 1268.60774
Molecular weight: 1269.40056 g/mol
Since Tr is a new compound, there is no existing literature on methods for estimation of Tr. Shreevalli et al. developed a method using auto-luminescent Mycobacterium tuberculosis to determine the potency of compounds [3]. We aimed to develop a HPLC-based bio-analytical method for the estimation of Tr in human plasma.
Pure Tr powder was obtained from an ongoing ICMR project on Tr; the crude extract from novel Streptomyces sp. was prepared at Periyar University, Salem and was subsequently purified upto >98% purity at the Indian Institute of Technology, Chennai. Acetonitrile (Merck, Germany), Methanol, Ammonium Acetate, Acetic Acid, DMSO and Ortho Phosphoric acid were purchased from Qualigens (India). Deionized water was processed through a water purification system (Siemens, Germany). Pooled human plasma was obtained from a Blood Bank, Chennai, India.
Chromatographic system
The HPLC system – Prominence - i(Shimadzu Corporation, Kyoto, Japan) consisted of two pumps (LC-2030-3D), photo diode array detector (SPD-20AV) with built-in auto sampler and system controller. Lab solution software was used for data collection and acquisition. The analytical column used was AtlantisT3 (15 cm × 4.6 mm ID, 3.0 μm particle size) from Waters, USA.
An isocratic mobile phase was a mixture of 10 mM ammonium acetate solution and acetonitrile in the ratio of 20:80 (v/v). The solvents were degassed separately using a Millipore vacuum pump prior to preparation of the mobile phase. The run time of the chromatogram was 10 minutes at a flow rate of 0.8 mL/min at 40 °C, with the PDA detector set at a wavelength of 214 nm. Unknown Tr concentrations were derived from linear regression analysis vs concentration curve. Linearity of the calibration curve was verified using estimates of correlation coefficient (r).
Preparation of standard solution
A stock standard solution of Tr (1 mg/mL) was prepared in DMSO. Working standard solutions of Tr ranging from 0.5 to 20 μg/mL concentrations were prepared using pooled plasma.
Sample preparation
To 200 μL of calibration standards and test samples, 200 μL of 4% Orthophosphoric acid in water was added and the contents were vortexed vigorously and centrifuged at 10,000 rpm for 10 minutes. The analyte was extracted using solid phase extraction cartridges MCX 30 mg/1CC. The eluted solution was evaporated to dryness under nitrogen. The dried residue was reconstituted in 100 microliters of the mobile phase, mixed and centrifuged. Fifty microliters of the supernatant was loaded into the HPLC column maintained at 10°C.
Precision
The precision of the analytical method was determined by processing plasma samples containing different concentrations of Tr in duplicate on three consecutive days.
Accuracy and linearity
A set of Tr standard concentrations ranging from 0.5 to 20.0 μg/mL were used to evaluate the accuracy and linearity of the calibration curve. The within-day and between-day variations were estimated by testing each standard Tr concentration in duplicate for six consecutive days.
Specificity
The specificity of the analytical method was assessed by analyzing blank plasma samples for interference from endogenous compounds. Interference from certain anti-TB drugs (rifampicin, isoniazid, pyrazinamide, ethambutol, ethionamide, levofloxacin, ofloxacin, moxifloxacin, rifabutin, rifapentine), anti-retroviral drugs (nevirapine, efavirenz, zidovudine, didanosine, stavudine, didanosine, lamivudine, ritonavir, tenofovir) and anti-diabetic drugs (metformin and sulphonyl ureas) at a concentration of 10 μg/mL was tested.
Recovery
Pooled human plasma not containing Tr was used to prepare Tr concentrations of 0.75, 3.75, 10.5 and 15 μg/mL. These samples were spiked with known concentrations of Tr. Percent recovery of Tr from plasma samples was calculated by dividing the difference in Tr concentrations by the added concentration. Recovery experiments were carried out on three different occasions.
Limits of detection (LOD) and quantitation (LOQ)
The LOD and LOQ of the method were determined mathematically from the standard curve equations. The LOD and LOQ were calculated using the formulae 3.3 × α/S and 10.0 × α/S respectively, α being the standard deviation of Yaxis intercepts and S being the slope of the calibration curve.
When the above described chromatographic conditions were applied, we observed Tr to get well separated and viewed as a discrete peak of Tr calibration standards 20.0 and 0.5 μg/mL at the retention time of 4.7 minutes. Blank plasma sample did not give any peak at the retention time of Tr (Figure 2a). Representative chromatograms of lowest (0.5 μg/mL) and highest (20.0 μg/mL) of Tr are shown in Figures 2b and 2c respectively. Specificity experiments in the presence of certain drugs used in the treatment of TB, HIV and diabetes mellitus did not interfere in the analytical method of Tr.
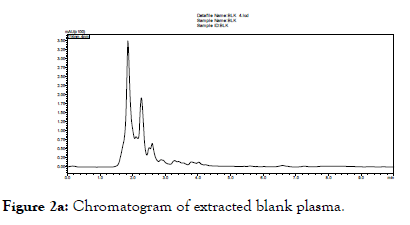
Figure 2a. Chromatogram of extracted blank plasma.
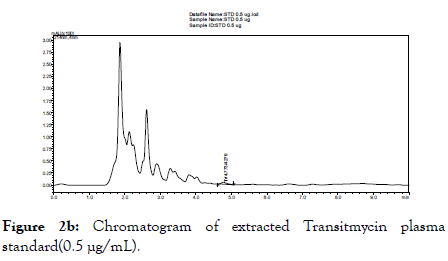
Figure 2b. Chromatogram of extracted Transitmycin plasma standard(0.5 μg/mL).
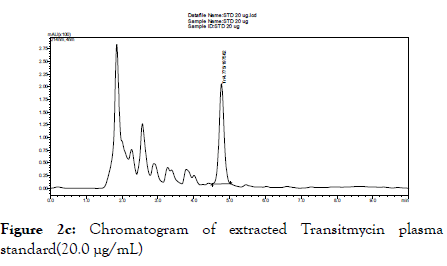
Figure 2c. Chromatogram of extracted Transitmycin plasma standard(20.0 μg/mL)
In the method described here, we tested the linearity of Tr concentrations ranging from 0.5 to 20.0 μg/mL. Calibration curve parameters of Tr run on six consecutive days for concentrations ranging from 0.5 to 20.0 μg/mL showed a linear relationship (Figure 3). The mean values of correlation coefficients (R), coefficient of determinants (R2), slope and intercept were 0.998, 0.996, 10075 and 1931.4 respectively. The linearity and precision of the different Tr standard concentrations used for constructing calibration curves for plasma Tr are shown in Table 1. The within- and between-day relative standard deviation of Tr standard concentrations 0.5-20.0 μg/mL ranged from 0.6% to 6.0% and 2.1% to 4.2% respectively. The accuracy of plasma Tr concentrations ranged from 96 to 101.5%.
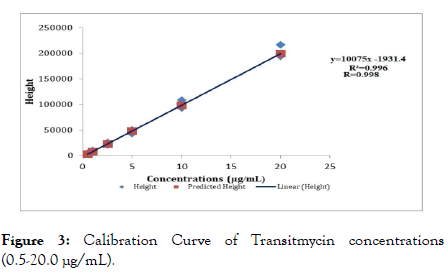
Figure 3. Calibration Curve of Transitmycin concentrations (0.5-20.0 μg/mL).
| Standard (µg/mL) |
Mean peak height ± SD (%RSD) | |
|---|---|---|
| Within day (n=6) | Between day (n=6) | |
| 20.0 | 195768 ± 2399 (0.6) | 200581 ± 9303 (2.1) |
| 10.0 | 93752 ± 3060 (1.6) | 97927 ± 6511 (3.0) |
| 5.0 | 45665 ± 1624 (1.8) | 46098 ± 3068 (3.0) |
| 2.5 | 21416 ± 1106 (2.6) | 22595 ± 2129 (4.2) |
| 1.0 | 9113 ± 1096 (6.0) | 9639 ± 755 (3.5) |
| 0.5 | 4365 ± 251 (2.9) | 4507 ± 226 (2.2) |
Table 1: Linearity and Reproducibility of plasma Transitmycin standards.
The precision of the analytical method was also determined by analyzing three plasma samples containing different concentrations of Tr (Table 2). The RSD from these experiments were 102%, 98% and 100% respectively. The LOD and LOQ of the method were calculated as 0.25 and 0.5 μg/mL respectively. The percent recovery of Tr ranged from 94% to 107% from experiments conducted on three occasions (Table 3). The mean plasma Tr concentrations measured on days 1 and 15, in two samples were 20.77, 0.46 and 20.52, 0.48 μg/mL respectively.
| Actual concentration (µg/mL) | Found concentration (µg/mL) mean ± SD | %RSD |
|---|---|---|
| 20.0 | 20.3 ± 0.4 | 102 |
| 5.0 | 4.9 ± 0.2 | 98 |
| 0.5 | 0.5 ± 0 | 100 |
Table 2: Precision of plasma Transitmycin assay.
| Base (µg/mL) | Added concentration (µg/mL) | Actual concentration (µg/mL) | Obtained concentration (µg/mL) | Recovery (%) |
|---|---|---|---|---|
| 20.0 | 10.0 | 15 | 16.04 | 107 |
| 20.0 | 1.0 | 10.5 | 9.85 | 94 |
| 5.0 | 2.5 | 3.75 | 3.83 | 102 |
| 0.5 | 1.0 | 0.75 | 0.71 | 95 |
Table 3: Recovery of Transitmycin from plasma.
We describe a simple, sensitive and specific high performance liquid chromatographic method for estimation of Tr in plasma. Method validation was carried out in accordance with FDA guidelines, and the results were within the acceptable limits. The calibration curve of Tr for concentrations ranging from 0.5-20.0 μg/mL was observed to be linear, which spans the concentrations of clinical relevance. The LOQ was calculated as 0.5 μg/mL which denotes that the method described here is highly sensitive and significant in patients with TB or HIV during treatment with Tr. Furthermore, the method yielded satisfactory recovery of the desired analyte, and at the same time eliminated interfering materials from plasma.
Since Tr possesses potent anti-mycobacterial and anti-retroviral activity, it is likely that the drug would be used in the treatment of TB and HIV along with other medications. Hence it is essential to rule out interference of other anti-TB and antiretroviral drugs in the analytical method of Tr, and establish the specificity of the method. We observed that no plasma endogenous substances or anti-TB drugs (rifampicin, isoniazid, pyrazinamide, ethambutol, ethionamide, levofloxacin, ofloxacin, moxifloxacin, rifabutin, rifapentine), anti-retroviral drugs (nevirapine, efavirenz, zidovudine, didanosine, stavudine, didanosine, lamivudine, ritonavir, tenofovir) and anti-diabetic drugs (metformin and sulphonyl ureas) interfered in the method.
Stability experiments showed no degradation (<10%) of Tr occurred in human plasma when stored at -20°C up to a period of 15 days.
In summary, we report a simple HPLC method for estimation of Tr in plasma, with a sensitivity of 0.5 μg/mL which is sufficient for toxicology and pharmacokinetic studies. This is probably the first report on describing an analytical method for estimation of Tr in human plasma. The method is reproducible and specific for the determination of Tr in human plasma, yielding satisfactory recovery from human plasma. This method could be used in toxicology and pharmacokinetic studies.
Transitmycin pure compound with >98% purity was supplied for method development as part of the ongoing ICMR research project titled “ Bioprocess development and Preclinical evaluation of novel anti TB antibiotic, Transitmycin isolated from marine Streptomyces sp. MTCC 5597 ” . The technical assistance rendered by Mr. A. Vijayakumar and the secretarial assistance rendered by Mr. S. Sasikumar is acknowledged.
None
Citation: Hemanth Kumar AK, Jagdeesh B, Sudha V (2020) A Simple and Sensitive High Performance Liquid Chromatographic Method for Estimation of Transitmycin in Plasma. J Chromatogr Sep Tech. 11:425. DOI: 10.35248/2157-7064.20.11.425
Received: 23-Jan-2020 Accepted: 08-Feb-2020 Published: 15-Feb-2020 , DOI: 10.35248/2157-7064.20.11.425
Copyright: © 2020 Hemanth Kumar AK, et al. This is an open-access article distributed under the terms of the Creative Commons Attribution License, which permits unrestricted use, distribution, and reproduction in any medium, provided the original author and source are credited.