Journal of Chromatography & Separation Techniques
Open Access
ISSN: 2157-7064
ISSN: 2157-7064
Research Article - (2019) Volume 10, Issue 2
Thiopurine drugs, including Azathioprine and 6-Mercaptopurine (6-MP), are used in clinical practice for more than 50 years. Their bioavailability is strongly patient-dependent. Therefore, closely monitoring of the plasma levels during therapy is recommended. Here, we present a quick and simple High Performance Liquid Chromatography (HPLC) based method for the quantification of 6-MP in human plasma. Samples were deproteinized with methanol to obtain protein concentrations below 2 mg/dL. The method offers a recovery higher than 90% and is precise and linear with a high correlation coefficient and a level of detection.
Keywords: 6-Mercaptopurine; HPLC; Immunosuppressor
6-Mercaptopurine was developed in the 1950s as an anticancer agent [1]. Some years later, it could be shown that 6-MP has also an immunosuppressive effect [2]. From the early 1950s to the early 1980s, Azathioprine, the prodrug of 6-MP, was one of the main immunosuppressive drugs in renal transplantation. Due to low costs, Azathioprine and 6-MP are still used in the treatment of acute lymphoblastic leukemia and inflammatory bowel diseases such as Crohn's disease or Ulcerative Colitis.
Orally applied Azathioprine is non-enzymatically converted to 6-MP, which is able to pass the cell membrane. There are three intracellular pathways which compete with each other depending on the availability of various activating and inactivating enzymes or cofactors. One of these pathways converts 6-MP to metabolic active 6-thioguanine nucleotides which are incorporated into DNA and RNA instead of adenine and guanine leading to suppressed cell proliferation, mainly of lymphocytes. The other two pathways end up building inactive metabolites [3,4] (Figure 1).

Figure 1: Metabolic pathway for Azathioprine: The initial step in 6-mercaptopurine (6-MP) nucleotide metabolite formation is catalysed by hypoxanthine phosphoribosyltransferase (HPRT). Further metabolism of mercaptopurine nucleotide results in the eventual formation of mercaptopurine nucleotide. Oxidation catalysed by xanthine oxidase, and methylation catalysed by thiopurine methyltransferas, compete with hioguanosine triphosphate and thiodeoxyguanosine triphosphate formation. Thioguanosine metabolites of 6-MP act as purine antagonists and inhibit DNA, RNA, and protein synthesis, inducing cytotoxicity and immunosuppression.
Since the amounts of enzymes and cofactors which play a role in the metabolism of 6-MP show a wide interindividual variation, the response to Azathioprine treatment is unpredictable [4,5]. In order to maintain a constant serum level of 6-MP, analytical monitoring of the drug could be of great advantage. Currently, there are no test kits or recommended reference methods for the clinical monitoring of 6-MP commercially available. Therefore, numerous HPLC methods for the determination of 6-MP in human erythrocytes, plasma and pharmaceutical formulations have been published. Most of these procedures combine the detection of 6-MP with its metabolites. Other methods show complicated and time-consuming sample preparation procedures, such as HPLC-tandem mass spectroscopy and extraction with chloroform combined with the use of special and expensive equipment and software [6-8].
The objectives of this study were to create a quick and simple HPLC method with good recovery, selectivity and accuracy for the quantification of 6-MP in human plasma well as an optimized sample preparation which minimizes the protein content in the sample in order to gain a long column life-time.
Instrumentation
The HPLC device was a Shimadzu prominence system (Kyoto, Japan) consisting of a DGU-20A-5R degassing unit, a LC-20AD pump unit, a SIL-20AC-HT autosampler, a CTO-20AC column oven and an SPD-20AV UV/VIS detector. For data processing, LabSolutions software version 5.71 was used. Short thread clear 1.5 mL glass HPLC vials with ultra clean seal 9 mm PP caps with center hole were purchased from Fisher Scientific (Hampton, New Hampshire, USA). The analytical column was a Nukleosil 100-5C18, 4.6 × 150 mm purchased from Macherey-Nagel (Duren, Germany) which was combined with a 4.6 × 5 mm Onyx Monolithic C18 guard column (Phenomenex, Torrance, California, USA) to reduce contaminations.
Chemicals and reagents
6-MP and 5-sulfosalicylic acid were obtained from Sigma Aldrich (St. Louis, Missouri, USA), HPLC grade methanol was purchased from Carl Roth (Karlsruhe, Germany) and distilled water was obtained from Fresenius Kabi (Graz, Austria).
For each analytical day a 6-MP 200 μg/mL stock solution was prepared in methanol.
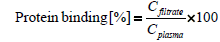
Protein binding of 6-mercaptopurine
Since only the amount of freely available and unbound fraction is chromatographically detectable, the protein binding of 6-mercaptopurine was determined. For this purpose, plasma was spiked with 6-mercaptopurine, incubated for 30 minutes and centrifuged for 20 minutes at 15,000 g through a centrifugal concentrator with a molecular cut off of 30 kDa (Spin-X UF 500 μL, Corning, New York, USA). The levels of 6-MP were determined in spiked plasma and in the filtrate. The percentage of protein bound fraction was calculated using the formula:
 (1)
(1)
Cplasma is the determined concentration of 6-MP and Cfiltrate is the measured drug level in filtrate.
6-MP extraction from plasma samples
In order to dissolve the protein-bound part of 6-MP on the one hand and not to load the column with proteins on the other hand to prolong the column’s live time, protein precipitation was performed for all plasma samples. Although many possibilities for the extraction of drugs from human plasma have been described in the literature [9], only methanol and 5-sulfosalicylic acid, two commonly used reagents for protein precipitation [10], were compared regarding their deproteinization efficiency. Methanol can be mixed with water in any ratio and its low dielectric constant reduces the solvation power of the aqueous solution for dissolved proteins. At temperatures above 10°C a considerable denaturation of the proteins can occur; therefore, precipitation should be carried out at a temperature below 0°C [11]. To extract 6-MP from human plasma, four different approaches were conducted (Table 1).
Two different solutions with 0.5 g/mL 5-sulfosalicylic acid solutions in water and 50% methanol were prepared. Precipitation was carried out by mixing 100 μL of the prepared solution with 1 mL plasma, incubated at 4°C for 20 minutes and centrifuged at 15,000 g.
With methanol two different extraction procedures were tested. According to the recommended extraction method by Naik et al. [12], 100 μL plasma were mixed with 1 mL methanol to water (1:1), vortexed for 5 minutes and centrifuged at 3000 g for 15 minutes at room temperature. In comparison, precipitation at low temperature was tested where 100 μL plasma were mixed with 500 μL iced methanol (-20°C), vortexed and incubated for 20 minutes at -80°C followed by centrifugation at 15,000 g for 5 minutes (Table 1). Protein quantification of the supernatant of all precipitated plasma samples was carried out with a Hitachi cobas c311 automated analyzer with the corresponding test kit, both purchased from Roche (Basel, Switzerland). For the HPLC method described below, protein precipitation was performed with iced methanol in the ratio plasma to methanol 1:5, as this sample preparation yielded the lowest protein concentration in the supernatant (Table 2).
| Precipitation solution | Ratio [v/v] precipitation solution: Plasma | Incubation temperature |
|---|---|---|
| 5-Sulfosalicylic acid in water | 1:10 | 4°C |
| 5-Sulfosalicylic acid in water: methanol 1:1 | 1:10 | 4°C |
| Methanol: water 1:1 | 10:1 | 20°C |
| Iced methanol | 5:1 | -80°C |
Table 1: Four different protein precipitation protocols were compared regarding protein content in the supernatant.
| Precipitation solution | Total protein concentration [mg/dL] |
|---|---|
| 5-Sulfosalicylic acid in water | 101.5 |
| 5-Sulfosalicylic acid in water: methanol 1:1 | 83.8 |
| Methanol: water 1:1 | 390.9 |
| Iced methanol | 1.6 |
Table 2: Comparison of the protein concentration in the supernatant for different protein precipitation methods for 6-MP spiked plasma.
Chromatographic conditions
Methanol and water were used as mobile phase. The water content in the solvent is necessary for the retention of organic substances on a reversed phase column. The methanol content controls the retention time and ensures good transparency in the UV/VIS detector [12]. Using an isocratic mixing ratio of the mobile phase, it was not possible to separate the 6-MP peak from other plasma compounds. Therefore, the mobile phase gradient was empirically optimized to get a clear separation. The column temperature was maintained at 25°C during chromatography. The sample injection volume was 20 μL, and the run time per sample was 5 minutes using a flow rate of 0.8 mL/min. The composition of the mobile phase started with a methanol to water ratio of 9:1 and changed following a linear gradient with the ratio 7:3 after 1.7 minutes. The eluted 6-MP peaks were detected via UV/VIS detector at 325 nm [13]. Peak area was used to determine 6-MP concentrations in plasma samples.
Preparation of calibration curves
A 200 μg/mL 6-MP standard solution was prepared and diluted in mobile phase (water to methanol 1:9) to obtain 6-MP concentrations of 1000, 750, 500, 250, 100 and 0 ng/mL. Before the standards were injected into the HPLC system, they were diluted with a ratio (plasma to methanol) of 1:5 to compensate the dilution of the plasma samples during the protein precipitation step. For the preparation of the calibration curve in human plasma, plasma samples were spiked with 6-MP stock solution to obtain final concentrations of 1000, 750, 500, 250, 100 and 0 ng/mL. For this procedure, the 6-MP stock solution (200 μg/mL in methanol) was diluted with physiological sodium chloride solution to get concentrations of 10, 7.5, 5.0, 2.5, 1 and 0 μg/mL. Each solution was then diluted 1:10 with plasma to obtain the desired standard concentrations. This procedure ensured that each standard contained the same concentration of plasma, which enabled a more precise and reproducible peak integration. Protein precipitation was then performed as described above and samples were injected into the HPLC system after centrifugation. For both calibration curves, linear plots of peak area against 6-MP concentration were created.
Statistical analysis
All statistical calculations were carried out in Microsoft Excel 2016 for Windows.
Validation parameters
Recovery: Recovery was determined by comparison of the 6-MP peak areas spiked in mobile phase with human plasma. Additionally, four quality control (QC) samples were prepared at the concentrations of 800, 400, 200 and 100 ng/mL 6-MP in human plasma. All samples were measured five times daily (intraday) on four consecutive days (interday).
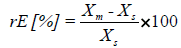
Accuracy: Accuracy was determined by comparing the measured concentrations in plasma with the spiked concentration. It was expressed as mean relative error in percent which was calculated with the formula:
 (2)
(2)
rE is the relative error, Xm is the measured concentration and Xs is the spiked concentration. All samples were measured five times a day on four consecutive days.
Precision: The precision was evaluated by performing replicate analyses of QC and standard samples in human plasma. The precision was calculated as the relative standard deviation (RSD%) of interday and intraday measurements. For intraday precision, all measurements were repeated five times on the same day. For interday precision, all measurements were replicated on 4 consecutive days. Then RSD% values were calculated for intraday and interday measurements.
Stability: The stability of the plasma samples containing 800, 400, 200, 100 ng/mL 6-MP were assessed in triplicates at 4°C, -20°C, -80°C for 28 days.
Freeze-thaw stability of these samples was evaluated in triplicates after three complete freeze-thaw cycles from -20°C to room temperature and from -80°C to room temperature on successive days.
Level of detection and level of quantification: According to the ICH guidelines, the Level of Detection (LOD) and the Level of Quantification (LOQ) were assessed based on the Standard Deviation (SD) of the nominal concentrations of the calibration curve, whereas LOD=3 × SD and LOQ=10 × SD [13].
Protein binding of 6-mercaptopurine
Binding studies of 6-MP to human serum albumin show that between 20% and 90% of the drug is irreversibly bound to albumin [14]. In our current study the determined value of bound 6-MP to plasma proteins was 33.8 ± 6.3%. This fact shows the importance of a good extraction procedure of 6-MP in human plasma (Table 2).
6-MP extraction from plasma samples
Plasma samples which were precipitated 1:10 with methanol to water (1:1) and then centrifuged for 15 minutes at room temperature showed the highest protein concentration left in the supernatant. Both approaches with 5-sulfosalicylic acid showed a high protein concentration left in the supernatant as well. Furthermore, sulfosalicylic acid caused an additional peak which overlaid the 6-MP peak. Plasma which was precipitated with iced methanol had the lowest protein concentration in the supernatant and did not show an interfering peak in the chromatogram (Table 2 and Figure 2). This extraction method is also recommended in the literature for the sample preparation of human plasma samples for other drugs [15].

Figure 2: Chromatogram of the standard curve in mobile phase R2=0.9995, y=0.0237x-5.4725 (solid line) and standard curve in plasma R2=0.9938, y=0.0262x-26.39 (dotted line).
Plasma proteins were most efficiently removed by methanol precipitation at a ratio of 1:5 v/v for plasma to methanol. Furthermore, since methanol is also part of the mobile phase, there are no disturbing peaks in comparison to sulfosalicylic acid. Therefore, methanol precipitation not only prolongs the lifetime of the HPLC column, but also simplifies data assessment. The following procedure was chosen for the development of this HPLC method: 100 μL plasma samples were precipitated with 500 μL iced methanol, vortexed and frozen at -80°C for 20 minutes. After centrifugation at 15,000 g for 5 minutes, 20 μL of the supernatant were injected. The 6-MP peak was detected at a retention time of 2.25 ± 0.3 minutes (Figure 2).
Calibration curves (linearity)
The calibration curves for quantification of 6-MP in mobile phase as well as in human plasma were developed based on six different concentrations (0, 100, 250, 500, 750 and 1000 ng/mL) using a linear trend line with the formula:
y = k× x + d
which is depicted as peak area (x-axis) versus 6-MP concentration (y-axis) in ng/mL. Both curves show an excellent linearity with a least square fit (R²) of > 0.99 (Figure 3).

Figure 3: Typical chromatogram for 6-MP (1000 ng/ml): (A) in mobile phase, (B) in spiked human plasma.
Statistical parameters
For the validation of the method, the statistic parameters recovery, accuracy and precision were determined within an analysis day (intraday) and day by day (interday).
Recovery
The concentrations of 6-MP were calculated with the standard curve for mobile phase. The interday recovery was 90%, 100%, 102%, 114% and 98% with a concentration of 1000 ng/mL, 750 ng/mL, 500 ng/mL, 250 ng/mL and 100 ng/mL, respectively (Table 3). Deviation was less than 20% for all concentrations [16]. These findings confirm the efficient protein precipitation for the plasma samples.
Accuracy
In order to compare the accuracy of the measurements, the mean relative error (MRE) was determined. The average MRE for all nominal 6-MP concentrations shown in Table 3 was -2.0%, while the largest MRE was 17.5%.
| Nominal conc. [ng/mL] | Interday (n=4) | Intraday (n=5) | ||||||
|---|---|---|---|---|---|---|---|---|
| Precision | Recovery | Accuracy | Precision | Recovery | Accuracy | |||
| Mean [ng/mL] | RSD [%] | [%] | MRE [%] | Mean [ng/mL] | RSD [%] | [%] | MRE [%] | |
| 1000 (STD) | 900.9 | 11.9 | 90.1 | 5.5 | 900.9 | 8.2 | 90.1 | 7.9 |
| 750 (STD) | 748.3 | 13.9 | 99.8 | 2.2 | 748.3 | 7.6 | 99.8 | 1.3 |
| 500 (STD) | 509.1 | 8.4 | 101.6 | -3.6 | 512.0 | 5.7 | 102.4 | -3.5 |
| 250 (STD) | 285.2 | 7.1 | 114.4 | -11.6 | 293.9 | 4.7 | 117.6 | -13.0 |
| 100 (STD) | 98.1 | 22.2 | 98.1 | -5.5 | 88.9 | 19.0 | 88.9 | -7.8 |
| 800 (QC) | 725.4 | 15.5 | 90.7 | 1.3 | 725.4 | 5.3 | 90.7 | 4.2 |
| 400 (QC) | 372.3 | 6.2 | 93.1 | -7.2 | 372.3 | 4.0 | 93.1 | -7.2 |
| 200 (QC) | 245.9 | 11.1 | 123.0 | -13.8 | 245.9 | 3.9 | 123.0 | -13.8 |
| 100 (QC) | 104.8 | 20.7 | 104.8 | 17.5 | 90.1 | 8.6 | 90.7 | 10.3 |
RSD [%]: Relative Standard Deviation (=Coefficient of variation), MRE [%]: Mean Relative Error, STD: Standard Samples, QC: Quality Control Samples.
Table 3: Summary of the statistic parameters for the analysis of 6-MP.
Precision
Standard plasma samples showed a mean interday concentration of 901 ± 107 ng/mL, 748 ± 127 ng/mL, 509 ± 42 ng/mL, 285 ± 25 ng/mL and 98 ± 42 ng/mL and a mean intraday concentration of 901 ± 74 ng/ mL, 748 ± 57 ng/mL, 512 ± 29 ng/mL, 294 ± 19 ng/mL and 89 ± 22 ng/ mL. Mean standard deviation was less than 20% in all plasma samples except samples containing 100 ng/mL when measured on different days (Table 3).
Quality control samples had a mean interday concentration of 725 ± 136 ng/mL, 372 ± 132 ng/mL, 246 ± 26 ng/mL and 105 ± 96 ng/mL and a mean intraday concentration of 725 ± 50 ng/mL, 372 ± 17 ng/mL, 246 ± 9 ng/mL and 90 ± 28 ng/mL. Here also the samples containing 100 ng/mL measured on different days showed a higher mean standard deviation than 20%, all others were within the acceptable 20% [16]. All concentrations were within the range of acceptable deviation, only concentrations of 100 ng/mL could not be quantified satisfyingly (RSD% >20%).
Stability
Freeze thaw cycles showed a relative standard deviation of less than 5% with no difference if the samples were frozen at -20 or -80°C for plasma samples ranging from 200 to 800 ng/mL 6-MP. Higher RSD% was only observed in plasma samples with 100 ng/mL (Table 4). The stability test showed that plasma samples with low 6-MP concentrations are not able to be stored for 28 days. In addition, it could be shown that recovery at a storage temperature of -80°C is better than at -20°C. The plasma samples should not be stored in the refrigerator at 4°C (Table 4). The results of the stability tests indicate that plasma samples should be extracted and analyzed immediately after sampling.
| Variables | RSD% | |||
|---|---|---|---|---|
| Plasma samples | 4°C | - 20°C | - 80°C | |
| Freeze thaw cycles (n=3) | QC 100 ng/mL | - | 26 | 50 |
| QC 200 ng/mL | - | 5 | 4 | |
| QC 400 ng/mL | - | 2 | 2 | |
| QC 800 ng/mL | - | 3 | 5 | |
| Variables | Recovery % | |||
| Plasma samples | 4°C | - 20°C | - 80°C | |
| 28-day stability (n=3) | QC 100 ng/mL | 3972 | 296 | 176 |
| QC 200 ng/mL | 818 | 181 | 153 | |
| QC 400 ng/mL | 174 | 129 | 67 | |
| QC 800 ng/mL | 112 | 107 | 108 | |
Table 4: RSD values in % of QC samples after 3 freeze thaw cycles and recovery in % of QC samples after 28-day storage at different temperatures.
Level of detection and level of quantification
Although the detection limit (LOD) of the method presented here is below 100 ng/mL, we consider the method to be valid for the quantification (LOQ) of 6-MP for concentrations of at least 100-200 ng/ mL. For the quantification of lower 6-MP serum levels, more sensitive methods based on mass spectroscopy [17] should be considered.
Although the reversed phase HPLC based method developed within this study is not as sensitive as LC-MS based methods, it is adequate for the determination of 6-MP serum levels in human blood, especially since the sample preparation is cheap and easy to handle, and the short runtime of 5 minutes leads to quick results. However, for a better estimation of the in vivo 6-MP therapy success, the active metabolite 6-thioguanine in erythrocytes can be performed additionally.