Journal of Thermodynamics & Catalysis
Open Access
ISSN: 2157-7544
ISSN: 2157-7544
Research Article - (2023)Volume 14, Issue 3
Water Hyacinth Leaf Protein Concentrate/Graphene Oxide/Chitosan/Polyvinyl Alcohol (WHLPC/GO/CS/PVA) composite was synthesized for the removal of Cr (VI) from wastewater. About 80% of the prepared composite material constitutes WHLPC which is extracted from water hyacinth plant leaf. The prepared material was characterized by FT-IR and XRD. The process variables such as pH, contact time, dosage, initial Cr (VI) concentration and temperature were optimized using a batch mode experiment. Kinetic studies were conducted using pseudo-first-order and pseudo-second-order models and it was observed that the chemosorptive pseudo-second-order model described the adsorption system in a better way, with a high value of R2. The highest adsorption capacity of 171.22 mg/g was achieved at pH 1.0 and equilibrium was achieved within 330 min. Langmuir and Freundlich isotherm models were analyzed using non linear fitting. It was found that the Freundlich model gives the best fit indicating multilayer adsorption of Cr (VI) on the WHLPC/GO/CS/PVA. The reuse efficiency of the synthesized material was also found to be greater than 65% for five consecutive cycles. Thermodynamic studies were conducted and results revealed that the adsorption was natural and endothermic.
Adsorbent; Water hyacinth; Hexavalent chromium; Hexavalent chromium; Thermodynamics; Kinetics
Pollution caused by heavy metals discharged into water bodies from automotive, chemical, pharmaceutical, metallurgical, agro food and mining industries are continuing to be a serious risk to human being healthiness and the environment. Particularly, chromium which is the 7th most abundant element existing in the form of Cr (III) and Cr (VI) is found in wastewater discharged from metal smelting, electroplating, tanning, metallurgy and dyestuff industries. Cr (VI) compounds are more noxious than Cr (III) because of their high water solubility, mobility, penetrability, oxidation and carcinogenesis. As the US environmental protection agency report, the recommended concentrations of water soluble and insoluble Cr (VI) compounds should not exceed 0.05 mg/L and 0.01 mg/L respectively [1].
Many techniques such as electrochemical method, phytoremediation, chemical reduction and precipitation, membrane technology, photocatalytic reduction, ion exchange and adsorption have been studied for the removal of Cr (VI). Among these methods, adsorption is a better method because of the ease of operation, low technological equipment and availability of all kinds of adsorbents. Activated carbon, agricultural wastes and synthetic and native polymers were commonly used as low cost adsorbents to remove Cr (VI) [2].
Recently, biomaterials attracted increasing attention due to their low cost, large abundance and renewable and scalable properties. Diverse adsorbents such as magnetic lignin composite, chitosan/ graphene oxide, chitosan modification of magnetic biochar produced from Eichhornia crassipes, graphene oxide coated water hyacinth biochar composite, dried water hyacinth root, nano chitosan/polyvinyl alcohol/carboxymethyl starch ternary blend, chitosan/reduced graphene/montmorillonite porous composite hydrogel, biochar of water hyacinth, chitosan hydrogel, lignosulfonate modified graphene hydrogel, lignin/graphene oxide composite, polyethyleneimine cross linked graphene oxide, graphene oxide/chitosan composite, Graphene Oxide/Chitosan (GO/CS) composite, phosphoric acid activated biochar and nitrogen containing modified biochar employing eucalyptus, were used for the removal of Cr (VI). Particularly, the water hyacinth based adsorbents do have an additional advantage since they will contribute to controlling this highly invasive weed and also convert it into a useful resource. Water hyacinth has been used as a precursor to making activated carbon, protein, bio electrodes and hydrogels for different applications including adsorbent materials for the removal of Cr (VI). However, the obtained maximum adsorption capacity of unmodified water hyacinth products is low and still needs a simple and cheap method to modify the water hyacinth and enhance the adsorption capacity. Therefore, within this work, we report the synthesis and application of a water hyacinth based composite for enhancing the adsorption capacity of Cr (VI) [3].
Chemicals and reagents
Hydrochloric acid (HCl) 37% (Fluka, Germany), phosphoric acid (H3PO4), chitosan (CS-deacetylation degree 92.0 wt-%; 1.0 × 10⁶ Da molar mass), Acetic Acid (AAc) (99% purity), Poly (Vinyl Alcohol) (PVA, hydrolysis degree of 99.0%-99.8%) (sigma aldrich), gluteraldehyde (pentane-1, 5-dial) (India), graphite powder (purity ≥ 99.9%) (changsha, China), sodium nitrate (NaNO3) (98%, nice chemicals), potassium permanganate (KMnO4) (99%, RFCL), potassium dichromate (K2Cr2O7) (Carelabmed, India), sulfuric acid (H2SO4) (95%-97%, (Fluka, Germany), sodium hydroxide (NaOH) assay>97% (RPE, ACSISO for analysis), ammonium persulfate (NH4)2S2O8) assay=99% (BDH, England), 1,5-diphenylcarbazide (C13H14N4O assay>99% (sigma aldrich, India) and hydrogen peroxide (H2O2) (30%) were used [4].
Materials syntheses
Graphene Oxide (GO) was made by Hummers method. Briefly, 1.0 g of graphite was added into 9:1 (H2SO4:H3PO4) concentrated solution in a flask, then 6 g of KMnO4 was added. The resultant mixed solution was heated to 50â?? and allowed to react for 6 h under mechanical stirring and ultrasonication. Upon completion of the reaction, the flask was put into an ice bath containing H2O2 and enough ice water for 1 h. Then the filtrate was calm and centrifuged at 5000 rev/min and washed with distilled water until pH 7.0, followed by coagulation with ethanol and vacuum drying.
As the procedure reported in the literature, Water Hyacinth Leaf Protein Concentrate (WHLPC) was synthesized. Water hyacinth leaves were collected from lake Tana at Bahir Dar city, Ethiopia. First, the collected leaf material was destalked and washed in running tap water until it was clean [5]. The water hyacinth leaves were then soaked in water at a 2:1 ratio for 30 min then macerated using a blender. Sodium hydroxide (NaOH, 0.1 M) was added to the slurry until reaching pH 9.0 allowing the solubilization of leaf proteins. The tissue slurry was then filtered through cheese cloth and the filtrate was collected. The protein from the filtrate was coagulated by adding 0.1 M HCl until pH 2.0. The coagulum was subjected to 80°C for five minutes to form large protein clumps that could be separated by filtration and oven-dried at 60°C.
WHLPC/GO/CS/PVA composites were synthesized following the procedure reported in the literature where 250 mg of the prepared GO powder was mixed in 125 mL distilled water and followed by sonication for 30 min. 500 mg chitosan was mixed homogeneously in 12 ml (2% acetic acid) until a clear solution was observed [6]. 500 mg PVA was dissolved in 4.5 ml distilled water and heated at 90°C for 30 min. Then, 4 g WHLPC, 50 mL of the prepared GO suspension, 4.5 ml PVA solution, 12 mL CS solution and 300 μL GA solution (25%) was mixed under ultrasonic dispersion for 1 h at 25°C. The resulting mixture was dropped into a gently stirred 5% NaOH for 48 h to form a stable cross linked WHLPC/GO/CS/PVA composite. Finally, the composite was washed with ultrapure water several times until residual reagents were removed and oven dried at 60°C for 12 h.
Characterization of the WHLPC/GO/CS/PVA
X-ray diffraction is the most widely used technique for general crystalline material characterization. It is used to measure the average spacing between layers or rows of atoms and determine the orientation of a single crystal or grain. The XRD graph obtained for CS, synthesized GO, PVA, WHLPC and WHLPC/GO/CS/PVA are shown in Figure 1. The d spacing of the most intense peaks was calculated by using Bragg's relationship [7].
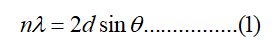
Where λ is X-ray wavelength, n is an integer and θ is the angle between the incident and reflected rays.
The chemical composition of CS, synthesized GO, PVA, WHLPC and WHLPC/GO/CS/PVA was analyzed using Spectrum 65 FT-IR (perkin elmer) in the range of 4000 cm-1 400 cm-1 (resolution: 4 cm-1, number of scans: 4 using KBr pellets) [8].
Adsorption experiments
The adsorption experiments were conducted in an Erlenmeyer flask with a capacity of 25 mL containing 10 mL of aqueous Cr (VI) solutions of different concentrations and adsorbent dosage of 30 mg of WHLPC/GO/CS/PVA. The solution pH was optimized and maintained at pH 1.0 using 0.1 M HCl. The sample flasks were placed in an orbital shaker for agitation at 200 rpm in the time range of 5 min to 420 min. Subsequently, the adsorbent was separated by filtering the respective solutions using 0.22 mm Whatman filter paper. Thereafter, the Cr (VI) content in the supernatant liquid was evaluated by using a UVvisible spectrophotometer [9]. The maximum absorbance measured at 540 nm corresponds to the formation of the red violet chromophore complex due to the reaction between C (VI) and 1,5-diphenyl carbazide in an acidic medium and the maximum intensity of absorbance (350 nm) due to yellow color of high concentration Cr (VI). Accordingly, the adsorption capacity of Cr (VI) was calculated as follows:
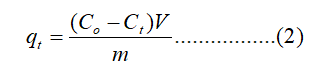
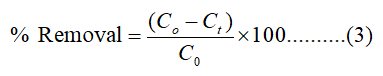
Where c0 and ct indicate the initial concentration of Cr (VI) and the concentration at any given time (t), respectively, m is the mass of the adsorbent in gram and V (L) is the volume of the Cr (VI) solution [10]. The qt represents the adsorption capacity at any time. The % removal of Cr (VI) was also calculated as follows:
The reproducibility of the results was checked by triplication of every adsorption experiment and was found to be within acceptable limits. The effects of pH, contact time, adsorbent dose, temperature, the adsorption isotherms and kinetics were explored for the removal of Cr (VI) [11].
Kinetic studies
For adsorption kinetic tests, 30 mg WHLPC/GO/CS/PVA was added to 10 mL Cr (VI) solutions (100 mg/L) at a pH of 1.0 for 5 min-420 min. The kinetics behavior was studied by fitting into the pseudo first order and pseudo second order equation equations given by eqns 4-5:
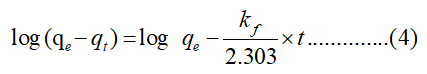
Where qt (mg/g) is the amount of adsorbate adsorbed at time t (min), qe (mg/g) is the adsorption capacity in equilibrium and kf (min-1) is the rate constant.
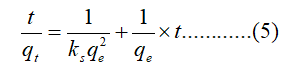
Where kS (g/mg min) is the rate constant of pseudo second order adsorption and the initial adsorption rate h can be regarded as the initial adsorption rate as qt/t→0, hence: h=kSqe2.
Adsorption isotherms
Adsorption isotherm experiments were carried out by shaking Cr (VI) solutions of different concentrations (100 mg/L-2000 mg/L) with 3.0 g/L WHLPC/GO/CS/PVA per 330 min at pH 1.0. The experimental data were then analyzed by fitting into the different adsorption isotherms described below [12].
The Langmuir isotherm is represented by the following equations:
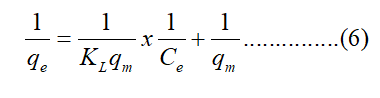
Where qe (mg/g) is the equilibrium adsorption capacity, Ce (mg/L) is the concentration in the liquid phase at equilibrium, KL (L/mg) is the Langmuir adsorption constant related to the energy of adsorption and qm (mg/g) signifies adsorption capacity.
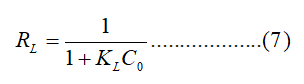
Where C0 (mg/L) is initial concentration. Adsorption is considered favorable if 0
The Freundlich isotherm is represented by the following equation as follows:
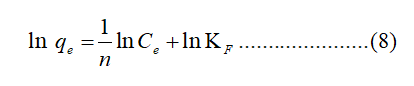
Where KF (L/mg) is the Freundlich constant and 1/n is the heterogeneity factor indicating the adsorption intensity of the adsorbent.
The thermodynamic parameters for the adsorption process were calculated from the following equation:
Where R is the gas constant of 8.314 J/mol k, Kc is the equilibrium constant and T (K) is the temperature. The Kc value is calculated from the following equation:
CA and CS (mg/L) are the equilibrium concentrations of Cr (VI) on the adsorbent and in the solution, respectively. Standard enthalpy (ΔH) and entropy (ΔS) of adsorption can be estimated from van’t Hoff equation given as:
The slope and intercept of the van't Hoff plot which are equal to-ΔH/R and ΔS/R, respectively, enable estimation of the enthalpy and entropy changes of the adsorption process.
Desorption and regeneration experiments
The desorption study was done by transferring 30 mg WHLPC/GO/CS/PVA mixed with 100 mg/L Cr (VI) to flasks containing 10 mL of 0.1 M NaOH. Afterward, the solution was shaken for 330 min, and the equilibrium concentration after desorption was measured. The WHLPC/GO/CS/PVA was thoroughly dried in an oven at 363K for 4 h and could be reused as an adsorbent for five consecutive cycles.
Error analysis
In this work, three error functions, the non linear chi square test (χ2), the coefficient of determination (R2) and the Standard Error of Estimate (SEE) were used for analyzing the adsorption system. The advantage of using the Chi-square test was comparing all isotherms on the same abscissa and ordinate. The equivalent mathematical statement was:
Where qe, m equilibrium capacity was obtained by calculation from the model (mg/g) and qe was the equilibrium capacity (mg/g) from the experimental data. The coefficient of determination (R2) was calculated as follows:
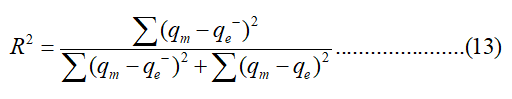
Where qe,m is the equilibrium capacity obtained from the isotherm model, qe is the equilibrium capacity obtained from the experiment and qe is the mean of qe. The Standard Error of Estimate (SEE) was calculated as follows:
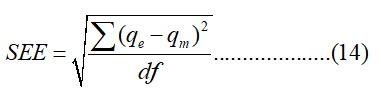
Where qe is the experimental equilibrium adsorption capacity, qm is the equilibrium capacity obtained from the isotherm model ad df is the degree of freedom, which is the difference between several data points and the number of parameters in the isotherm model function. These error analysis parameters were calculated using origin 16 software.
XRD and FTIR characterization of WHLPC/GO/CS/PVA
The XRD spectra of the composites (WHLPC/GO/CS/PVA) and the different components (CS, GO, PVA and WHLPC) used to synthesize the composite materials are shown in Figure 1.

Figure 1: X-ray diffraction patterns of CS, GO, PVA, WHLPC, and WHLPC/GO/CS/PVA.
The XRD pattern of CS exhibits two characteristic peaks at 2θ=10° and 20°, respectively, while pure PVA shows XRD patterns at 2θ=19.89° and a shoulder at 24.7°, which indicates a semicrystalline nature of PVA. The diffraction peak at 260 for pure graphite, corresponding to the organized layer structure with an interlayer distance of 0.35 nm along with the (002) orientation. The disappearance of the peak at 260 and the appearance of the peak at 100 with a d spacing of 1.35 nm for the prepared GO is due to the presence of hydroxyl, epoxy and carbonyl groups after the chemical oxidation of graphite. WHLPC showed four sharp distinct peaks at 20 values of approximately 15.00, 24.60 and 35.140, 38.40 showing the crystalline nature of WHLPC and two broad peaks appeared at approximately 100 and 20.50 may be attributed to semicrystalline lattice spacing of proteins and cellulose in the leaf extract respectively. Broad peaks with small intensities were observed at 100 and 200 due to the amorphous nature of the prepared composite material (WHLPC/GO/CS/PVA). Moreover, there is one sharp peak at 2θ=14.89° and lower intense small sharp peaks were observed at 2θ values between 25 and 500 due to the existence of some metals. The composite material has broad and lower intense peaks at each theta value of the constituent material, showing that an amorphous composite material of WHLPC/GO/CS/PVA is well prepared. The FTIR spectra of CS, GO, PVA, WHPLC and WHPLC/GO/CS/PVA are presented in Figure 2 below.

Figure 2: FT-IR spectra of CS, GO, PVA, WHPLC and WHPLC/GO/CS/PVA.
In the IR spectra of chitosan, 3456 cm-1 (O-H stretching overlapping the N-H stretching), 2927 and 2882 cm-1 (C-H stretching) and 1652 cm-1 (C=C stretching). For GO, the absorption peaks corresponding to O-H stretching (3402 cm-1) which is superimposed on the OH stretch of carboxylic acid, is due to the presence of absorbed water molecules and alcohol groups. The peak at 2934 cm-1 is attributed to CH2 stretching. The peak around 1623 cm-1 is attributed to C=C stretching from the unoxidized graphitic domain. The peak at around 1734 cm-1 is attributed to the C=O stretch of a carboxyl group. For PVA, the large band observed at 3450 cm-1 is due to the stretching of O-H from the intermolecular and intramolecular hydrogen bonds. The vibration band at 2923 and 2860 cm-1 refers to the stretching of C-H from alkyl groups and CH2. The peak at 1746 cm-1 is due to C=O from the acetate group. The FTIR spectrum gives numerous valuable messages about the functional groups in WHLPC. The spectral peaks at 3437 cm-1, 2923 cm-1 and 1635 cm-1 represented O-H, C-H and C=O stretching vibration, respectively. However, the organic group C=O is present in proteins, amino acids, peptides, carbohydrates and lipids. For the prepared comp osite material (WHLPC/GO/CS/PVA), peaks were obtained at 3450 cm-1, 2923 cm-1 and 1641 cm-1 showing that O-H, C-H and C=O functional groups were introduced to the new prepared composite.
Effect of pH, contact time and adsorption kinetics
The effect of pH on the adsorption of Cr (VI) by WHLPC/GO/CS/PVA was studied at different pHs (1.0-6.0) and the result is shown in Figure 3. In aqueous solutions, Cr (VI) exists as, HCrO4-, HCr2O7-, H2CrO4 (pH<2), Cr2O72- and CrO42- (pH 2-6).The pH of the solution affects the surface charge, adsorbate speciation and degree of ionization of the adsorbent in a solution. When the pH increases, the surface of the adsorbent becomes negatively charged due to the deprotonation of functional groups on the adsorbent surface. As a result, there is an electrostatic repulsion between the adsorbent and the anion forms of Cr (VI) that leads to a decrease in the extent of the adsorption process. At lower pH, there is a strong electrostatic attraction between the positively charged surfaces of adsorbent and Cr (VI) ions and the maximum adsorption capacity was obtained at pH 1.0 (Figure 3 (A)).The effect of contact time (5 min-420 min) on the adsorption process at a temperature of 25°C, adsorbent dose (30 mg) and pH (1.0) were studied and the results are depicted in Figure 3 (B).
The adsorption capacity increased with time in the first stage of the adsorption process and reached maximum removal at an equilibrium time of 330 min. This is attributed to the high availability of vacant adsorption sites in the first stage of adsorption. As time increases, the increase in adsorption capacity becomes insignificant due to the repulsive forces of the adsorbed ions and the difficulty to access the active sites. The kinetics of Cr (VI) ion adsorption on WHLPC/GO/CS/PVA has been investigated by fitting the experimental data on the effect of contact time on the adsorption capacity (Figure 3 (B)) into the pseudo first order and pseudo-second-order kinetic models and the results are shown in Figure 3 ((C) and (D)).
The pseudo first order and pseudo-second-order models show good fits to the experimental data with correlation coefficients of 0.979 and 0.999 for Cr (VI), respectively. Moreover, the theoretically calculated adsorption capacities from pseudo first order and pseudo second order models were found to be 18.41 mg/g and 30.77 mg/g, respectively and the adsorption capacity obtained from the pseudo second order model is close to the experimental value of 30.0 mg/g. Hence, the pseudo second order model can be applied to predict the adsorption kinetics. The rate-controlling step was chemisorption.

Figure 3: A) Effect of pH; B) contact tim; C) pseudo-first order and D) pseudo-second order kinetic model plot for Cr (VI) adsorption onto WHLPC/GO/CS/PVA. (Conditions: pH=1.0; Co=100 mg/L and adsorbent dosage=3.0 g/L).
Effect of adsorbent dosage initial concentration, temperature and equilibrium studies
Figure 4A shows the effect of adsorbent dosage on the adsorption capacity and the percent removal of Cr (VI). The percent removal of Cr (VI) increased from 45.09% to 99.99% whereas the adsorption capacities decreased from 41.93 mg/g to 9.30 mg/gas the adsorbent dosage increased from 10 mg/10 mL to 100 mg/10 mL. This trend is because all active sites were entirely exposed at lower doses, while only a fraction of the active sites were exposed at higher doses. At higher adsorbent, aggregation may occur which decreases the total surface area of the adsorbent leading to a decrease in adsorption.
The effect of the initial Cr (VI) concentration (100 mg/L up to 2000 mg/L) was studied at pH 1.0, constant agitation speed, contact time of 330 minutes, and adsorbent dose 3.0 g/L. The results are proven in Figure 4B along with Langmuir and Freundlich adsorption isotherm nonlinear fitting of the experimental data. The adsorption capacity of Cr (VI) increased with increasing initial concentration and has become constant at higher concentrations.
This behavior is due to the presence of a higher concentration of adsorbate per unit mass than adsorbent which can limit adsorption due to the fact the initial concentration gives an important driving force to overcome all resistance mass transfer of metal ions between the aqueous phase and the solid phase. At low concentrations, binding sites rapidly absorb available ions. At higher concentrations adsorption, the species must spread to internal sites by intraparticle diffusion, with a consequent reduction in the rate of uptake.
Table 1 summarizes the important parameters corresponding to each adsorption isotherm. The nonlinear analysis values of R2 for the Langmuir and Freundlich isothermal model were found to be 0.9424 and 0.9892 respectively and SEE values were 142.9 and 26.77 respectively. Hence, the Freundlich isotherm model best fits the experimentaldata and the maximum adsorption capacity was found to be 171.22 mg/g. The obtained maximum adsorption capacity is near to the experimentally obtained qe value of 160 mg/g.
Adsorption thermodynamics can aid an understanding of the adsorption process and provide practical information for processing conditions. The effect of temperature on the adsorption of Cr (VI) by WHLPC/GO/CS/PVA was evaluated using (Eq.(16)). The Cr (VI) removal capacity of WHLPC/GO/ CS/PVA increased from 84.02 mg/g to 99.03 mg/g when the adsorption temperature varies from 298 K to 328 K. To comprehend the interaction between Cr (VI) removal and WHLPC/GO/CS/PVA, (ΔG°, kJ/mol), (ΔH°, kJ/mol) and (ΔS °, J/mol-1 K-1) were calculated.
| Isotherm model | Non-linear formula | Other parameters | R2 | χ2 | SEE | |
|---|---|---|---|---|---|---|
| Langmuir | 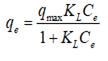 |
qmax (mg/g) (164.69) | kL (L/mg) (5.54 × 10⁻³) | 0.9424 | 142.9 | 9.36 |
| Freundlich | 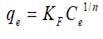 |
KF ((mg/g) (L/mg)1/n) (16.99) | n (3.29) | 0.9892 | 26.77 | 1.68 |
| Experimental | qe, (exp) (160 mg/g) | |||||
Table 1: Langmuir and Freundlich isotherm parameters obtained by non linear fitting for WHLPC/GO/CS/PVA at (pH 1.0, adsorbent dose 3.0 g/L, time=330').
The ΔG° increased from -0.04 kJ/mol to -1.04 kJ/mol when the adsorption temperature increased from 298 K to 328 K, indicating adsorption is more conducive to temperature increase. The ΔH° and ΔS° values were calculated as 9.71 kJ/mol and 33 J/K mol, respectively, from a line plot of ln (Kc) vs. 1/T. The positive value of ΔH°revealed the endothermic character of the Cr (VI) remediation. Finally, the positive ΔS° value implies that the randomness increases at the interface between Cr (VI) and the surface of WHLPC/GO/CS/PVA during the adsorption process (Figure 4).

Figure 4: A) Effect of adsorbent dosage (Experimental conditions: pH =1.0; contact time =330 min); B) Non-linear fitting of Langmuir and Freundlich adsorption isotherm models; C) and D) Effect of temperature (Conditions: C0=500 mg/L; pH=1.0; contact time=330 min; adsorbent dosage=3.0 g/L).
Reusability study
The reuse of WHLPC/GO/CS/PVA determines its applicability in wastewater treatment. Therefore, desorption was done by transferring 30 mg WHLPC/GO/CS/PVA saturated with 100 mg/L Cr (VI) to flasks containing 10 mL of deionized water in 0.1 M NaOH. Afterward, the solution was shaken for 330 min. Finally, the concentration after desorption was measured. The desorbed WHLPC/GO/CS/PVA was carefully dried in an air oven at 363 K for 4 hours and reused as an adsorbent. As shown in Figure 5, the reuse efficiency of WHLPC/GO/CS/PVA decreases up to 65% in the first five desorption recycling experiments. It can be generalized that WHLPC/GO/CS/PVA is suitable for the re adsorption of heavy metals from wastewater (Figure 5).

Figure 5: WHLPC/GO/CS/PVA recycling study (pH 1; contact time 330 min; initial concentration of Cr (VI)=100 mg/L)
The maximum adsorption capacities of different adsorbents for Cr (VI) adsorption were compared with similar adsorbent materials reported in the literatures in Table 2.
| Types of adsorbent | qm (mg/g) |
|---|---|
| Chitosan/graphene oxide | 104.16 |
| Nanochitosan/polyvinyl alcohol/carboxymethyl starch ternary blend | 232 |
| Chitosan/reduced graphene/montmorillonite porous composite | 87 |
| Biochar of water hyacinth | 55.55 |
| Chitosan hydrogel | 93.03 |
| Lignin/graphene oxide composite | 368.78 |
| Polyethyleneimine cross linked graphene oxide | 436.2 |
| Graphene oxide/chitosan composite | 86.17 |
| Graphene oxide/chitosan composite hydrogel | 146 |
| A novel graphene oxide coated water hyacinth biochar composite | 150.02 |
| Chitosan modification of magnetic biochar produced from eichhornia crassipes | 120 |
| WHLPC/GO/CS/PVA | 171.22 |
Table 2: Comparison of Cr (VI) adsorption capacity of different adsorbents.
The adsorption capacity of WHLPC/GO/CS/PVA composite was higher than CS/GO, WHLB/GO, WHLB/CS and other adsorbents indicating that the prepared composite material improves the adsorption capacity of some other similar single, binary and ternary composite adsorbents. Accordingly, WHLPC/GO/CS/PVA is promising for the removal of Cr (VI) from aqueous solutions due the simplicity of the modification procedures and a relatively higher adsorption capacity.
This work confirmed a low value and green water hyacinth containing biopolymer composite (WHLPC/GO/CS/PVA) in which approximately 80% of the synthesized composite fabric constitutes WHLPC for Cr (VI) elimination from wastewater. The simplicity of the modification, the notably massive adsorption capacity and the better quantity of WHPLC used to make an amazing opportunity to efficiently make use of the enormously invasive weed for putting off the Cr (VI) from any wastewater. Moreover, it may be effortlessly scaled up and assist to reach at successfully killing two birds with one stone.
The financial support from the Ethiopian biotechnology institute and the International Science Program (ISP), Uppsala university, Sweden is greatly acknowledged.
[Crossref] [Google Scholar] [PubMed]
[Crossref] [Google Scholar] [PubMed]
[Crossref] [Google Scholar] [PubMed]
[Crossref] [Google Scholar] [PubMed]
[Crossref] [Google Scholar] [PubMed]
Citation: Taye A, Yifru A, Mehretie S, Getachew N, Admassie S (2023) Water Hyacinth Leaf Protein Concentrate Composites for Removal of Hexavalent Chromium. J Thermodyn Catal. 14: 337.
Received: 20-Sep-2022, Manuscript No. JTC-23-19278; Editor assigned: 23-Sep-2022, Pre QC No. JTC-23-19278(PQ); Reviewed: 07-Oct-2022, QC No. JTC-23-19278; Revised: 02-Mar-2023, Manuscript No. JTC-23-19278(R); Published: 30-Mar-2023 , DOI: 10.32548/2157-7544.23.14.337
Copyright: © 2023 Taye A, et al. This is an open-access article distributed under the terms of the Creative Commons Attribution License, which permits unrestricted use, distribution, and reproduction in any medium, provided the original author and source are credited.