
Journal of Agricultural Science and Food Research
Open Access
ISSN: 2593-9173
ISSN: 2593-9173
Research Article - (2025)Volume 16, Issue 1
The verification trial of soil test based crop response phosphorous calibration study for bread wheat production was conducted in 2021/22 main cropping season in Bora district of East Shewa zone. The trial was initiated to verify the phosphorus critical level (10 ppm), requirement factor (6.45 ppm) and optimum amount of nitrogen (69 kg/ha) determined during soil test based crop response phosphorus calibration study for bread wheat production in Bora district. The treatments were control (without fertilizer as T1), farmers practice (blanket recommendation as T2) which was 100 kg of urea and 100 kg of NPS and soil test based recommended phosphorus fertilizer rate as T3. The trial was conducted on six farmers’ field across the district and the trial was laid out in randomized complete block design that was replicated over farmers as replications. The plot size was 10 m × 10 m and 150 kgha-1 seed rate was used. Analysis of variance for grain yield and above ground biomass indicated that there was significant difference (P<0.05) between the treatments. The highest mean grain yield (4580 kg/ha) and above ground biomass (11.95 ton/ha) were recorded with the soil test crop response-based fertilizer recommendation treatment which was significantly higher than the farmer practice (3647 kg/ha and 9.67 ton/ha respectively); whereas the lowest grain yield (1938 kg/ha) and above ground biomass (5.84 ton/ha) were recorded for the treatment without fertilizer.
P-critical value; P-requirement factor; Calibration; Verification; Net benefit; Marginal rate of return
Cereals are the most widely grown crops and comprise about 87.97% of total grain production in Ethiopia. Wheat is one of the most important crop plants in the world. It grows under a broad range of latitudes and altitudes; it is not only the most widely cultivated crop but also the most consumed food crop all over the world. Wheat is one of the most important cereals cultivated in Ethiopia. It ranks fourth after maize (Zea mays), tef (Eragrostis tef) and sorghum (Sorghum bicolor) both in area coverage and production. Ethiopia is the largest producer of wheat in Sub-Saharan Africa (SSA) and the area coverage and production of the crop in Ethiopia is estimated to be 1.7 million hectares and 4.8 million tons of grain yields, respectively. The national average productivity of wheat (2.7 tone ha) was still lower than world’s average (3.4 tone ha). Of the many reason for low productivity of wheat; decline of soil fertility, prevalence of disease, dependency on rain-fed traditional agriculture and low input including fertilizer application are the most important ones [1].
Unfortunately, many soils of Ethiopian highlands are inherently poor in available plant nutrients and organic matter content. But; crop production can be profitable if and only if balanced and adequate levels of Phosphorus (P) and other nutrients are used. So, at this volatile grain and fertilizer prices condition, sound soil test calibration is essential for successful fertilizer program and crop production. It is essential that the results of soil tests could be calibrated or correlated against crop responses from applications of plant nutrients in question as it is the ultimate measure of a fertilization program. Phosphorus is of primary concern in the assessment of the soil resources of Ethiopia since most of the soils in the highland areas of the country are reported to be deficient in phosphorus.
With rapid population growth, continuous and intensive cropping without restoration of the soil fertility has depleted the nutrient base of most soils resulting in poor crop yields. Soil tests are designed to help farmers predict the available nutrient status of their soils. Once the existing nutrient levels are established, producers can use the data to best manage what nutrients are applied, decide the application rate and make decisions concerning the profitability of their operations. However, local assessments for the soil P critical levels and soil Prequirement factors even for the major crops of the country are negligible [2].
Hence, calibration is a vital tool to attain the objective while calibrations are specific for each crop type and they may also differ by soil type, climate and the crop variety.
Description of the study area
This experiment was conducted in Bora district during the cropping season of 2021 on 6 farmers’ field. The district was situated in East Shewa zone, Oromia and far from Finfine 109 kilometers to South. The geographical location of Bora district was 8°18′2.08” N and 38°57′4.15” E with an elevation of 1,611 meters above sea level. The average annual rain fall and temperature were 1025 mm and 24°C respectively and the soils are characterized by vertisol (Figure 1) [3].
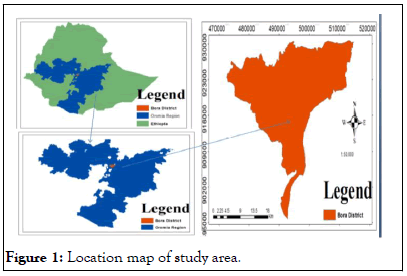
Figure 1: Location map of study area.
Experimental materials
Kakaba bread wheat variety, TSP fertilizer (46%) and urea (46% N) were used for the experiment.
Treatments and experimental design
Before planting, composite soil samples were collected from ten farmers’ field separately at 0-20 cm debth in zigzag method. The collected soil samples were properly managed, packed, labeled and transported to the laboratory. Then the soil samples were allowed to air dry, grounded, sieved using 2 mm sieve and analyzed for its available phosphorus. Using the Pc (10 ppm) and Pf (6.45 ppm) determined during the calibration study and initial available phosphorus (Pi) in the soil; the amount of phosphorus fertilizer requirement was calculated using the formula:
Phosphorus fertilizer rate = (Pc-Pi) × Pf
Where, Pc-critical phosphorus concentration which was determined from the calibration study, Pi-initial P which was determined from soil analysis of each site and Pf-phosphorus requirement factor which was derived from the calibration experiment. The verification trail was done using three treatments: Soil test based farmers practice (blanket recommendation) and control (without fertilizer). The verification experiment was laid out in randomized complete block design that was replicated over farmers as replications [4].
Urea and TSP fertilizers were used as source of N and P respectively. P fertilizer was applied at planting time and urea was applied in two splits (1/2 at planting and 1/2 at mid-stage). The experimental plot size was 10 m × 10 m (100 m2) for each treatments and 150 kgha-1 seed rate was used.
Data collection and analysis
The agronomic data like plant height, spike length, grain yield, aboveground biomass, seed per spike and thousand seed weight were collected. Agronomic data which were collected across locations were properly managed using EXCEL computer software. All the collected data was subjected to the Analysis of Variance (ANOVA) as per the experimental design using GenStat, software. The Least Significance Difference (LSD) at 5% level of probability was used to determine differences between treatment means [5].
Plant height and spike length
The results of analysis of variance (Table 1) showed that there were not significant differences (P ≤ 0.05) among the soil test based and farmer practice treatments for plant height and spike length of bread wheat. However both parameters were significantly affected between control and fertilized treatments. Numerically, the maximum plant height (89.54 cm) and spike length (8.14 cm) were recorded for soil test based; whereas the minimum plant height (72.24 cm) and spike length (6.46 cm) was recorded for control [6].
Seed per spike
The mean analysis of variance showed that seed per spike was significantly influenced (P ≤ 0.05) between the treatments. The highest seed per spike (45.98) were recorded for soil test based and followed by farmer practice (40.72); whereas the lowest number of seed per spike (27.59) was recorded for control [7].
Grain yield and biomass
The ultimate goal in crop production is to maximize economic yield, which is a complex function of individual yield components in response to the inputs used. In a broad sense, growth in cereals is directly related to grain yield. The analysis of variance for grain yield and above ground biomass, showed significant (P<0.05) difference among the treatments (Table 1) [8].
| Treatments | Plant height (cm) | Spike length (cm) | Seed/spike | Grain Y (kg/ha) | Biomass (ton/ha) | TKW (gm) | HI (%) |
| Control | 72.24b | 6.46b | 27.59c | 1938c | 5.84c | 34.48b | 34.0b |
| Farmer practice | 87.49a | 7.657a | 40.72b | 3647b | 9.67b | 45.93a | 37.8a |
| Soil test based | 89.54a | 8.14a | 45.98a | 4580a | 11.95a | 49.39a | 38.4a |
| LSD | 7.73 | 0.6 | 4 | 745.09 | 1.54 | 4.84 | 2.74 |
| CV (%) | 6.5 | 5.6 | 7.3 | 15.3 | 11.7 | 7.8 | 11.5 |
Table 1: Effect of phosphorus fertilizer supplemented with nitrogen application on the mean yield and yield components of bread wheat in Bora District.
Thousand kernel weight and harvest index
The results of analysis of variance for thousand kernel weight and harvest index of bread wheat (Table 1) showed that there were not significant differences (P ≤ 0.05) among the soil test based and farmer practice treatments. However thousand kernel weight and harvest index of bread wheat were significantly (P ≤ 0.05) affected between control and fertilized treatments. The maximum mean of thousand kernel weights and harvest index (49.39 gm and 38.4% respectively) was recorded for soil test crop response based fertilizer recommendation; which were significantly higher than the thousand kernel weights and harvest index recorded for control (34.4 gm and 34.0% respectively). The results of this study were consistent with the previous findings of Desalegn et al.
Economic analysis
To verify the feasibility of soil test crop response based fertilizer application for wheat production in the study area, the partial budget analyses was carried out across the treatments. According to the MRR of major cereals was range from the minimum recommended rate 50% to 100% in most agricultural production and it is better when the MRR was >100% [9].
In this study, analysis of variance for grain yield and above ground biomass indicated that there was significant difference (P<0.05) between the treatments. The highest mean grain yield (4580 kg/ha) and above ground biomass (11.95 ton/ha) were recorded with the soil test crop response-based fertilizer recommendation treatment which was significantly higher than the farmer practice (3647 kg/ha and 9.67 ton/ha respectively); whereas the lowest grain yield (1938 kg/ha) and above ground biomass (5.84 ton/ha) were recorded for the treatment without fertilizer. This means, by applying recommended rate of P and optimum urea fertilizer application rate, yield of bread wheat could be increased by 26% over the blanket fertilizer recommendation.
Similarly, the economic analysis also showed that the highest net income (104,667 ETB) was obtained from soil test crop response based fertilizer application treatments with marginal rate of return (725.81%) which was greater than the minimum marginal rate of return 100%. Therefore, it is concluded that, the optimum rates for wheat production were found to be 150 kg/ha urea (69 kg N/ha) and the soil test based phosphorus fertilizer recommendation (pc=10 ppm and pf=6.45 ppm) could be followed for bread wheat Production in Bora Districts. Further, in order to adopt and popularize this site specific soil test crop response based p fertilizer recommendation, it should be demonstrated in the study area for bread wheat production and productivity.
First of all, we would like to thank Almighty God for blessing us with invaluable gifts of health, strength, patience and protection to start and complete this study. Secondly, the authors would like to thank Oromia Agricultural Research Institute for financial support; Batu Soil Research Center for providing research facilities like supply of inputs and logistic.
[Crossref] [Google Scholar] [PubMed]
Citation: Lemma A, Firomsa T (2025) Verification of Soil Test Crop Response Based Phosphorus Calibration Study on Bread Wheat (Triticum aestivum L.) in Bora District of East Shewa Zone, Oromia, Ethiopia. J Agri Sci Food Res. 16:199.
Received: 09-Oct-2024, Manuscript No. JBFBP-25-34564; Editor assigned: 14-Oct-2024, Pre QC No. JBFBP-25-34564 (PQ); Reviewed: 28-Oct-2024, QC No. JBFBP-25-34564; Revised: 07-Mar-2025, Manuscript No. JBFBP-25-34564 (R); Published: 14-Mar-2025 , DOI: 10.35248/2593-9173.25.16.199
Copyright: © 2025 Lemma A, et al. This is an open-access article distributed under the terms of the Creative Commons Attribution License, which permits unrestricted use, distribution, and reproduction in any medium, provided the original author and source are credited.