Journal of Agricultural Science and Food Research
Open Access
ISSN: 2593-9173
ISSN: 2593-9173
Research Article - (2022)Volume 13, Issue 4
This study was aimed to research sesame value chain in four potential sesame producing kebeles of Benatsemay and Salamago woredas of South Omo Zone of SNNPR. Simple descriptive statistics and value chain approach were employed for data analysis during this study. It attempts to deal with mapping and identifying sesame value chain actors and their roles, examines marketing channel, cost margin structure and assessing challenges and opportunities within the study area. Supported these producers, local collectors, wholesalers, retailers and exporters were found to be core actors in sesame value chain within the study area. The results of the study indicated that out of the 595.38 quintal total sesame produced by sample respondents, 558.93 quintals (93.87%) were supplied to markets for various actors and five alternative marketing channels were identified to transact the sesame product through intermediaries. the most important volume of sesame (490.08 Quintals) was marketed through channel V but not necessarily with largest marketing margin obtained. Costs and benefits were found to be disproportionally distributed that the very best average margin of profit (38.2%) was visited the producers while (28.1%) and (20.3%) sent to the retailers and wholesalers respectively. the most barrier to entry traders into the market is that the capital requirement and therefore the wholesalers govern by volume transacted and internal control criteria within the market. Fertile land and high demand for the merchandise were the essential opportunity for sesame production and marketing within the value chain. Pests and disease, low level of input utilization, shortage of input supply and high price of inputs were the most challenges of sesame production whereas lack of market information, price variability, delay of buyers, low bargaining power and poor product quality were the most challenges sesame marketing.
Value addition; Value chain; Value chain actors; Sesame marketing
Agriculture is that the core component and driver for Ethiopia’s growth and long-term food security. The contributions are high: 15 to 17 percent of the Government of Ethiopia’s expenditures are committed to the world. Agriculture directly employs 80 percent of the entire population, 43 percent of Gross Domestic Product (GDP), and over 70 percent of export value (UNDP, 2013). Despite the considerable progress made within the sector, ensuring commercialized production remains one among the main challenges facing many people. There also are challenges which are related to food security in some a part of the country.
In East African countries like Kenya, Ethiopia, Uganda, and Tanzania, for instance, smallholder farming accounts for about 75 percent of agricultural production [1]. Particularly in Ethiopia, smallholder farmers cultivate approximately 95 percent of the entire area cultivated and produce quite 95 percent of the entire agricultural output [2]. It's this figure that accounts for 41 percent of the country’s Gross Domestic Product (GDP) and covers quite 90 percent of the country’s’ foreign currency earnings [3].
Sesame (Sesamum indicum L.), otherwise referred to as sesamum or benni seed, member of the Pedaliaceae, is one among the foremost ancient oilseeds crops known to mankind. Sesame seeds were appreciated for his or her ability to feature nutty flavor or garnish foods, they were primarily used for oil and wine. Its color varies from cream-white to charcoal-black but it's mainly white or black. Other colors of some benni seed varieties include yellow, red or brown [4].
Ethiopia is among the highest five producers of oilseeds within the world. One among the oilseeds that Ethiopia is understood for within the international market is sesame. Within the previous couple of years, sesame production and marketing have shown very significant growth. Between 1998 and 2005- 2006, the entire area of production and therefore the quantity of sesame produced has grown threefold. As a serious producer of sesame, Ethiopia stands fourth within the global sesame market following China, India, and Burma, respectively and national sesame production has quite doubled within the past 5 years. Ethiopia exports most of its products and is poised to become one among the highest two leading sesame-exporting countries within the world, with a rapidly growing export performance in recent years, destined for markets in China, Japan, Korea, Israel, and Turkey. Sesame is that the major oilseed in terms of exports in Ethiopia, accounting for over 90% of the values of oil seeds exports [5].
Sesame is currently among the main Ethiopian export crops and is one among the agricultural crops that Ethiopia is understood in International markets [6]. Evidence indicates that Ethiopia ranks fourth in sesame production in 2011/2012 within the world, and therefore the third in benni seed export next to India and Sudan [7]. Evidence revealed that there's still potentially arable land in several parts of the country to grow the crop and increase its supply response to the considerable demand for Ethiopian benni seed in international markets [6].
The export of oilseeds of Ethiopia generally and sesame, especially, is expanding and therefore the country’s total exports are performing better within the growing world market. Ethiopia’s share of 1.5% in export volume and 1.9% in value in 1997 had grown to 8.9% and 8.3% in 2004 respectively. Within the stated years, Ethiopia ranks 4th in export quantity and revenue following Sudan, India and China. Since sesame contributes, quite 80% of the export earning among the oilseeds it's become the second foreign currency-earning crop after coffee. Sesame is grown from water level to altitudes of 1500 m with uniformly distributed rainfall of about 500-800 mm and temperature of 25°C-30°C. All the sesame growing areas fulfill the above condition within the country. Sesame in Ethiopia grows well within the semi-arid areas of Amhara, Tigray, Benshangul Gumuz, and Somali Regions. Low lands of Oromiya and Southern Nations Nationalities and Peoples Regions also grow a big amount which is driven by high market price and suitability of environmental conditions [8].
In the Southern Ethiopia Nations and Nationalities Peoples Regional State, specifically, areas located within the gorges of Gibe, Gojeb and Omo rivers and hot to warm sub-moist and rift valleys are identified areas for sesame cultivation. This study is especially focused on the sesame marketing value chain analysis within the South Omo zone within the Southern nation nationalities regional state. Among the available marketing study approaches, the commodity approach is used thanks to its combination nature of both functional and institutional approaches.
Currently, Ethiopia is among the highest five producers of benni seed within the world, ranked in fourth place by covering about 8.18 percent of the entire world production [7]. Within the North West and South Western low land areas of the country, sesame is currently cultivated on fertile lands and there seems to be less need for fertilizers. During the year 2007/08, there have been about 527,819 sesame growers with a mean acreage of 0.3 ha are involved in benni seed production who produced 18,677.3 tones most of which are smallholder farmers. Besides smallholders, there are a limited number of investors or large commercial farmers (having quite 100 ha). The share of the latter is a smaller amount than 2% [8]. This is often the case for many smallholders and enormous commercial farms. Services and response to consumer demand. As such, value chains include the vertically linked interdependent processes that generate value for the buyer [9].
Because the worth chain is beneficial for identifying and categorizing input used, key producers, market players, supporting organizations and final consumers of the produce. The worth chain also illustrates different market channels that a product takes before reaching the ultimate consumer. Therefore a worth chain analysis is a crucial tool used for identifying bottlenecks, also as possible opportunities.
Description of the study area
The study was conducted in two Woredas of South Omo Zone like Salamago and Bena-Tsemay Woredas. Salamago Woreda is one among the Woredas in South Omo Zone, Southern Nations Nationalities and Peoples Regional State, in Ethiopia. It’s located 870 Km far away from the capital city of Ethiopia (Addis Ababa). It’s astronomically located between 6°19' and 7°10'N Latitude and 15°12' and 22°25'E longitude with total area coverage of 451.12 square kilometers. The Woreda has two agro-ecological zones like midland altitude which has covered 33% of the entire land whereas; the remaining 67% of the entire area is low land. The mean annual temperature was 29°C (ranges from 20 to 37.5°C). The typical altitude of the woreda is 971 metres above water level and receives bimodal rainfall, during which the long season is within the months from March to June, while the short season occurs within the months from August to October.
Also, Bena-Tsemay Woreda is one among the Woredas in South Omo Zone, Southern Nations Nationalities and Peoples Regional State, in Ethiopia. It’s located 739 Km far away from the capital city of Ethiopia (Addis Ababa). It’s astronomically located 36°43'30.1''E latitude and 5°29'57.1''N longitude with total area coverage of 3754 square kilometers. The woreda has characterized by arid and semi-arid climate. The annual temperature ranges from 26°C -35°C. The altitude of the woreda ranges from 1436-1553 m.a.s.l and receives bimodal rainfall, during which the long season is within the months from April to June, while the short season occurs within the months from September to October.
Data type and source
Both qualitative and quantitative data were collected from primary and secondary data sources. Primary data were collected from sesame producer farmers, traders, and processors. Whereas Secondary data were collected from works of literature, reports, documents both from published and unpublished data sources.
Sample size and sampling procedures
Multi-stage sampling techniques were employed to draw sample respondents. Within the first stage, potential sesame producing Woredas were selected purposively from the zone. Within the second stage, from each selected woredas, two kebeles were selected purposively supported sesame producing potential. Following to the present, sample size determination formula of Yamane (1967) [10], which described below was wont to determine the sample size.
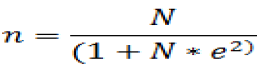
Where, n=the sample size, N=total number of households, e=acceptable sampling error and therefore the value of 'e' is 95% confidence level and it’s assumed to be e=0.05. Sample size from each kebele was taken by using stratified sampling technique to the population size and eventually, a complete of 120 sample respondents were selected using simple sampling method.
Method of data collection
Both formal and informal survey techniques were wont to implement this study. Regarding the formal survey, a structured questionnaire was developed and employed over the sampled households to gather quantitative data. On the opposite hand, some informal survey tools like FGD, KII were wont to generate qualitative data from the elders who know deeply the world during which he/she lives in it. In each kebele, a complete of about 8-12 elder members participated in FGD during the survey time.
Data analysis
Simple descriptive statistical techniques like frequency, percentage, mean, variance, etc. were administered for quantitative data analysis using computer software packages or tools. Particularly Statistical Product Service and Solutions (SPSS) version 23 and excel were used as an analytical tool. Qualitative data generated through an off-the-cuff survey were summarized by discussion as SWOT analysis.
Demographic and socioeconomic characteristics
Under this section, both the socio-economic characteristics of producers and traders/urban collectors and exporters were analyzed using simple descriptive statistics. The socio-economic characteristics include sex, age, education level, legal status, and family size (Table 1).
| Variables | Frequency( N=120) | Percentage (%) | |
|---|---|---|---|
| Sex | Male | 106 | 88.3 |
| Female | 14 | 11.7 | |
| Age | 20-40 | 94 | 78.3 |
| 41-60 | 23 | 19.2 | |
| >60 | 3 | 2.5 | |
| Marital status | Single | 3 | 2.5 |
| Married | 112 | 93.3 | |
| widowed | 1 | 0.8 | |
| Divorced | 4 | 3.3 | |
| Family size | 5-Jan | 42 | 35 |
| 10-Jun | 67 | 55.8 | |
| >10 | 11 | 9.2 | |
| Education level | Illiterate | 62 | 51.7 |
| Primary | 51 | 42.5 | |
| Secondary | 6 | 5 | |
| Certificate and above | 1 | 0.8 | |
Table 1: Demographic and socioeconomic characteristics of sample producers.
The results of the study show that from the entire number of sample producers 88.3% were male-headed households whereas about 11.7% were female-headed households. Consistent with their age category, 78.3% of the respondents were found between the ages 20-40 years, 19.2% were between the age of 41-60 and a couple of .5% was above the age of greater than 60. About legal status 2.5% were single, 93.3 were married, and 0.8% was widowed whereas 3.3% of the respondents were divorced. The family size of the sample producers was also categorized into three supported their family size. consistent with this, about 35% of sample producers have a family size between 1-5, 55.8% were between 6-10 and therefore the rest 9.2% of sample producers have family size >10. This means that those sample producers, who have a family size of greater than have quite two wives or they undertake a polygamy mirage. The education level of sample respondents is categorized in to four groups. Supported this about 51.7 you look after sample respondents were illiterate, 42.5 there have been attained primary education, 5.0 there have been attained education and therefore the rest 0.8 % have an education level of certificate and above certificate respectively (Table 2).
| Variables | Local collectors | Wholesalers | Exporters | ||||
|---|---|---|---|---|---|---|---|
| F(N=13) | (%) | F(N=5) | (%) | F(N=3) | (%) | ||
| Sex | Male | 13 | 100 | 5 | 100 | 3 | 100 |
| Female | - | - | - | - | - | - | |
| Age | 20-40 | 11 | 84.62 | 2 | 40 | - | - |
| 41-60 | 2 | 15.38 | 3 | 60 | 3 | 100 | |
| Marital status | Single | 8 | 61.6 | 1 | 20 | - | |
| Married | 5 | 38.4 | 4 | 80 | 3 | 100 | |
| Education Level | Primary | 7 | 54 | - | - | - | - |
| Secondary | 3 | 23 | 5 | 100 | - | - | |
| Diploma | 1 | 7.6 | - | - | - | - | |
| Degree and above | 2 | 15.4 | - | - | 3 | 100 | |
Table 2: Demographic characteristics of local collectors, whole salers exporters.
In Table 2, the results of the study show that 100% of local collectors, wholesalers and exporters were male-headed households and there are no female-headed households in sesame collecting, wholesaling and exporting within the study area. Consistent with their age category, 84.62% and 40% of local collectors and wholesalers were between ages of 20-40 years, but there have been no traders between ages of 20-40 years. On the opposite hand local collectors, wholesalers and exporters whose ages found between 41-60 were 15.38%, 60% and 100% respectively. Consistent with their legal status 61.6% and 20% of local collectors and wholesalers were single and there have been no exporters who were single, while 38.4%, 80% and 100% of local collectors, wholesalers and exporters were married respectively.
The education level of the local collector, wholesalers and exporters were also categorized into four categories supported their academic level. Consistent with this about 54%, 23%, 7.6% and 15.4% of local collectors were primary, secondary, diploma and degree and above respectively. While 100% of wholesalers and exporters were attended secondary education and degree or above respectively (Table 3).
| Type of Traders | Exprience | Working Capital | Licensed business | |||
|---|---|---|---|---|---|---|
| <5 | 15-May | >15 | Yes | No | ||
| Local collectors | 65 | 35 | - | - | - | 100 |
| Wholesalers | 20 | 80 | - | 2.67x10⁶ | 100 | - |
| Exporters | - | 66.7 | 33.3 | 1.93x10⁷ | 100 | - |
Table 3: Profile of local collector, wholesalers and exportes.
Table 3 shows the profile of the sample traders. As illustrated within the table 65% of local collectors and 20% of wholesalers have a trading experience of 15 years. Consistent with the survey result, the mean capital of wholesaler and Exports were 2.665 × 10⁶ and 1.925 × 10⁷ respectively, but local collectors don't have their own capital. All wholesalers and Exporters sample respondents had operating licenses to trade sesame and other agricultural commodities. The value of those licenses may present a barrier of entry or, if other traders can operate freely without a license, penalize licensed businesses.
Sesame production
In 2010/2011 cropping season, the entire area under sesame production reaches 384,682 hectare and about 327,740.92 ton of benniseed has produced within the country [11]. Despite, these trends in 2011/2012 production year sesame production and area under its cultivation has declined by about 25.31% and 12.26% respectively, compared to the preceding year. Accordingly, only 337,505.41 hectare of land has cultivated under its production and only about 2,447,833.59 quintal of output was produced. This means that not only the dimensions of land allocated to sesame and its production volume was decreased, but also the crop yield too decreased from 8.52 quintal/hectare in 2010/2011 to 7.25 quintal/hectare in 2011/2012, by about 14.9% [12].
Sesame is usually grown as a smallholder crop, and a serious aim was to extend yield or oil-content selectively within local cultivars within the context of sesame’s place in local crop rotations. A serious drawback of local cultivars is that the mixture of colors in any seed sample, which reduces its commercial value. Selection within local sesame in Sudan showed that within a kind producing seed of 1 predominant color several strains might be isolated. These gave a highly variable yield, indicating that separation not only ensured the purity of seed color but by eliminating low yielding elements appreciably increased potential yield. Cultivation required for wheat, sorghum or similar small grains is suitable for sesame. Level lands are important to make sure even depth of planting, and lands could also be ridged to help drainage in areas where high-intensity storms are common. Seed quality is seldom a serious factor limiting yield and doesn't become important until the overall agriculture is raised. A serious agronomic factor-influencing yield is plant population, and for optimum yield, this must accurately be determined by trails with local cultivars and can differ if rain-grown or irrigated. Smallholder sesame is sewn by hand and therefore the small seeds are often mixed with sand, soil or ash to extend the quantity and assist even distribution (Figure 1).

Figure 1: Evaluation of phosphorus rates and rhizobial strain on haricot bean.
The production of sesame in six consecutive years ranging from the year 2004/2012 up to 2009/2017 is shown in Figure 1 above, supported this the quantity of sesame produced in 2004/2012 production year is 1733700 kg, which is that the lowest and within the years 2005/2013, 2006/2014, 2007/2015, 2008/2016 and 2009/2017 production years were 2845359 kg, 9564886 kg, 4855365 kg, 5391886 kg and 3163000 kg respectively. The very best amount of sesame was produced within the year 2006/2014 production year.
Sesame marketing
Sesame production and marketing volume within the study area: As shown in Table 4 below, the entire amount of sesame produced by sample respondents within the year 2019 was estimated to be 595.38 quintals. Out of this the entire estimated amount of sesame supplied by sample respondents to local collectors, wholesalers, retailers, and consumers were 558.93 quintals which were about 93.87% of total production. Only 6.13% were consumed at the household level (Table 4).
| Variables | Sum | Percentage |
|---|---|---|
| Total production in quintal at 2019 | 595.38 | 100 |
| Total sale in quintal at 2019 | 558.93 | 93.87 |
| For lacal collectors | 490.08 | 87.7 |
| For whole sallers | 42.85 | 7.7 |
| For retailers | 17 | 3 |
| For consumers | 9 | 1.6 |
Table 4: Sesame production and marketing volume in the study area.
Market channel: In the study area 5 alternative frequently transacted marketing channels were identified. The identified market channels were:
Channel I: Producers → Consumers (9 quintals)
Channel II: Producers → Retailers → Consumers (17 quintals)
Channel III: Producers → Wholesalers → Retailers → Consumers (12.35 quintals)
Channel IV: Producers → Wholesalers → Exporters (42.85 quintals)
Channel V: Producers → Local collectors Wholesalers → Exporters (490.08 quintals)
Regarding channel comparison using volume of transaction from farmers’ hand through traders as shown above, channel V carried the most important volume 490.08 quintals thanks to the high capacity of local collectors directly purchased from farmers and passes through whole sellers’ intermediaries to exporters. The littlest volume of sesame was skilled channel I about 9 quintals. This was thanks to the tiny capacity of consumers in rural village markets purchased smaller quantity for consumption. Farmers sold 42.85 quintals of sesame to their wholesalers and 30.5 quintals passes through wholesalers’ intermediaries to exporters and 12.35 quintals passes through retailers’ intermediaries to consumers (Figure 2).

Figure 2: Map of the sesame market chain.
Production and marketing costs and margins analysis across different channels
Production cost: Farmers incur different costs in sesame production ranging from land preparation, production, and marketing activities. This helps to know the difference between the value of yield per hectare and inputs value. In estimating the total cost of production, the variable and fixed cost components were considered. The variable inputs used were seeds, fertilizer, labor and agro-chemicals and that of fixed was land. Cost generally refers to the expenses incurred on inputs required for the production of commodities like crops, livestock, etc. Inputs required are labor, seeds, fertilizer, land, etc. (Table 5).
| Production items cost | Cost/Qt (in birr) | % Share |
|---|---|---|
| Fertilizer | 383.96 | 21.04 |
| Improved seed | 5.97 | 0.33 |
| Land | 150 | 8.21 |
| Labor | 1285.83 | 70.42 |
| Total production cost | 1825.76 | 100 |
Table 5: Sesame production cost per quintal.
In Table 5 above within the study area, producers incur different costs for input, labor and land. Cost of family labour and oxen ploughing per each day and successively during a year (season) for an additional farm working as daily labour were considered. A chance cost value for land was also considered as within the study area rental value in one production year (season). Moreover, producers incur costs for package, transporting to the market and albeit one package or sack used for numbers of loads to the market they incur costs for package. As survey result indicated, cost for labor was the very best (70.42%) among other costs of production.
Marketing costs and margins analysis at different marketing channels: Market channel comparisons in margin distribution were mad among major value chain actors. Consistent with Mendoza [13] computing the entire Gross Marketing Margin (TGMM) is usually associated with the ultimate price paid by the top buyer and expressed as a percentage (Table 6).
| Items (measured Birr/Quintal) | Producers | Traders/local collector | Exporters | Processors | Retailers |
|---|---|---|---|---|---|
| Purchase price | - | 2640 | 2800 | 3110 | 2720 |
| Production cost | 1825.76 | - | - | - | - |
| Marketing cost | 45 | 23 | 177 | 533.5 | 15 |
| Total cost | 1870.76 | 23 | 177 | 533.5 | 15 |
| Total cost share in % | 71.4 | 0.8 | 6.8 | 20.4 | 0.6 |
| Salling price | 2640 | 2800 | 3110 | 4052.03 | 3300 |
| Marketing margion | 814.54 | 160 | 310 | 942.03 | 580 |
| % share margin | 29.02 | 5.7 | 11.05 | 33.57 | 20.66 |
| profit margin | 769.24 | 137 | 133 | 408.53 | 565 |
| Gross margin % | 38.2 | 6.8 | 6.6 | 20.3 | 28.1 |
Table 6: Marketing costs and margins analysis at different marketing channels.
According to survey end in this study, the entire Gross Marketing Margin (TGMM) was highest in channel IV and V equally (34.85%) of the consumers’ price. Total gross marketing margin was lowest at channel II and III equally (20%) without considering channel I, farmers directly sold to consumers. On the opposite hand, producers’ Gross Marketing Margin (GMMp) or producers share was highest in channel II and III (80%) without considering channel I that producers directly sold to the last word consumers and received the entire channel portion. Whereas producers GMM was lowest at channel IV and V (65.15%) when producers sold to collectors and Wholesalers and passes through intermarries to exporters. Regarding to producers share or (GMMp), because the number of middlemen between the two ends (farmers and consumers) increases the share of farmers decrease. As an example, without considering channel I, (GMMp) or producers share is maximum (80%) at channel II and III when the amount of intermediaries minimum between the two ends and therefore the producers share (GMMp) minimum (65.15%) at channel IV and V when the amount of intermediaries maximum in number between the two ends. This proves the overall truth, because the number of intermediaries between the two ends increases the share of the farmers decrease.
Wholesalers involved in additional numbers of other marketing channels next to the producers and thus supplied more amounts only through local collectors and obtained the upper GMM at channel III (13.9%) and therefore the lower at channel V (7.4%). Exporters obtained equal GMM at channel IV and V (23.5%). Retailers were among the most value chain actors that distribute sesame grain to the last word consumers at different price index and received the very best and lowest GMM at channel II (20%) and III (6.1%) respectively.
The results from calculations of profit and marketing margins of actors within the sesame value chain within the study area showed that producers, retailers and exporters received the very best margin of profit. This means that producers and exporters involved within the sesame value chain can make a reasonable profit on their sales as long as they're able to reduce overhead costs like labor cost. Moreover, the gross marking margin of exporters is highest within the chain followed by producers and retailers.
Value chain actors and their roles
There are various actors in the sesame value chain. These include producers, small traders (collecting middleman), wholesalers/brokers, oil millers, retailers, local consumers, and exporters. They can be those that are directly involved in the value chain or indirect actors who provide financial or non-financial support services.
Input suppliers: Input suppliers are those including private input suppliers, seed producers, primary cooperatives and research centers that supply essential agricultural inputs such as seed, fertilizers, farm tools, credit and training to the small scale farmers to increase the production and productivity of sesame.
Producers: Producers are those small scale farmers who receive input from input suppliers, plow their farm properly, sow seed, weed their farm, harvest, thresh and sell their product to retailers, local collectors and wholesalers.
Local collators: Are small scale trading individuals, who collect the product directly from small scale farmers and resell to wholesalers. They act as a middleman between producers and wholesalers who do not add value to the product. This includes farmer’s cooperatives and unions who involved in sesame collection.
Wholesalers: Wholesalers are larger suppliers who have better capacities in terms of finance and other facilities. They resell the sesame seeds to exporters and processors.
Retailers: Retailers buy the final products produced from sesame like oil and distribute to the customers or final consumers. They are registered officially for a certain line of products.
Exporters: Exporters are business professionals who prepare and manage the shipment of sesame products produced domestically to other countries. In most cases, an exporter work with the buyer to process the order, then schedules the shipment and ensures that all the relevant paperwork associated with the process is properly filled.
Processors: Processors are those who participate in the cleaning, sorting, hulling and extraction of oil and other byproducts from sesame.
Consumers: Consumers are the final or end-users of the sesame product in the form of oil (Figure 3).

Figure 3: Map of the sesame value chain.
Marketing destinations of sesame
Sesame in Ethiopia is grown mainly for the export market [14]. Salamago and Bena-Tsemay districts are the main sesame producing areas in South Omo zone. At the point of production sesame were collected by local collectors and transported to Jinka tawon, then traders transport from Jinka to Addis Ababa ECX warehouse. Currently, China is the largest import market for Ethiopia’s sesame followed by Israel, Turkey and Jordan in 2011, respectively (Ethiopia Revenue and Custom Authority, 2012) [15], and some of the sesame seed processed at Addis Ababa in domestic industries. At the point of production small amount of sesame were also sold at local markets to consumers, who locally consume in different forms (Figure 4).

Figure 4: Market distinations of sesame in south omo zone.
Access to market and other services
Access to market information: Market information is crucial to reducing information gap and uncertainties that exist in the agricultural sector. It's required by producers in their planning of production and way of marketing the product. Of the total respondents, 80% of the sample respondents do not have market information and only 20% of sample respondents get market information from their neighbors, by visiting the market, and from local traders. As indicated the majority of sample respondents in the study area have no market information. This has resulted in the low bargaining position of farmers due to a lack of adequate market information. Sesame being an export commodity requires the dissemination of market information on regular bases.
Access to extension service: Access to agricultural extension services is expected to have a direct influence on the production and marketing behavior of the farmers. The higher access to extension service, the more likely that farmers adopt new technology and innovation. This study indicates that out of the total respondents of sesame producing sample households, about 27.5% of sesame producers had access to extension services provided by development agents of the kebele. The remaining 72.5% of sesame producing sample households responded that they did not receive any extension services from development agents.
Access to credit: Access to credit is one way of improving small-holder farmer’s production and productivity. Farmers’ ability to purchase inputs such as improved seed and fertilizer is tied with access to credit. Farmers with access to credit can minimize their financial constraints and buy inputs more readily than those with no access to credit. Thus, it is expected that access to credit increases the production of crops in general and sesame in particular. Farmers access to credit from formal institutions (banks, MFI, and cooperatives) and informal sources (Iqub, trader friends, relatives, and money lenders). Government institutions and NGOs also provide credit to farmers. This study shows that only 17.5% of sesame producing farmers reported that they had access to credit while the remaining majority (82.5% of sesame producing sample respondents) reported that they had no access to input credit that can be used to buy improved seeds and fertilizer. According to the sample respondent’s response, access to credit is influenced by a lack of awareness creation and a negative attitude of farmers for credit access (Table 7).
| Attributes | Access to credit | Access to extension service | Access to market information | |||
|---|---|---|---|---|---|---|
| Frequency | % | Frequency | % | Frequency | % | |
| Yes | 21 | 17.5 | 33 | 27.5 | 24 | 20 |
| No | 99 | 82.5 | 87 | 72.5 | 96 | 80 |
Table 7: Access to market information, credit and extension service.
Transportation and access road: Ethiopia has a good main road infrastructure, although with 21 to 31 km/100,000 ha the road density is quite low considering the African average of 50 km/100,000 hectare [15]. However, in the study area a little investment is made to improve further the road infrastructures (Table 8).
| Variables | Mean | Std. Dev |
|---|---|---|
| Distance to main road (in hours) | 2.28 | 2.69 |
| Distance of your residence to the nearest market (in hours) | 2.5 | 2.93 |
| Distance of your residence to the nearest development center( in hours) | 2.67 | 2.95 |
Table 8: Transportation and main road infrastructure.
The mean distance in hours from the producing area to the main road, to the nearest market, to the nearest development center is 2.28 hours, 2.50 hours and 2.67 hours respectively with corresponding standard deviation 2.69 hours, 2.93 hours, and 2.95 hours respectively. (Figure 5)

Figure 5: Means of sesame transportation.

According to the survey 56.7% of total sample respond that the transport of sesame from the producing area to the nearest market and woreda market of the zone, is mainly done by head/loading, 40% respond that they transport by pack animal whereas 0.8% by vehicle and 2.5% by others.
Barriers to entry: The commonly known barriers to entry in the market in the study area are lack of capital, licensing and lack of access to road. From the respondents of sesame traders, the traders residing in the town have grain trade license whereas the farmer traders, who reside in rural markets had no grain trade license. According to the survey result 77.5% of the sample traders indicated that lack of capital is one of the major constraints to enter trading. Lack of access to credit has been the single most constraint in startup. More over lack of access to road is the main problem of the traders, which needs series attention.
Major challenges and opportunities in sesame production and marketing
Major challenges in sesame production and marketing: The major challenges in sesame production and marketing are identified as follows in the study area. Pests and disease during production, drought, and shortage of rainfall, low productivity, flood, lack of improved seed or Low level of improved input utilization, shortage of input supply, high price of inputs, shortage of labor force, unexpected rain during harvest, buyers come only during harvest, the need for cash during harvest, price declines later, fear of weight loss if stored, fear of color change if stored, thefts, storage pests, high post-harvest loss, lack of information on quality standard, poor soil fertility, problem of weed, ethnic conflicts, crop price failures, price fluctuation, shortage of capital, lack of loan service, lack of updated market information, unexpected rainfall during harvest, highly dependent on rainfall, insufficient or limited rural roads and transports , limited modern market centers and insufficient postharvest technologies are the major problems faced by producer households in sesame production and marketing in the study area.
Pests, weight loss, unexpected rainfall, and mildew are the major storage problems and careless and bureaucracy of credit providing organizations are another problems in sesame production and marketing and training on farming system, Training on awareness creation, shortage of supply of agricultural input and weak extension service are also some of the problems faced in sesame production and marketing. Besides this, lack of advanced value addition technologies and lack of awareness and skill of value auditing activities are some of the problems related to sesame value addition.
Major opportunities in sesame production and marketing: In the study area the better opportunities for producers were availability of land, easy to grow and harvest, women can participate, expecting good quality seed, reduce use of chemical fertilizers, organic input utilization, accessible local and export market, high potential for value addition and low cost of production and easy to transport whereas for traders or local collectors were availability of the production and better supply and market potential for domestic and export. Sesame is the most important oil seed export crop in Ethiopia and its contribution to foreign exchange earnings in the country has been increasing over the years. High demand for the product, market potential for exports and more value-added potential are better opportunities for sesame Exporters and high demand for processed products and employments, High demand for quality oil is better opportunities for sesame processor.
Results from value chain analysis approach showed that input suppliers, sesame producers, local collectors, retailers, wholesalers and consumers were the main sesame value chain actors identified in the study area. These actors play different roles in the value chain. Producers had different alternative marketing channels and disproportional flow of costs and benefits was observed. Among alternative marketing channels TGMM was highest in (34.85%) of the consumers’ price when farmers’ sesame grain passes via middlemen’s to exporters.
On the other hand producers’ Gross Marketing Margin (GMM) was highest (80%) in channel II and III without considering channel I that producers directly sold to the ultimate consumers and received the whole channel portion and lowest at channel IV and V (65.15%). In traders’ stream, the highest Net Marketing Margin (NMM) was received by urban Exporters at channels IV and V (23.5%) followed by Retailers at channel II (20%) and the poorest at channel II and III. the main barrier to entry traders into the market is the capital requirement and the wholesalers govern by volume transacted and quality control criteria in the market. Production and marketing opportunities were identified include conducive environment, fertile land and reduce use of chemical fertilizers as well as presence of potential sesame producers and suppliers in the study area, high demand for the product, market potential for exports and more value-added potential were the basic opportunity for traders business in the value chain. Pests and disease during production, shortage of rainfall, low productivity, low level of improved input utilization, shortage of input supply and high price of inputs were the main challenges of producers and suppliers whereas lack of market information, price variability, delay of buyers, low bargaining power, weight loss and poor product quality were the main challenges sesame marketing.
Citation: Kusse K, Ermias G, Darcho D (2022) Value Chain Analysis of Sesame (Sesame Indicum) in South Omo Zone, Southern Ethiopia. J Agri Sci Food Res. 13:501.
Received: 16-Apr-2020, Manuscript No. JBFBP-21-006-Pre-QC-22; Editor assigned: 20-Apr-2020, Pre QC No. JBFBP-21-006-Pre-QC-22 (PQ); Reviewed: 25-Jun-2020, QC No. JBFBP-21-006-Pre-QC-22; Revised: 19-May-2022, Manuscript No. JBFBP-21-006-Pre-QC-22 (R); Published: 01-Aug-2022 , DOI: 10.35248/2593-9173.22.13.502
Copyright: © 2022 Kusse K, et al. This is an open-access article distributed under the terms of the Creative Commons Attribution License, which permits unrestricted use, distribution, and reproduction in any medium, provided the original author and source are credited.