Journal of Hematology & Thromboembolic Diseases
Open Access
ISSN: 2329-8790
ISSN: 2329-8790
Research Article - (2014) Volume 2, Issue 6
Introduction: The Hepatitis B virus (HBV) is very common, and has been difficult to treat, mainly because of the high mutation rate of the polymerase gene of its reverse transcriptase. The aim of our study was to use Bayesian statistics to determine the positions of mutations within the HBV genome.
Material and methods: The sequence data was derived from 73-treatment naïve and 215 treatment failures, of various drugs, from patient data provided by collaborators at the University of Tor Vergata. The Metropolis-Hastings algorithm was applied to the data to determine the mutation locations that correlate with drug resistance.
Results: For amino acid positions 80-250, nineteen positions were shown to have mutated in the treatment failure group. Fifteen of the nineteen positions were in the D genotype of HBV, while the other four were within the A genotype originating from the drug lamivudine (LMV). For amino acid positions 250-344, sixteen positions were mutated with seven of the sixteen originating from LMV in the D genotype. Four mutations originated from LMV in the A genotype.
Conclusion: This research identified previously unknown mutation positions and confirmed positions identified in previous research. Collaborators at the University of Rome, Tor Vergata, have validated the mutated positions experimentally with a 454-pyrosequencer. It is hoped that knowledge of these mutations would lead to improved treatment options. Also, with increased availability of genomic data, future research can be done on a larger HBV dataset and for other diseases.
Keywords: Hepatitis B virus (HBV); Drug resistance; Bayesian analysis; Metropolis-Hastings algorithm; Mutation identification; Markov chain; Posterior probability
The Hepatitis B virus (HBV) is fairly common, infecting more than 2 billion people worldwide, including over 300 million carriers of the virus [1]. It is passed through the blood/blood-derived body fluids through percutaneous and permucosal means [2]. This virus can cause chronic infection, and, along with HCV, is the major causative factor for liver transplants.
The liver is vital to life, with over 500 diverse physiological functions including bile production, nutrient metabolism, drug processing, ammonia conversion, and coagulation factor creation [3]. Therefore, it is important that scientists identify and resolve causes of liver disease.
HBV is a circular DNA virus that is partially double stranded. It replicates via an RNA intermediate, and, like HIV, contains a reverse-transcriptase (RT) enzyme [4] (Figure 1).
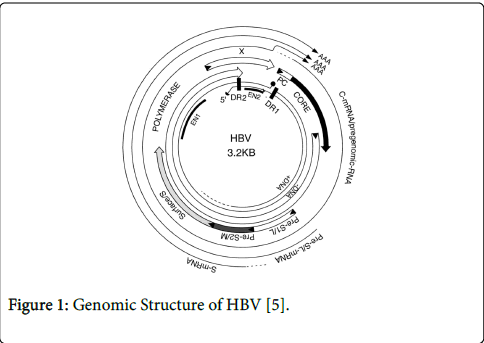
Figure 1: Genomic Structure of HBV [5].
The Hepatitis B virus is divided into eight genotypes, A-H, based on overall sequence variation of the genome. In this analysis, only sequence data from genotypes A and D were used.
Like HIV, HBV has proven to be difficult to treat, mainly because of the high mutation rate of the polymerase gene of its reverse transcriptase [6]. Previous work by Zhang et al employed Bayesian statistics to determine the positions of mutations in the HIV genotype [7]. Whereas HIV mutates at a much faster rate than HBV, the same statistical method was successfully employed here.
Prior studies undertaken by Zhixiang Lin, employed this method to analyze HCV data from a publicly available HCV database, and Hepatitis B virus sequences from an HBVrt database at Stanford University. These studies have proved helpful in identifying positions of mutations that confer general drug resistance. However, those studies did not look at mutations corresponding to particular drugs.
This study was conducted with sequence data on 73-treatment naïve and 215 treatment failures, of various drugs, from patient data collected by collaborators at the University of Tor Vergata. The sequence data were provided as fasta files for treatment naïve sets and treatment failures. They were then compiled and summarized in Excel sheets before processing in the R statistical package.
The Metropolis-Hastings algorithm was applied to sequence data to determine the mutation locations that correlate with drug resistance. This algorithm employs Bayesian statistics and Markov modeling to test each sequence position for four hypotheses:
H1: the corresponding treated and untreated positions are independent from each other, and have the same probability distribution
H2: the corresponding treated and untreated positions are independent from each other, but have different probability distributions
H3: the corresponding treated and untreated positions are dependent on each other, and have the same probability distribution
H4: the corresponding treated and untreated positions are dependent on each other, but have different probability distributions
The positions corresponding to hypothesis 4 with a 95% threshold cut-off were later collected.
The patients were segregated into groups based on the viral genotype (A or D) and the combinations of drugs used for treatment, namely ADF, ETV, LMV, Peg-IFN, TBV, and TDF [8].
ADF: adefovir dipivoxil (Hepsera)
ETV: entecavir (Baraclude)
LMV: lamivudine (Epivir)
Peg-IFN: pegylated interferon
TBV: telbivudine (Tyzeka)
TDF: tenofivir (Viread)
Of all the combinations used on patients, only those samples with more than 20 elements were included in this analysis. These groups were:
ADF treatment failures of genotype D
ADF&LMV treatment failures of genotype D
ETV treatment failures of genotype D
LMV treatment failures of genotype D
LMV treatment failures of genotype A
Most of the data came from patients with the HBV D genotype, which is the prevailing genotype of Western regions [9].
The DNA sequences were then transcribed and translated, with the resulting peptide sequences split into sections from 80-250 and from 250-344. Using a program developed in R, these sections were analyzed for hypotheses 1-4 against the corresponding lengths of the treatment naïve data.
Ten Markov chains were simulated with 20,000 iterations. The burn-in was set to 5,000 and the program chose the Markov chain with the highest probability to create the following charts.
Figure 2 shows the optimal Markov chain posterior probabilities for positions 80-250 of ADF-treatment failures of the D genotype. Positions making the 95% threshold cut-off for H4 were 34, 71, 76, and 117.
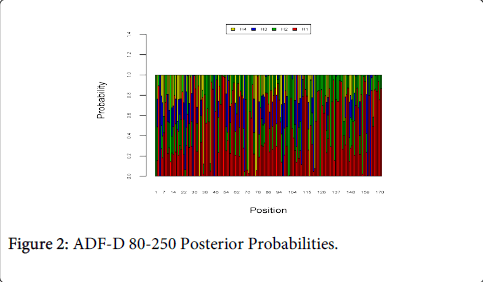
Figure 2: ADF-D 80-250 Posterior Probabilities.
Figure 3 shows the optimal Markov chain posterior probabilities for positions 80-250 of ADF/LMV-treatment failures of the D genotype. Positions making the 95% threshold cut-off for H4 were 23, 37, 68, and 76.
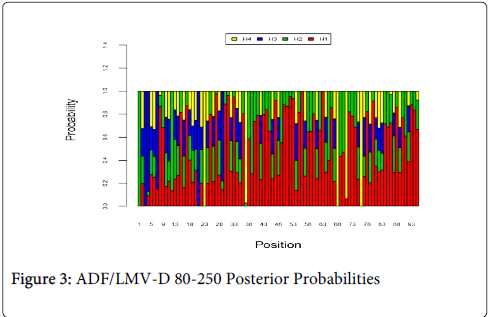
Figure 3: ADF/LMV-D 80-250 Posterior Probabilities
Figure 4 shows the optimal Markov chain posterior probabilities for positions 80-250 of ETV-treatment failures of the D genotype. Positions making the 95% threshold cut-off for H4 were 1, 3, 21, 134, and 168.
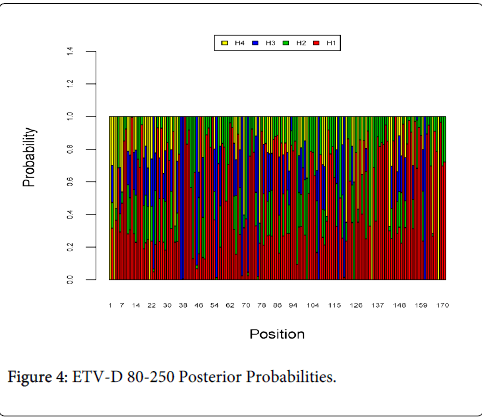
Figure 4: ETV-D 80-250 Posterior Probabilities.
Figure 5 shows the optimal Markov chain posterior probabilities for positions 80-250 of LMV-treatment failures of the A genotype. Positions making the 95% threshold cut-off for H4 were 43, 45, 50, and 84.
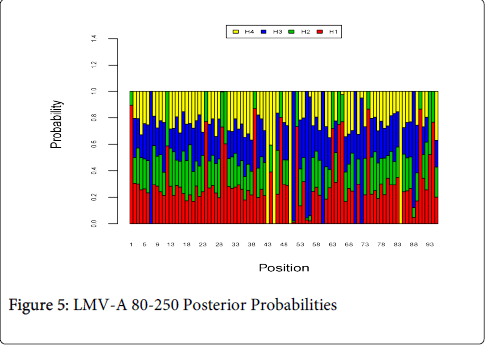
Figure 5: LMV-A 80-250 Posterior Probabilities
Figure 6 shows the optimal Markov chain posterior probabilities for positions 80-250 of LMV-treatment failures of the D genotype. Positions making the 95% threshold cut-off for H4 were 101 and 125.
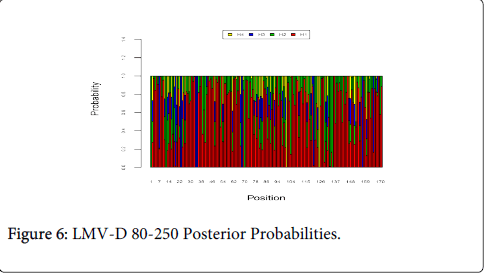
Figure 6: LMV-D 80-250 Posterior Probabilities.
Figure 7 shows the optimal Markov chain posterior probabilities for positions 250-344 of ADF-treatment failures of the D genotype. Positions making the 95% threshold cut-off for H4 were 49 and 62.

Figure 7: ADF-D 250-344 Posterior Probabilities.
Figure 8 shows the optimal Markov chain posterior probabilities for positions 250-344 of ADF/LMV-treatment failures of the D genotype. The only position making the 95% threshold cut-off for H4 was 40.
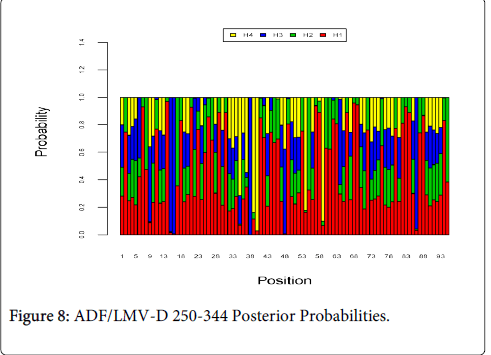
Figure 8: ADF/LMV-D 250-344 Posterior Probabilities.
Figure 9 shows the optimal Markov chain posterior probabilities for positions 250-344 of ETV-treatment failures of the D genotype. Positions making the 95% threshold cut-off for H4 were 16, and 38.
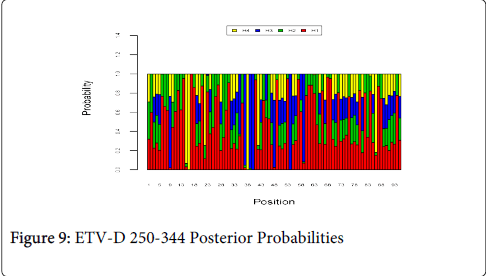
Figure 9: ETV-D 250-344 Posterior Probabilities
Figure 10 shows the optimal Markov chain posterior probabilities for positions 250-344 of LMV-treatment failures of the A genotype. Positions making the 95% threshold cut-off for H4 were 7, 8, 22, and 68.
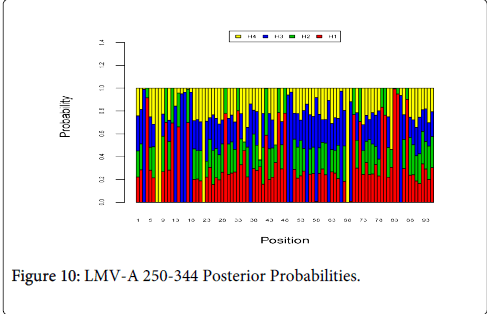
Figure 10: LMV-A 250-344 Posterior Probabilities.
Figure 11 shows the optimal Markov chain posterior probabilities for positions 250-344 of LMV-treatment failures of the D genotype. Positions making the 95% threshold cut-off for H4 were 10, 34, 36, 39, 54, 59, and 70.
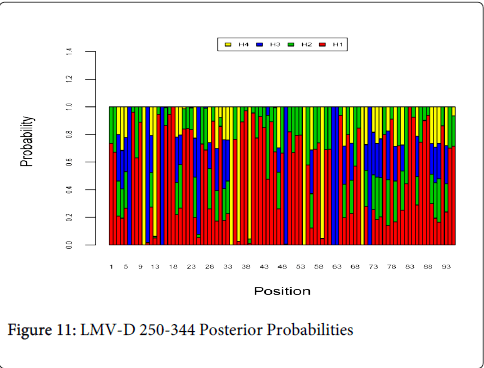
Figure 11: LMV-D 250-344 Posterior Probabilities
The following Table 1 summarizes the results corresponding to the 95% threshold cut-off for positions 80-250.
| Group | Positions |
| ADF-D | 34, 71, 76, 117 |
| ADF/LMV-D | 23, 37, 68, 76 |
| ETV-D | 1, 3, 21, 134, 168 |
| LMV-A | 43, 45, 50, 84 |
| LMV-D | 101, 125 |
Table 1: H4 Positions for Sequence Segments 80-250
The following Table 2 summarizes the results corresponding to the 95% threshold cut-off for positions 250-344.
| Group | Positions |
| ADF-D | 49, 62 |
| ADF/LMV-D | 40 |
| ETV-D | 16, 38 |
| LMV-A | 7, 8, 22, 68 |
| LMV-D | 10,34, 36, 39,54,59,70 |
Table 2: H4 Positions for Sequence Segments 250-344
As proteins serve as the workhorse for cells, single amino acid changes can be devastating. Differences in hydrophobicity and binding properties can lead to dysfunctional aggregation-prone structures. However, in viruses, such changes may confer drug resistance and therefore be selected for. The rtM204V/I mutations are well-established markers for LAM resistance, while rtN236T and rtA181V are thought to be responsible for ADV resistance [6].
Previous research using Bayesian modeling looked at all mutations without segregating them by drug treatments. This study segregated a sample into treatment failures with different drug combinations in order to find specific mutation points that correlate with resistance for each drug.
For Figures 2-11 and the Tables, amino acid changes were studied instead of individual nucleotide changes. Working with peptide sequences, instead of genomic sequences, was advantageous for three main reasons. Firstly, it allowed each graph to convey more information. Secondly, it circumvented the issue of analyzing the un-translated region of the HBV genome, and thirdly, it ensured that it filtered out less important synonymous mutations. But while this put the focus on non-synonymous and non-silent mutations, it is possible that this process may have overlooked seemingly unimportant silent and synonymous mutations that may influence the development of drug resistance.
Another limitation of this study is that some amino acid positions were not identifiable and were denoted with an X. Sequences with missing values were still included in the overall analysis. However, it is hoped that additional experiments with a newly acquired 454 pyrosequencer will analyze full-length HBV sequences. Future research would also employ this Bayesian selection tool on a larger pool of HBV data.
It is hoped that this information can be used in targeting the identified locations to improve patient treatment and drug design. With increased availability of genomic data, the Bayesian method used here may even be employed with other viruses or diseases to identify other regions of interest.