Journal of Thermodynamics & Catalysis
Open Access
ISSN: 2157-7544
ISSN: 2157-7544
Research Article - (2015) Volume 6, Issue 3
Thermodynamic modeling of surface tension of different electrolyte systems in presence of gas phase is studied. Using the solid-liquid equilibrium, Langmuir gas-solid adsorption and ENRTL activity coefficient model, the surface tension of electrolyte solutions are calculated. The new model has two adjustable parameters which could be determined by fitting the experimental surface tension of binary aqueous electrolyte solution in single temperature. Then the values of surface tension for other temperature in binary and ternary system of aqueous electrolyte solution are predicted. The average absolute deviations for calculation of surface tension of binary and mixed electrolyte systems by new model are 1.98 and 1.70%, respectively.
Keywords: Surface tension; Aqueous solution; Langmuir adsorption; E-NRTL activity model
For studying the aqueous electrolyte solution in porous media, distillation, extraction process and liquid-liquid dispersion, the calculation of surface tension of aqueous solutions is required [1]. So, different equations have been developed to calculate surface tension of mineral salts. Ariyama [2], Lorenz [3], Young and Grinstead [4], and Glejm and Shelomov [5] formulated useful equations as group contribution method for calculation of surface tension of some limited binary electrolyte-water systems. Oka [6] proposed an equation for calculation of surface tension based on the concentration of solution, electronic charge, dielectric constant of water, ionic charge and Avogadro’s constant. Later Hovarth [7] developed this equation by introducing the ionic strength and degree of dissociation into the Oka’s model [6]. Onsager and Samaras [8], obtained a relation based on the temperature, dielectric constant of water and concentration of solution for calculation of surface tension of electrolyte solution. Schmutzer [9],considered the osmotic coefficient as an important factor for calculation of surface tension of electrolyte solution. Adding a proportional factor of anion concentration to the surface tension of water, the surface tension of aqueous electrolyte solution was determined by Abramazon and Gaukhberg [10]. This parameter was considered as a function of the inverse of square of ionic radius and anion charge. Li et al. [1] developed a new model for calculation of surface tension of single and mixed electrolyte solution. In this model, the surface layer is considered as a distinct phase where the electrolytes could be entered into it from another phases. The surface tension was obtained using the proportion of molality of salt in surface layer to liquid bulk phase. While this model had satisfactory results in low concentration of electrolytes, in high concentration the calculated surface tensions were not in good agreement with experimental data. Yu et al. [11] combined Li et al. [1] model with modified mean spherical approximation (MSA) as osmotic coefficient model. The results showed that the calculated surface tensions in highly concentrated regions were improved. Furthermore, the Langmuir gas-solid adsorption model was used at equilibrium condition for calculation of surface tension of mineral salts by Li and Lu [12]. The results indicated the satisfactory agreement with experimental data. Sadeghiet al. [13] used the combination of MSA model [14] with the Ghotbi and Vera [15] and the Mansoori et al. [16] equations of state, for correlation of the surface tension of single aqueous solution. Also the surface tensions of different mixed aqueous solutions were predicted by this approach. The results indicate the satisfactory agreement between calculated and experimental data [13]. In this paper, a new model for calculation of surface tension of the electrolyte systems is developed using the Langmuir adsorption equation and E-NRTL [17] model. The adjustable parameters of this model are obtained by experimental data of surface tension at single temperature. Then the model is verified by prediction of surface tension of 65 binary electrolyte-water systems and 17 ternary electrolyte systems.
For calculation of surface tension of electrolyte system, the aqueous electrolyte solution-vapor system is supposed as three different phases: bulk vapor phase, surface phase and bulk liquid phase (Figure 1). The surface phase is considered as distinct layer for adsorption of electrolyte from liquid phase. In this system, the chemical potential of water in liquid bulk phase and surface would be defined as below [1],
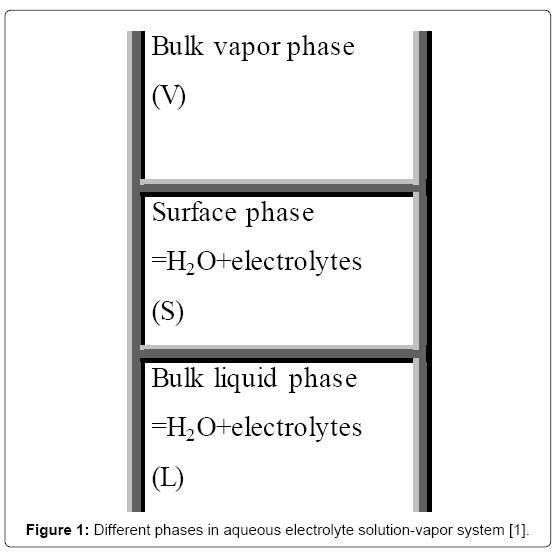
Figure 1: Different phases in aqueous electrolyte solution-vapor system [1].
 (1)
(1)
 (2)
(2)
Where μ, a,  emical potential, activity, partial molar area andand σsol represent the chemical potential, activity, partial molar area and surface tension of solution. The subscripts w, L, S, L0 and S0 refer to water, liquid phase, surface phase, reference state of liquid phase and reference state of surface phase, respectively.
At equilibrium condition, the chemical potential of water in surface and liquid phase are equal. So we have,
 (3)
(3)
Rewriting above equation for pure water, it yields the following equation,
 (4)
(4)
It would be worth to noting that the activity of pure water is unity and the partial molar area for pure water is equal to the molar area.
Substituting the above equation into the equation (3), it results to below equation,
 (5)
(5)
It is assumed that in the above equation the partial molar area and molar area of water are equal. The molar area of water is calculated by ref. [18],
 (6)
(6)
whereVw and NA are molar volume of water and Avogadro number.
Using the osmotic definition (φ ) instead of activity of water the equation (5) converts to the following equation,
 (7)
(7)
Where m is molality of electrolyte in aqueous solution and v is stoichiometric coefficient. For calculation of the molality of electrolyte in surface phase (mS), the fraction of adsorbed electrolyte (θ) on the interface between vapor and liquid phases could be related to the excess area (Γ) as [12],
 (8)
(8)
Where superscript 0 means saturated condition.On the other hand, the excess area is defined as moles of electrolyte in surface per area of surface [19]. So,
 (9)
(9)
Where in the above equation, n is mole number and superscript S indicates the surface phase. The saturated molality of surface phase is considered as fraction of molality of liquid bulk phase, or
 (10)
(10)
where L is liquid bulk phase and K0 is a constant.
Using the Langmuir gas-solid adsorption [20] and equality of adsorption and desorption rate for an electrolyte in surface phase [21], the adsorbed fraction of electrolyte on the surface phase is obtained as [12],
 (11)
(11)
Combining equations 7-9, the molality of electrolyte in surface phase would be obtained as,
 (12)
(12)
Where K*=K0K.
So, substituting equation (12) into the equation (7), the surface tension of pure aqueous electrolyte solution is calculated. It is mentioned that, the two adjustable parameters K*and K are obtained from fitting the experimental surface tension data to the calculated values (equation 7) at single temperature.
For mixed electrolyte solution the surface tension would be calculated by following equation,
 (13)
(13)
Assuming competitive adsorption between electrolytes in surface phase [12], the molality of surface phase is,
 (14)
(14)
For studying the surface tension of electrolyte solution, 65 binary electrolyte systems and 17 ternary electrolyte systems are selected. The surface tension of these electrolyte solutions are obtained by competitive adsorption model (Eq. 7 or 13). In this model, for calculation of osmotic and activity coefficients, E-NRTL [17] model is used. Using the regression of model with experimental surface tension of binary electrolyte-water system, the adjustable parameters of competitive adsorption model (K*, K)are optimized. The objective function is defined as following,
 (15)
(15)
Where, AAD, Np, superscripts cal and exp are average absolute deviation, number of data points, calculated and experimental data of surface tension, respectively. The results for different binary electrolyte system are given in Table 1. As it is shown in Table 1, when the first adjustable parameter (K*), tends to zero or small positive value or the second adjustable parameter (K), becomes a large number, the molality of electrolyte system in surface phase closes to zero. Moreover, when K*is lower than unity and the K is not moderately large number, the molality of electrolyte in surface phase decreases with respect to the liquid bulk phase. In these cases, which point out to the mineral salts, the rate of adsorption in surface layer would lower than desorption rate and surface tension of electrolyte solution is increased with respect to the surface tension of water. Strong inorganic acids, organic acetates and propionates which have high vapor pressure, attend to escape from liquid phase to surface phase and consequently the concentration of these components in surface phase would be greater than liquid phase [11]. For these electrolytes, the first adjustable parameter is higher than unity and so the molality of electrolyte in surface phase becomes greater than the liquid bulk phase and consequently the surface tension of aqueous electrolyte solution increases with respect to the liquid bulk phase. For other temperatures, the value of surface tension of electrolyte aqueous solution is predicted and the results are given in Table 2. Using the competitive adsorption model, the experimental and predicted values of surface tension of aqueous binary electrolyte system are illustrated in Figures 2-8. These figures indicate the agreement between predicted and experimental values of surface tension values for AgNO3, BaCl2,CaCl2, KBr, HNO3, NaCl and UO2SO4 using E-NRTL [17] model. For ternary systems, the surface tension of the aqueous solutions is predicted in vast range of temperatures and molalities.The values of AAD for prediction of surface tension of 16 ternary systems by competitive adsorption model are shown in Table 3. The overall AAD for prediction of surface tension of mixed electrolyte solutions is 1.7%. The predicted values of surface tension of NH4NO3- KNO3-water, KBr-KCl-water and NH4Cl- (NH4)2SO4-water systems by new surface tension model and experimental values are illustrated in Figures 9-11, respectively. The agreement between predicted and experimental values in these figures represents the satisfactory results of the competitive adsorption model.
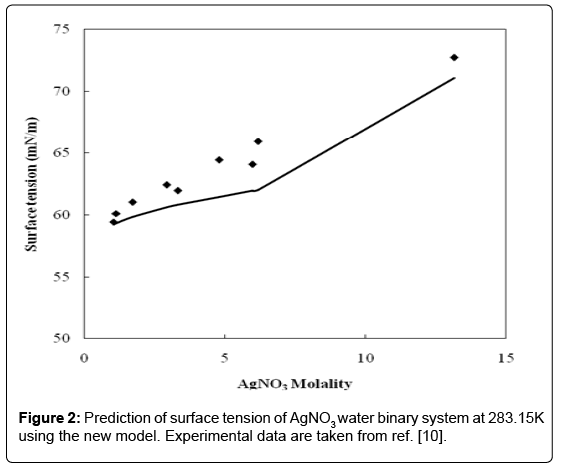
Figure 2: Prediction of surface tension of AgNO3 water binary system at 283.15K using the new model. Experimental data are taken from ref. [10].
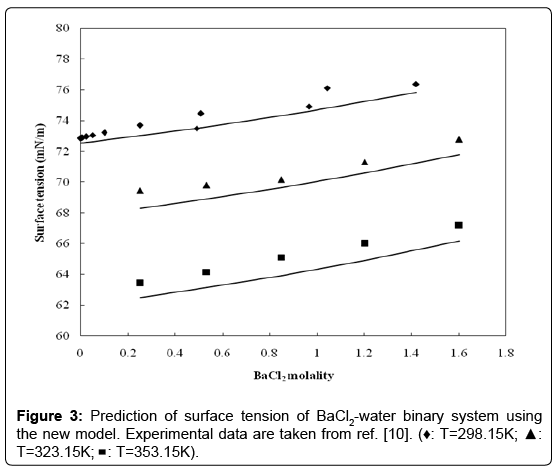
Figure 3: Prediction of surface tension of BaCl2-water binary system using the new model. Experimental data are taken from ref. [10]. (♦: T=298.15K; ▲: T=323.15K; ▄ : T=353.15K).
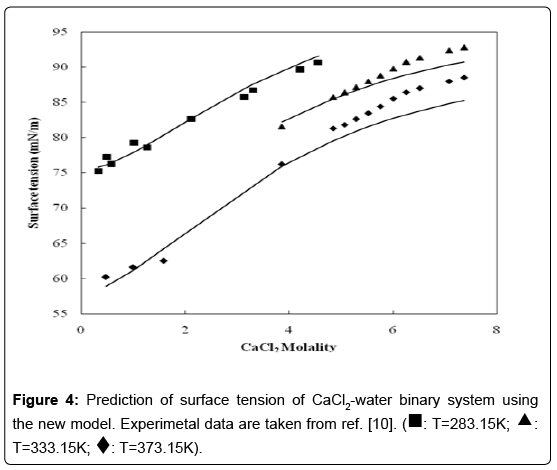
Figure 4: Prediction of surface tension of CaCl2-water binary system using the new model. Experimetal data are taken from ref. [10]. (◼: T=283.15K; ▲: T=333.15K; ♦: T=373.15K).
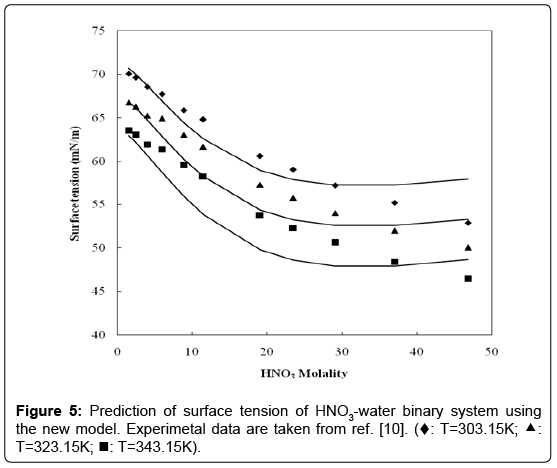
Figure 5: Prediction of surface tension of HNO3-water binary system using the new model. Experimetal data are taken from ref. [10]. (♦: T=303.15K; ▲: T=323.15K; ◼: T=343.15K).
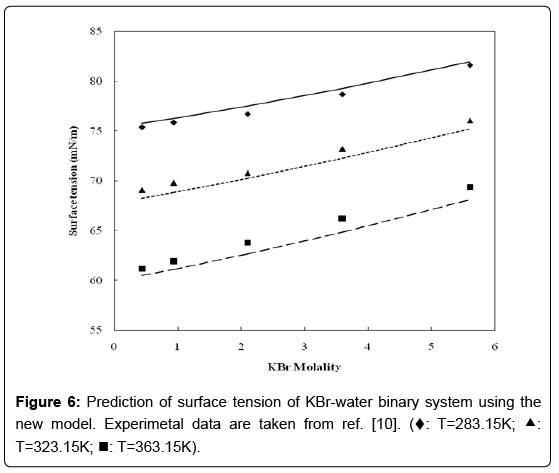
Figure 6: Prediction of surface tension of KBr-water binary system using the new model. Experimetal data are taken from ref. [10]. (♦: T=283.15K; ▲: T=323.15K; ◼: T=363.15K).
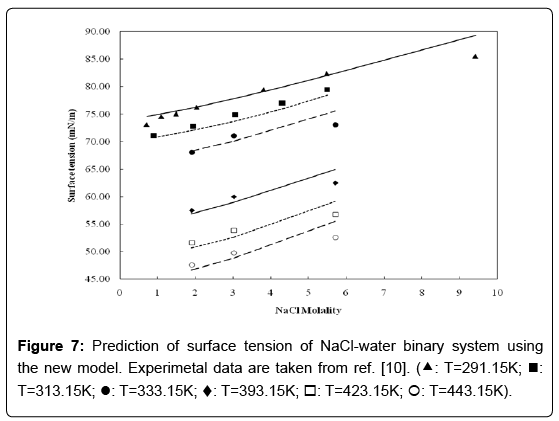
Figure 7: Prediction of surface tension of NaCl-water binary system using the new model. Experimetal data are taken from ref. [10]. (▲: T=291.15K; ◼: T=313.15K; ⚫: T=333.15K; ♦: T=393.15K; □: T=423.15K; ⚪: T=443.15K).
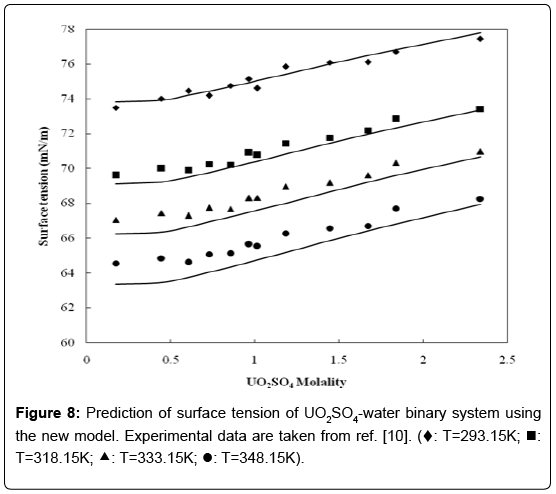
Figure 8: Prediction of surface tension of UO2SO4-water binary system using the new model. Experimental data are taken from ref. [10]. (♦: T=293.15K; ◼: T=318.15K; ▲: T=333.15K; ⚫: T=348.15K).
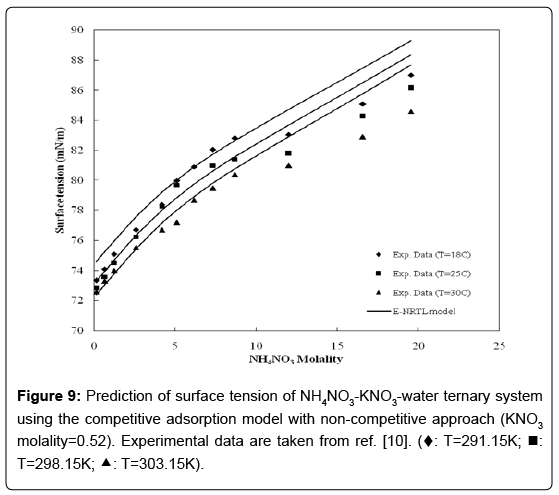
Figure 9: Prediction of surface tension of NH4NO3-KNO3-water ternary system using the competitive adsorption model with non-competitive approach (KNO3 molality=0.52). Experimental data are taken from ref. [10]. (♦: T=291.15K; ◼: T=298.15K; ▲: T=303.15K).
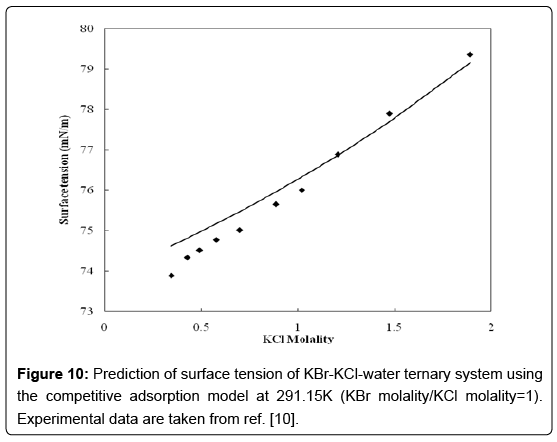
Figure 10: Prediction of surface tension of KBr-KCl-water ternary system using the competitive adsorption model at 291.15K (KBr molality/KCl molality=1). Experimental data are taken from ref. [10].
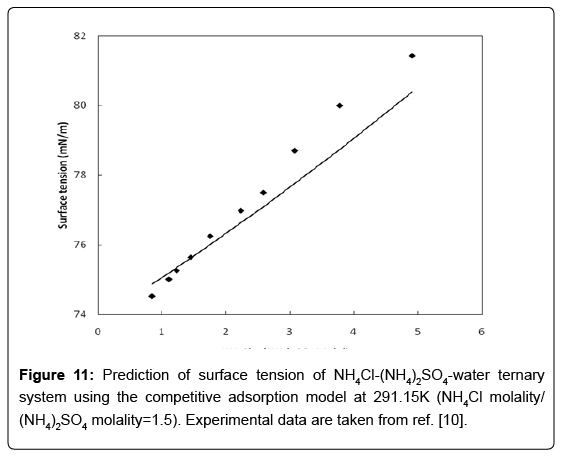
Figure 11: Prediction of surface tension of NH4Cl-(NH4)2SO4-water ternary system using the competitive adsorption model at 291.15K (NH4Cl molality/ (NH4)2SO4 molality=1.5). Experimental data are taken from ref. [10].
| System | T(°C) | Np | K* | K | AAD% |
|---|---|---|---|---|---|
| AgNO3 | 20 | 4 | 6.99×10⁻² | 6.16×10¹⁴ | 0.23 |
| Al2(SO4)3 | 30 | 12 | 8.95×10⁻¹ | 3.93×10²² | 0.46 |
| BaCl2 | 30 | 5 | 0 | 4.53×10⁴ | 0.61 |
| CaCl2 | 30 | 11 | 6.60×10⁻¹ | 4.27×10⁴ | 0.81 |
| CdCl2 | 20 | 5 | 7.34×10⁻¹ | 2.19×101 | 0.08 |
| CdSO4 | 20 | 2 | 7.47×10⁻¹ | 3.62×10⁻² | 9.15×10⁻⁷ |
| CoCl2 | 20 | 2 | 6.20×10⁻¹ | 7.51×10⁻⁵ | 1.05×10⁻⁴ |
| CsCl | 25 | 15 | 1.30×10⁻¹ | 1.65×10¹⁶ | 0.43 |
| CsI | 25 | 11 | 1.91×10⁻⁶ | 1.91×10⁻⁶ | 0.45 |
| CuSO4 | 30 | 3 | 7.83×10⁻¹ | 5.64×10¹⁴ | 0.22 |
| HBr | 18 | 2 | 1.09×100 | 1.86×10¹⁶ | 0.07 |
| HCl | 20 | 7 | 1.05×100 | 1.53×101 | 0.94 |
| HClO4 | 25 | 10 | 1.06×100 | 2.86×10¹⁴ | 2.13 |
| HNO3 | 20 | 7 | 1.42×100 | 6.03×10¹⁴ | 2.38 |
| KBr | 20 | 5 | 2.36×10⁻¹ | 6.02×10¹⁴ | 0.21 |
| KC2H3O2 | 30 | 3 | 1.14×100 | 9.27×10⁻² | 0.40 |
| KCNS | 25 | 12 | 9.36×10⁻¹ | 4.71×100 | 0.34 |
| KCl | 20 | 10 | 1.07×10⁻¹ | 1.96×10¹⁶ | 0.33 |
| K2CrO4 | 30 | 15 | 2.49×10⁻¹ | 1.14×10¹⁸ | 0.35 |
| K3Fe(CN)6 | 25 | 16 | 1.91×10⁻⁶ | 1.91×10⁻⁶ | 0.67 |
| KI | 25 | 12 | 1.91×10⁻⁶ | 1.91×10⁻⁶ | 3.17 |
| KNO3 | 25 | 6 | 1.66×10⁻¹ | 2.73×10¹⁵ | 0.38 |
| KOH | 20 | 4 | 3.07×10⁻¹ | 8.46×10¹⁵ | 0.35 |
| K2SO4 | 25 | 12 | 1.91×10⁻⁶ | 1.91×10⁻⁶ | 0.72 |
| LiBr | 30 | 4 | 6.40×10⁻¹ | 9.99×10⁻² | 0.34 |
| LiCl | 25 | 7 | 4.70×10⁻¹ | 1.31×101 | 0.61 |
| LiI | 18 | 2 | 6.54×10⁻¹ | 1.31×100 | 2.99×10⁻⁶ |
| LiOH | 20 | 4 | 1.28×10⁻¹ | 5.96×10¹⁴ | 0.40 |
| Li2SO4 | 18 | 2 | 4.36×10⁻¹ | 3.57×10⁻² | 0.15 |
| MgCl2 | 20 | 12 | 7.28×10⁻¹ | 2.50×10⁻¹ | 1.13 |
| MgSO4 | 10 | 12 | 8.31×10⁻¹ | 5.43×10⁻³ | 0.75 |
| MnCl2 | 18 | 6 | 6.44×10⁻¹ | 7.20×10⁻³ | 0.23 |
| NH4Cl | 25 | 6 | 2.90×10⁻¹ | 5.68×10¹⁴ | 0.10 |
| NH4NO3 | 20 | 9 | 5.20×10⁻¹ | 6.42×10⁻² | 0.32 |
| (NH4)2SO4 | 30 | 4 | 5.77×10⁻¹ | 6.08×100 | 0.48 |
| NaBr | 20 | 4 | 4.85×10⁻¹ | 1.77×10⁻² | 0.21 |
| NaCHO2 | 30 | 12 | 3.71×10⁻¹ | 1.86×10¹⁶ | 0.29 |
| NaC2H3O2 | 30 | 12 | 1.12×100 | 2.04×10¹⁶ | 1.04 |
| NaC3H5O2 | 30 | 12 | 1.91×100 | 1.27×10¹⁸ | 0.26 |
| NaC4H7O2 | 30 | 12 | 3.28×100 | 1.94×10¹⁶ | 0.77 |
| NaCl | 20 | 9 | 2.22×10⁻¹ | 2.05×10¹⁶ | 0.66 |
| NaClO3 | 15 | 2 | 1.38×100 | 4.31×10⁻¹ | 0.03 |
| NaClO4 | 25 | 3 | 8.61×10⁻¹ | 2.16×10¹⁶ | 0.17 |
| Na2CrO4 | 30 | 4 | 4.23×10⁻¹ | 1.59×10⁻² | 0.27 |
| NaI | 25 | 8 | 6.15×10⁻¹ | 9.07×10¹⁴ | 0.16 |
| NaNO3 | 20 | 4 | 2.59×10⁻¹ | 1.16×10¹⁵ | 0.21 |
| NaOH | 18 | 6 | 3.47×10⁻¹ | 2.46×10⁻³ | 0.46 |
| Na2SO4 | 30 | 3 | 1.50×10⁻¹ | 5.63×10¹⁷ | 0.22 |
| Na2S2O3 | 40 | 4 | 4.48×10⁻¹ | 9.00×10⁻³ | 0.21 |
| NiSO4 | 15 | 2 | 7.14×10⁻¹ | 8.60×10⁻² | 1.75×10⁻⁷ |
| Pb(NO3)2 | 20 | 3 | 1.91×10⁻⁶ | 1.91×10⁻⁶ | 3.77 |
| RbCl | 25 | 11 | 1.94×10⁻¹ | 9.65×10¹⁵ | 0.36 |
| SrCl2 | 20 | 9 | 5.95×10⁻¹ | 4.41×10⁻³ | 0.49 |
| Sr(NO3)2 | 18 | 8 | 3.39×10⁻¹ | 8.14×10¹⁴ | 0.50 |
| UO2SO4 | 30 | 12 | 8.70×10⁻¹ | 1.23×101 | 0.32 |
| Zn(NO3)2 | 40 | 5 | 7.67×10⁻¹ | 1.27×10⁻¹ | 0.37 |
| Overall | 404 | 0.55 |
Table 1: The optimized values for adjustable parameters ( K*, K) in new model. Experimental data are from ref. [10].
| System | T(°C) | molality | Np | %AAD |
|---|---|---|---|---|
| AgNO3 | 100 | 1.03-13.16 | 10 | 3.81 |
| BaCl2 | 10-80 | 0.01-5.96 | 51 | 1.10 |
| CaCl2 | 10-100 | 0.1-7.37 | 122 | 1.38 |
| CsCl | 20-30 | 0.06-8.88 | 28 | 0.52 |
| CuSO4 | 10-80 | 0.33-1.11 | 21 | 2.12 |
| HCl | 25-90 | 0.3-3 | 18 | 3.82 |
| HClO4 | 15-50 | 0.51-25.92 | 23 | 2.56 |
| HNO3 | 30-80 | 1.55-46.86 | 66 | 3.71 |
| KBr | 10-90 | 0.44-5.6 | 40 | 1.15 |
| KC2H3O2 | 0-80 | 0.5-23.78 | 36 | 4.82 |
| KCl | 25-80 | 0.71-5.16 | 56 | 1.03 |
| K3Fe(CN)6 | 12.35-20.8 | 0.29-0.62 | 4 | 0.76 |
| KI | 20-60 | 0.01-0.12 | 55 | 4.45 |
| KNO3 | 18-100 | 0.1-2.63 | 27 | 1.28 |
| KOH | 30-95 | 4.77-13.28 | 22 | 4.39 |
| LiBr | 10-90 | 1.28-17.27 | 48 | 1.52 |
| LiCl | 10-90 | 1.19-15.73 | 79 | 1.97 |
| MgCl2 | 10-70 | 0.55-3.5 | 23 | 2.90 |
| NH4Cl | 19-60 | 1.02-7.21 | 39 | 1.01 |
| NH4NO3 | 40-95 | 0.61-29.43 | 29 | 1.21 |
| (NH4)2SO4 | 18-95 | 0.7-5.61 | 33 | 2.07 |
| NaBr | 10-90 | 0.0007-6.48 | 58 | 3.14 |
| NaC2H3O2 | 0-25 | 0.50 | 6 | 0.94 |
| NaC4H7O2 | 0-50 | 0.50 | 10 | 1.63 |
| NaCl | 10-200 | 0.71-9.42 | 81 | 1.73 |
| NaI | 20-50 | 0.33-8.81 | 32 | 0.89 |
| NaNO3 | 18-100 | 1.02-11.77 | 42 | 1.59 |
| NaOH | 20-70 | 0.49-6.25 | 26 | 1.30 |
| Na2SO4 | 10-193.4 | 0.2-1.24 | 62 | 2.87 |
| RbCl | 20-30 | 0.11-6.93 | 22 | 0.59 |
| SrCl2 | 10-25 | 0.48-1.92 | 7 | 1.24 |
| UO2SO4 | 20-75 | 0.18-2.34 | 48 | 0.81 |
| Zn(NO3)2 | 21 | 2.62 | 1 | 1.10 |
| Overall | 1215 | 1.98 |
Table 2: The absolute average deviation percent (%AAD) in prediction of new model for binary systems. Experimental data are from ref. [10].
| Ternary system | m1 | m2 | T(°C) | Np | %AAD |
|---|---|---|---|---|---|
| BaCl2-HCl | 0.45-1.13 | 0.10 | 25 | 3 | 0.47 |
| CaCl2-HCl | 0.37-1.48 | 0.10 | 25 | 4 | 1.92 |
| LiCl-HCl | 0.55-4.88 | 0.10 | 25 | 5 | 2.23 |
| SrCl2-HCl | 0.48-1.92 | 0.10 | 25 | 4 | 1.13 |
| KBr-KCl | 0.35-2.08 | 0.34-1.89 | 18 | 10 | 0.65 |
| KBr-NaBr | 0.44-3.57 | 0.51-4.2 | 10.1-90.8 | 45 | 2.59 |
| KNO3-NH4NO3 | 0.52-2.43 | 0.12-19.54 | 18-30 | 143 | 6.93 |
| KNO3-Pb(NO3)2 | 0-1 | 0-1 | 20 | 33 | 2.66 |
| KNO3-Sr(NO3)2 | 0.23-1.3 | 0.19-1.17 | 18 | 10 | 0.92 |
| NH4Cl-(NH4)2SO4 | 0.51-2.86 | 0.33-2.04 | 18 | 10 | 0.63 |
| NH4NO3-Pb(NO3)2 | 0.33 | 0-0.333 | 35 | 6 | 2.07 |
| NaNO3-Sr(NO3)2 | 0.71-3.48 | 0.25-1.17 | 18 | 9 | 1.24 |
| NaClO4-HCl | 0.5-1.34 | 0.10 | 25 | 3 | 0.70 |
| KNO3-NH4Cl | 0.23-1.3 | 0.49-2.86 | 18 | 10 | 1.06 |
| NH4Cl-Sr(NO3)2 | 0.51-2.86 | 0.19-1.17 | 18 | 10 | 0.91 |
| (NH4)2SO4-NaNO3 | 0.33-2.04 | 0.56-3.47 | 18 | 9 | 1.03 |
| Average | 314 | 1.70 |
Table 3: The absolute average deviation percent (%AAD) in prediction of new models for ternary systems. Experimental data are from ref. [10].
Based on the Gibbs thermodynamic and distinct area for surface phase a new model for calculation of surface tension of single and mixture of electrolyte is developed. The molality in surface phase is calculated using Langmuir gas-solid adsorption theory for electrolytes. The osmotic coefficient model in the competitive adsorption model is E-NRTL model. The adjustable parameters of the model are obtained by correlating the experimental values of surface tension of binary electrolyte solution in single temperature. For other temperatures and ternary systems, competitive adsorption model could predict the surface tension of aqueous solution. The agreement between experimental and calculated values of the competitive adsorption model could introduce this new model as effective one.