Journal of Thermodynamics & Catalysis
Open Access
ISSN: 2157-7544
ISSN: 2157-7544
Research Article - (2016) Volume 0, Issue 0
In the present paper, the method for approximate calculation of phase space volumes proposed in Ref. [1] is extended. Expressions for the melting heat of materials with f.c.c., b.c.c. and h.c.p. lattices are derived. Experimental results are compared to numerical calculations for a number of elements.
Keywords: Thermodynamic; Heat; First-order phase transitions
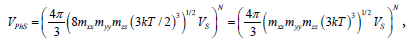
A principally new approach to the calculation of the heat of firstorder phase transitions was proposed in Ref. [1]. It is based on an approximate calculation of the phase volumes of a system in different phases: solid, liquid or gaseous and calculation of the change of entropy given as a logarithmic ratio of the volumes of old and new phases  . The volumes of phase space for liquid and gaseous phases are also calculated therein:
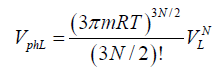 (1)
(1)
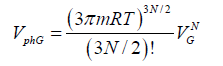 (2)
(2)
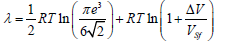
Where VL and VG are the volumes of liquid and gas, respectively. The expression for the evaporation heat is obtained in Ref. [1] in terms of other thermodynamic parameters of the process. A good agreement of numerical results and experimental data suggests that the method is versatile and can be used for calculating the transition heat of other first-order phase transitions. As it was shown in Ref. [1], the calculation should take into account the work performed against external forces during a phase transition with employment of the free volume. The expression for the phase volume of liquid was obtained in Ref. [1], whereas the calculation of a melting heat requires the phase space volume of solid state. The following model is used to find this volume. Every atom (molecule, ion) of a solid is assumed to vibrate near the equilibrium state, and its energy in a self-consisted periodic field is  .
.
Quadratic expansion of energy into powers of  gives:
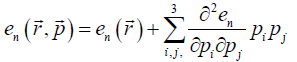
 can be interpreted as an effective potential energy
  ,
,  .
.
By diagonalizing the quadratic form according to the standard technique, we obtain:
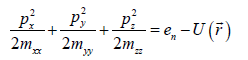 (3)
(3)
Where mxx, myy, mzz are components of the effective mass tensor. 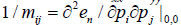 . This approach is utilized in solid state physics, for example, in Ref. [2]. Equation (3) is the elliptic equation with the axes
 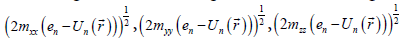 , the corresponding volume of the ellipsoid is
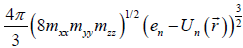
Integration over in the phase space gives:
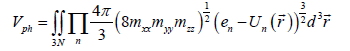
It was assumed in Ref. [1] that near a point of first-order phasetransition, the majority of atoms are in the state with the average kinetic energy. This assumption is proved by a good agreement between numerical results and experimental data on evaporation heat. Consequently, according to the equipartition theorem for kinetic energy [3], one can substitute 3KT/2 for  . Thus, the approximate volume of phase space for solid is given by:
 (3)
(3)
Calculation of the Melting Heat
The volume of phase space for solid is given by (3). In the first part of the present work [1] it was shown that the employment of the free volume (for unit mole, the free volume is 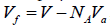 , where V is the geometrical volume, NA is the Avogadro constant, and Va is the volume of atom (molecule, ion)) gives a substantially better agreement between numerical and experimental results. The phase space volume for solid state is expressed as:
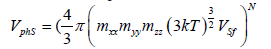 (4)
(4)
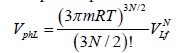
and the phase space volume for liquid state is, respectively, (1):
Correspondingly, the logarithm of the ratio  is equal to:

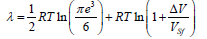
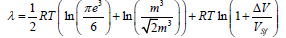
By using the Stirling formula  and taking into account R=kNA, we obtain:
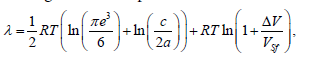
Thus, the expression for the melting heat has the form:
 (5)
(5)
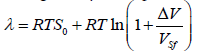
Under normal pressure, the term PΔV is on the order of 105*10-6 ~ 10-1, and the value of the first term is ~104, hence, up to pressures of ~ 1010 Pa the term PΔV can be neglected.  . Finally, the expression for the melting heat at pressures below 1010 Pa has the form:
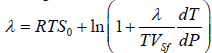 (8)
(8)
Where dT/dP is the initial slope of the melting curve [6]. The obtained equation is simply solved numerically by the iterative method and provides the value of the melting heat. The results of calculations by formula (6) and the solutions of equation (8) are given in Tables 1-3. Experimental data for the calculations are taken from Ref. [4,5]. In Tables 1-3 the number of polymorphic phase transitions before melting is marked with asterisks *. Spaces in the tables mean that there is no available data on the jumps of volume in melting.
Melting heat for the f.c.c. lattice
To the f.c.c. lattice in the –space, in which the expansion was performed, corresponds the b.c.c. lattice. In view of the symmetry of b.c.c. lattice, we take: mxx, myy, mzz Then, the melting heat for the f.c.c. lattice takes the form:
 (9)
(9)
The structural melting constant for the f.c.c. lattice is S0=1.1765.
For low-melting elements with weak interaction between atoms the effective masses are approximately equal to atomic masses, whereas for hard-melting materials the difference can be substantial. Results of calculations of the melting heat for f.c.c. lattices by formula (9) and solutions of equation (8) are given in Table 1.
| El-t | T | λex | VS | ΔV | ra | VSf | λT1 | δ1 | dT/dP | λT2 | δ2 |
|---|---|---|---|---|---|---|---|---|---|---|---|
| Ne | 24,48 | 324 | 1,397 | 0,22 | 1,60 | 0,365 | 335,4 | -3,5 | 13,16 | 317 | 2,0 |
| Ar | 83,87 | 1210 | 2,412 | 0,35 | 1,91 | 0,656 | 1118 | 7,6 | 24,89 | 1102 | 8,9 |
| Kr | 116,6 | 1640 | 2,968 | 0,45 | 1,98 | 1,012 | 1497 | 8,7 | 30,13 | 1444 | 11,9 |
| Xe | 161,3 | 2290 | 3,709 | 0,56 | 2,18 | 1,098 | 2129 | 7,0 | 38,9 | 2082 | 9,1 |
| Pb | 600,7 | 4770 | 1,826 | 0,07 | 1,32 | 1,246 | 6146 | -28,8 | 7,73 | 6182 | -30,0 |
| Al | 933,5 | 10670 | 1,000 | 0,07 | 0,57 | 0,953 | 9676 | 9,3 | 6,41 | 9648 | 9,6 |
| Ar | 1235 | 11300 | 1,027 | 0,06 | 0,89 | 0,849 | 12775 | -13,1 | 4,9 | 12664 | -12,1 |
| Au | 1338 | 12700 | 1,019 | 0,05 | 0,91 | 0,829 | 13732 | -8,1 | 6,2 | 13914 | -9,6 |
| Cu | 1357 | 13000 | 0,709 | 0,04 | 0,72 | 0,615 | 13978 | -7,5 | 4,69 | 14129 | -8,7 |
| Ac | 1370 | 14200 | 2,260 | … | 1,18 | 1,846 | … | … | 19,4 | 14603 | -2,8 |
| Ni | 1726 | 17600 | 0,659 | 0,05 | 0,78 | 0,539 | 18146 | -3,1 | 3,7 | 17858 | -1,5 |
| Pd | 1825 | 17200 | 0,885 | … | 0,64 | 0,819 | … | … | 6,4 | 19030 | -10,6 |
| Pt | 2045 | 19700 | 0,910 | 0,06 | 0,70 | 0,824 | 21188 | -7,6 | 6,2 | 21275 | -8,0 |
| Rh | 2239 | 22600 | 0,829 | … | 0,86 | 0,669 | … | … | 5,9 | 23540 | -4,2 |
| Ir | 2683 | 26400 | 0,857 | … | 0,89 | 0,679 | … | … | 6,2 | 28280 | -7,1 |
Table 1: Calculation results of melting heat for f.c.c. lattices.
T is the melting temperature in K, λex [J/mol] is the experimental value of the melting heat, VS*105[m3/mol] is the molar volume of the solid state, ΔV*105[m3/mol] is the volume jump in melting, r*1010[m] is the radius of atom (ion), VSf*105[m3/mol] is the free volume, (dT/ dP)*108[K/Pa] is the initial slope of the melting curve, λT1 [J/mol] is the molar melting heat calculated by formula (9), λT2 [J/mol] is the molar melting heat obtained by solving equation (8), δ1 and δ2[%] are inaccuracies of λT1 and λT2, respectively.
Experimental values of the melting heat and the line of a simple regression are shown in Figure 1. The slope of the regression line is 1.1670, which well coincides (with a good accuracy of ~ 0.85%) with the structural melting constant of the f.c.c. lattice S0=1.1765.

Figure 1: Experimental values of the reduced melting heat for elements with the f.c.c. lattice and the line of simple regression.
Melting heat for the b.c.c. lattice
To the b.c.c. lattice in the –space corresponds the f.c.c. lattice. Hence, taking into account geometrical factors we take 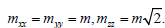 Then the expression for the melting heat in the case of b.c.c. lattice takes the form
or
 (10)
(10)
The structural melting constant for the b.c.c. lattice is S0=1.0032.
Results of calculations of the melting heat for b.c.c. lattices by formula (10) are given in Table 2 along with the results of solving equation (8).
| El-t | T | λex | VS | ΔV | ra | VSf | λT1 | δ1 | dT/dP | λT2 | δ2 |
|---|---|---|---|---|---|---|---|---|---|---|---|
| Cs | 301,5 | 2090 | 7,096 | 0,169 | 1,65 | 5,964 | 2150 | -2,8 | 25,9 | 2156 | -3,2 |
| Rb | 312,2 | 2200 | 5,579 | 0,193 | 1,49 | 4,745 | 2257 | -2,6 | 21,1 | 2234 | -1,6 |
| K | 336,8 | 2400 | 4,536 | 0,117 | 1,33 | 3,943 | 2405 | -0,2 | 17,7 | 2411 | -0,5 |
| Na | 371 | 2640 | 2,368 | 0,064 | 0,98 | 2,131 | 2650 | -0,4 | 8,77 | 2648 | -0,3 |
| Li | 453,7 | 3130 | 1,300 | 0,032 | 0,78 | 1,180 | 3230 | -3,2 | 3,41 | 3205 | -2,4 |
| Pb | 600,7 | 4770 | 1,826 | 0,070 | 1,32 | 1,246 | 4416 | 7,4 | 7,73 | 4363 | 8,5 |
| Ba | 983 | 7530 | 3,821 | 0,030 | 1,43 | 3,084 | 6859 | 8,9 | 4,3 | 6990 | 8,7 |
| Sr** | 1042 | 8000 | 3,450 | 0,177 | 1,27 | 2,934 | 7694 | 3,8 | 16,5 | 7531 | 5,9 |
| Eu | 1095 | 9200 | 2,898 | 0,140 | 1,12 | 2,544 | 8040 | 12,6 | 12,8 | 7875 | 14,4 |
| Yb* | 1097 | 7700 | 2,484 | 0,100 | 1,07 | 2,175 | 7976 | -3,6 | 17,0 | 8075 | -4,9 |
| La** | 1194 | 10040 | 2,260 | 0,012 | 1,14 | 1,887 | 8298 | 17,3 | 2,5 | 8325 | 17,1 |
| Pr* | 1204 | 8200 | 2,080 | … | 1,06 | 1,780 | … | … | 2,2 | 8389 | -2,3 |
| Nd* | 1294 | 10680 | 2,059 | 0,019 | 0,99 | 1,814 | 9037 | 15,4 | 2,6 | 9031 | 15,4 |
| Sm* | 1350 | 10900 | 2,000 | 0,072 | 1,20 | 1,564 | 9816 | 9,9 | 6,0 | 9612 | 11,8 |
| U** | 1405 | 9200 | 1,256 | 0,029 | 0,97 | 1,026 | 10016 | -8,9 | 2,8 | 9920 | -7,8 |
| Mn*** | 1517 | 12070 | 0,738 | 0,042 | 0,91 | 0,548 | 11392 | 5,6 | 3,3 | 11000 | 8,8 |
| Be* | 1551 | 13000 | 0,488 | 0,056 | 0,35 | 0,477 | 12128 | 6,7 | 5,0 | 11675 | 10,2 |
| Gd* | 1586 | 10200 | 1,990 | 0,041 | 0,97 | 1,760 | 11243 | -10,2 | 5,7 | 11237 | -10,2 |
| Tb* | 1629 | 10800 | 1,931 | 0,061 | 0,89 | 1,753 | 11699 | -8,3 | 7,4 | 11636 | -7,7 |
| Dy* | 1685 | 10900 | 1,900 | 0,093 | 0,89 | 1,722 | 12358 | -13,4 | 12,0 | 12316 | -13,0 |
| Ho* | 1747 | 14160 | 1,875 | 0,140 | 0,95 | 1,659 | 13226 | 6,6 | 14,3 | 12947 | 8,5 |
| Y* | 1795 | 11390 | 1,989 | … | 1,06 | 1,689 | … | … | 16,5 | 13432 | -17,9 |
| Er* | 1802 | 17200 | 1,844 | 0,166 | 0,93 | 1,641 | 13872 | 19,3 | 15,0 | 13413 | 22,0 |
| Fe** | 1808 | 13800 | 0,709 | 0,030 | 0,83 | 0,565 | 13248 | 4,0 | 3,0 | 13033 | 5,5 |
| Sc* | 1814 | 15900 | 1,504 | … | 0,83 | 1,360 | … | … | 15,1 | 13726 | 13,7 |
| Ti* | 1933 | 15000 | 1,055 | … | 0,90 | 0,871 | … | … | 15,4 | 15454 | -3,0 |
| Th* | 2023 | 15600 | 1,980 | … | 1,11 | 1,635 | … | … | 18,6 | 15342 | 1,6 |
| Cr | 2110 | 21000 | 0,723 | … | 0,84 | 0,574 | … | … | 15,9 | 18336 | 12,7 |
| Zr* | 2125 | 20000 | 1,402 | … | 1,09 | 1,076 | … | … | 16,3 | 16635 | 16,8 |
| V | 2160 | 23100 | 0,834 | … | 0,88 | 0,662 | … | … | 15,7 | 18158 | 21,4 |
| Hf* | 2503 | 20935 | 1,341 | … | 0,84 | 1,192 | … | … | 17,3 | 19489 | 6,9 |
| Nb | 2741 | 27200 | 1,084 | … | 0,77 | 0,969 | … | … | 16,2 | 21739 | 20,1 |
| Mo | 2890 | 27600 | 0,939 | 0,010 | 0,92 | 0,743 | 20254 | 26,6 | 0,96 | 20146 | 27,0 |
| Ta | 3269 | 31400 | 1,087 | 0,056 | 0,77 | 0,972 | 24069 | 23,3 | 5,4 | 23613 | 24,8 |
| W | 3680 | 35200 | 0,953 | 0,125 | 0,77 | 0,838 | 29634 | 15,8 | 7,8 | 27430 | 22,1 |
Table 2: Calculation results of melting heat for b.c.c. lattices.
T is the melting temperature in K, λex[J/mol] is the experimental value of the melting heat, VS*105[m3/mol] is the molar volume of the solid state, ΔV*105[m3/mol] is the volume jump in melting, r*1010[m] is the radius of atom (ion), VSf*105[m3/mol] is the free volume, (dT/ dP)*108[K/Pa] is the initial slope of melting curve, λT1[J/mol] is the molar melting heat calculated by formula (10), λT2[J/mol] is the molar melting heat obtained by solving equation (8), δ1 and δ2[%] are the inaccuracies of λT1 and λT2, respectively.
Experimental values of the melting heat and the line of simple regression are presented in Figure 2 for the most low-melt elements. First seven metals were chosen with the lowest melting points for which the most relevant experimental data on melting temperature and melting heat are available. The slope of the regression line is 0.967 and matches the structural melting constant of the b.c.c. lattice S0=1.0032 with a good accuracy of ~ 3.6%.

Figure 2: Experimental values of melting heat and the line of simple regression for elements with b.c.c. lattice and the lowest melting points.
Melting heat for the h.c.p. lattice
h.c.p lattice transforms into itself in the – space. The effective masses are, respectively, 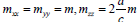 . Thus, the expression for the melting heat for h.c.p. lattice has the form
 (11)
(11)
where a and c are parameters of the h.c.p. lattice. Since the ratio c/a for the elements does not differ much from the ideal case  , we may replace real values of the ratio a/c in the expression for S0 with the ideal value and obtain the relationship for the melting heat for the h.c.p. lattice:
 (12)
(12)
The structural melting constant for the h.c.p. lattice is S0=1.075.
Results of calculations by formula (12) are given in Table 3. The results of solving equation (8) for h.c.p. lattices are also presented in the table.
| El-t | T | λex | VS | ΔV | ra | VSf | λT1 | δ1 | dT/dP | λT2 | δ2 |
|---|---|---|---|---|---|---|---|---|---|---|---|
| Cd | 594,1 | 6110 | 1,300 | 0,04 | 1,14 | 0,927 | 5516 | 9,7 | 5,3 | 5565 | 8,9 |
| Zn | 692,7 | 6670 | 0,917 | 0,04 | 0,83 | 0,773 | 6479 | 2,9 | 4,8 | 6516 | 2,3 |
| Mg | 992 | 9040 | 1,398 | 0,04 | 0,78 | 1,278 | 9116 | -0,8 | 7,5 | 9303 | -2,9 |
| Ca** | 1112 | 9330 | 2,586 | 0,13 | 1,06 | 2,286 | 10445 | -11,9 | 14,9 | 10485 | -12,4 |
| Pm | 1441 | 12600 | 2,010 | … | 1,06 | 1,710 | … | … | 31,3 | 14956 | -18,7 |
| Co* | 1768 | 15200 | 0,662 | 0,01 | 0,82 | 0,523 | 15014 | 1,2 | 3,5 | 15578 | -2,5 |
| Tm | 1818 | 18400 | 1,812 | 0,13 | 0,87 | 1,646 | 17389 | 5,5 | 12,0 | 17251 | 6,2 |
| Lu | 1936 | 19200 | 1,778 | 0,06 | 0,85 | 1,623 | 17879 | 6,9 | 15,9 | 18753 | 2,3 |
| Tc | 2445 | 23810 | 0,860 | … | 0,95 | 0,644 | … | … | 5,5 | 23441 | 1,5 |
| Ru | 2583 | 23700 | 0,814 | … | 0,77 | 0,699 | … | … | 6,1 | 24802 | -4,6 |
| Os | 3327 | 29300 | 0,843 | … | 0,89 | 0,665 | … | … | 6,5 | 32220 | -10,0 |
| Re | 3453 | 33100 | 0,886 | 0,03 | 0,72 | 0,792 | 31913 | 3,6 | 3,2 | 31898 | 3,6 |
Table 3: Calculation results of melting heat for h.c.p. lattices.
T is the melting temperature in K, λex [J/mol] is the experimental value of the melting heat, VS*105[m3/mol] is the molar volume of the solid state, ΔV*105 [m3/mol] is the volume jump in melting, r*1010[m] is the radius of atom (ion), VSf*105 [m3/mol] is the free volume, (dT/ dP)*108 [K/Pa] is the initial slope of the melting curve, λT1[J/mol] is the molar melting heat calculated by formula (12), λT2 [J/mol] is the molar melting heat obtained by solving equation (8), δ1 and δ2 [%] are the inaccuracies of λT1 and λT2, respectively.
Experimental values of the melting heat are presented in Figure 3 along with the line of a simple regression. The slope of the regression line is 1.1186 and matches the structural melting constant of h.c.p. lattice S0=1.0075 with a good accuracy of ~ 4%.

Figure 3: Experimental values of melting heat for elements with the h.c.p. lattice and the line of simple regression.
As one can see from Tables 1-3, the proposed model gives a satisfactory description of the melting heat for the elements considered. In Ref. [7], experimental data on temperatures and melting heat values for eight well characterized elements are given. As one can see from Table 4, even for these elements the experimental results noticeably differ.
| El-t | Tmin | Tmax | λmin | λmax | El-t | Tmin | Tmax | λmin | λmax |
|---|---|---|---|---|---|---|---|---|---|
| Al | 930 | 933.74 | 7928.93 | 11300.9 | Nb | 2523 | 2773 | 26756.9 | 26849.8 |
| Cu | 1356 | 1357.8 | 7968.67 | 13453.3 | Mo | 2853 | 2901 | 20051.5 | 41254.2 |
| Ni | 1721 | 1744 | 15984.2 | 18663.4 | Ta | 3053 | 3275 | 24699.4 | 32027.8 |
| Ti | 1878 | 2093 | 15474.3 | 20923.6 | W | 3523 | 3683 | 33782.4 | 54971.1 |
Table 4: Spread of experimental values on temperatures and melting heat.
Tmin and Tmax are the minimal and maximal values of experimental melting temperature, λmin and λmax are the lowest and highest values of experimental melting heat. The same trend holds true for the values given in various handbooks. The results only coincide if data are taken from a single source. Consequently, it would not be correct to hope for a good agreement between experimental data and the numerical results calculated by formulae (9-10, 12).
The substantial difference between the experimental value of the melting heat for lead and the corresponding value calculated for the f.c.c. lattice along with the satisfactory agreement with the value of the melting heat calculated for the b.c.c. lattice suggest that a polymorphic transition from the f.c.c. lattice to b.c.c. lattice occurs near the melting point with the phase transition heat equal to λ ≈1700 −1800 J/mol. The phase transition heat is calculated in the frameworks of the proposed model.
Thus, one can assert that the molar melting heat at pressures below 1010 Pa is given by the expression
or by a solution of the equation
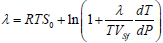 ,
,
Where S0=1.1765 for the f.c.c. lattice, S0=1.0032 for the b.c.c. lattice and S0=1.075 for the h.c.p. lattice. The rest values have been defined earlier.