Journal of Aeronautics & Aerospace Engineering
Open Access
ISSN: 2168-9792
ISSN: 2168-9792
Research Article - (2016) Volume 5, Issue 2
High noise level of sonic boom is one of the most important reasons that the supersonic transport can’t be applied to civil aviation broadly. Sonic boom is a complicated problem relating to aircraft configuration design, aerodynamics, acoustics and so on. The traditional sonic boom minimization theory is an inverse design method with single object, which makes it difficult to be applied in multi-objective optimization, effectively. For the low sonic boom configuration optimization, the sonic boom noise level prediction method based on supersonic linear theory was developed. The sonic boom level of a basic configuration of supersonic business jet was computed and the cause of formation of sonic boom was analyzed, based on which the fuse and wing plane wais optimized to decrease the noise level of sonic boom. Compared with the basic configuration, the sonic boom level of optimized configuration decreased distinctively, with the overpressure decreasing 41% and the A-weighted noise level decreasing 7.55 decibel. The aerodynamic characteristics of optimized configuration were computed. Compared with the basic configuration, the drag decreased obviously at the cruise condition without moment change.
<Keywords: Sonic boom; Supersonic transport; Optimization design; Aeroacoustics; Supersonic linear theory
The big noise caused by sonic boom when the flight vehicle flying supersonically will not only has an influence on human lives but also bring a destroy to the constructions, especially for the infrasonic boom. The noise level of a Concord civil aircraft flying at the altitude of 50000 ft will be 133 dB, but the noise level of the civil aircraft is only about 90 dB when taking off and landing. Thus, the Concord was forbidden to fly over the continent supersonically because of the high sonic boom level, which played down the economy of Concord. The noise level of next generation supersonic transport is demanded lower than 70 dB, which is comparative with the transonic civil aircraft. Thus mitigating the sonic boom is an exigent problem for next generation supersonic transports development.
The sonic boom of supersonic aircraft is a complex problem which refers to aircraft configuration design, aerodynamics, acoustics and so on. The research of sonic boom can be traced back to 1950’s [1-3]. Since then, the sonic boom prediction methods based on supersonic linear theory, geometry acoustics [4-7] and the sonic boom minimization theory [8-12] have been applied to the supersonic transport design. Recently, The CFD (Computational Fluid Dynamics) has been used for sonic boom prediction and physics research more and more. Besides, the modern optimization theories have been applied to the low sonic boom configuration optimization. Compared with the sonic boom minimization theory, the low sonic boom optimization based on modern optimization theory can obtain the configuration not only with the low sonic boom character but also with other good performance such as good aerodynamic character, weight character, structure character and so on.
In this paper the low sonic boom configuration optimization of supersonic business jet were researched. First of all, the sonic boom noise level prediction method based on supersonic linear theory was developed. Then, the sonic boom level of a basic configuration of supersonic business jet was computed and the cause of formation of sonic boom was analyzed, based on which the fuse and wing plane was optimized to decrease the noise level of sonic boom. At last, the aerodynamic characteristic and the sonic boom pressure near the optimized configuration were computed by CFD.
Linearized supersonic flow
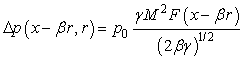
For a slender axisymmetric body in cylinder coordinates, the over pressure Δp= p-p0 can be written as:
 (1)
(1)
 (2)
(2)
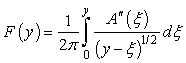
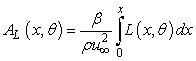
Where, M is Mach number, y= x-βr,  A is the crosssectional area of body by the normal projections of cuts alone planes aligned with the Mach angle. F(y) is also called “Whitham F function”. For the asymmetric body, the area A was generalized to equivalent area Ae (x,θ ), which consists two components: a volume component and a lift component. The lift component of the equivalent area is given by:
 (3)
(3)
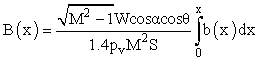
Where is L (x,θ) the component of lift per unit length at axial station x, in the θ direction. In this paper, the uniform distribution of the lift alone the wing was supposed so the eq. (3) can be written as:
 (4)
(4)
Where b(x) is the span alone axial station x, W is the weight of the body.
Noise level computation
The over pressure near the aircraft computed by eq.(1) was extrapolated to the ground by waveform parameter method proposed by Thomas [13] in 1972. The narrow band spectrum of over pressure on the ground was obtained by Fast Fourier Transform:
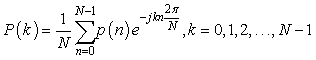 (5)
(5)
Where p(n) is the over pressure at some time, p(k) is the over pressure at the frequency of k. N is the number of input data, which equals the exponential of 2.
The sound pressure was computed by:
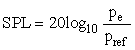 (6)
(6)
Where pe is the effective pressure, pref is the reference pressure.
Based on narrow band noise level, the 1/3 octave noise level can be obtained, by which the A weighted noise level was computed.
The sonic boom noise level of a supersonic business jet was analyzed. Figure 1 shows the sketches of the aircraft, and the parameters of this supersonic business jet are listed in Table 1. This configuration was designed without considering the sonic boom characteristic. Figure 2 gives the F function and equivalent area distribution alone axial station at cruise lift coefficient and zero lift condition. It can be seen that both at the cockpit and the wing, the remarkable change of the cross-sectional area of aircraft by the normal projections of cuts alone planes aligned with the Mach angle made the shock wave generation. The lift component of equivalent area enhanced the strength of shock wave further. Figure 3 gives the over pressure of sonic boom below the aircraft at the radius of 5 lengths of the aircraft. Figure 4 gives the over pressure of sonic boom at ground. The over pressure on the ground is 100 pa with the reflect factor 1.9. When the aircraft cruising with Mach 1.6 at the altitude of 14km, the A weighted noise level of the sonic boom over pressure on the ground is 91.3 dB.
| Passenger | 8-12 |
| Cruise Mach | 1.6 |
| Cruise altitude(km) | 14 |
| Range(nm) | 4000 |
| Maximum takeoff weight(ton) | 45 |
| Length(m) | 45.2 |
| Spanwise(m) | 20 |
Table 1: Supersonic business jet parameters.

Figure 1: Three-view-of the basic supersonic business jet.

Figure 2: F-function and equivalent area distribute alone aircraft.

Figure 3: Sonic boom signals at R=5L below the aircraft.

Figure 4: Sonic boom signals at ground.
The optimization of aircraft fuse
In order to bate the strength of shock wave led by cockpit, the fuse of aircraft was optimized. Because of the little contribution to equivalent area of the rudder, elevator and engine, only the wing body configuration was optimized with nose and cockpit were designed integrally. Supposing the nose, mid-fuse and aft-fuse were configured by a series of circle section with different radius, the center coordinates, the radius of the circle and the position of wing installation were optimized. Table 2 lists the optimization variables and constraints. There are 28 optimized variables with 5 control sections of nose, 8 control sections of both mid and aft fuse. The constraint of nose declination angle was set to ensure sight of pilot and the aft fuse angle was constrained to meet the requirement of taking off.
| Variables | Radius of nose sections:d1-d5 |
| Radius of fuse sections: d6-d13 | |
| Center coordinates of nose sections:y1-y5 | |
| Center coordinates of fuse sections:y6-y13 | |
| Wing installation position:x0,y0 | |
| Constraints | View of pilot:a1∈(a1min,a1max) |
| Clearance angle: a2∈(a2min,a2max) |
Table 2: The optimization variables and constraints of fuse.
The minimum A-weight noise level on the ground at Ma=1.6 was chosen as the optimization object. Figure 5 shows the sketch of the wing body configuration after optimization. Figure 6 gives F-function and equivalent area distribution alone the optimized configuration at cruise lift coefficient and zero lift condition. Figure 7 shows the over pressure of sonic boom at the distance of 5 lengths of aircraft below the optimized configuration. The solid line is the result of the basic configuration, the dashed line is the result of optimization configuration at zero lift coefficients and the dash dot line is the result of optimization configuration at cruise lift coefficients. It can be seen that the equivalent area of the optimized configuration distributes more smoothly alone the body and from the results of zero lift coefficients, the volume component of equivalent area didn’t cause notable shock wave, which means that the optimization of fuse and nose was effect. The shock wave was caused by the lift component which can be seen from the results of cruise lift coefficient. Figure 8 gives the over pressure of sonic boom on the ground varying as time. The solid line represents the result of basic configuration and the dashed line represents the result of optimized configuration. The over pressure on the ground was 81 pa with the reflect factor 1.9, and the maximum over pressure decrease 20% after optimization. The A-weight noise level on the ground at Ma = 1.6 and cruise lift coefficients was 87.5dB, with 3.8 dB reduction after optimization.
| Variables | Optimization Range |
| Root Chord/m | 18-28 |
| Tip-root Ratio | 0.07-0.1 |
| Span/m | 14.4-17.6 |
| Inner wing Swept/。 | 68-75 |
| Outer wing Swept/。 | 50-65 |
| KINK/m | 3.0-6.0 |
| Wing Area/m2 | 130-150 |
Table 3: The range of optimization variables.

Figure 5: The wing body configuration with fuse optimized.

Figure 6: F-function and equivalent area distribution alone aircraft with fuse optimized.

Figure 7: Sonic boom signals at R=5L below the aircraft before and after fuse optimized.

Figure 8: Sonic boom signals at ground before and after fuse optimized.
The optimization of wing plane geometry
Base on the section 4.1, some optimization still needs to be done in order to obtain a better lift distribution, which could decrease the sonic boom caused by the lift component of the effective area. Supposing the lift distribution was uniform alone the wing, the lift component of equivalent area can be optimized through the optimization of wing geometry.
The genetic algorithm was used to do the optimization. There were 6 optimization variables, including the root chord, tip-root ratio, span, inner wing swept, outer wing swept and KINK position, which are shown in Table 3. The wing area was constrained to ensure the appropriate aerodynamic characteristic. The minimum A-weight noise level on the ground at Ma = 1.6 was chosen as the optimization object. Figure 9 is the sketch of the configuration with wing geometry optimized, and the parameters of wing geometry before and after optimization are shown in Table 4.
| Variables | Basic | Optimization |
| Chord Root/m | 25.36 | 19.1 |
| Tip-root Ratio | 0.13 | 0.0992 |
| Span /m | 20 | 16.496 |
| Inner wing Swept /。 | 72 | 74.95 |
| Outer wing Swept /。 | 50 | 63.8 |
| KINK/m | 32% | 61.94% |
| Wing Area/m2 | 164.5 | 146.12 |
Table 4: Geometry parameters of the wing.

Figure 9: The wing body configuration with wing geometry parameters optimized.
Figure 10 shows the F-function and equivalent area distribution alone the optimized configuration at cruise lift coefficient and zero lift condition. Figure 11 shows the over pressure of sonic boom at the distance of 5 lengths of aircraft below the optimized configuration. The solid line is the result of the optimized configuration in section 4.1, the dash dot line is the result of the configuration with wing geometry optimization at zero lift coefficients and the dashed line is the result of the configuration with wing geometry optimization at cruise lift coefficients. It can be seen that the over pressure caused by the lift component of equivalent area decreased obviously after the wing geometry optimized. The shock wave generated at about 20% alone the aircraft was caused the change of the wing geometry, which changed the cross-sectional area of body by the normal projections of cuts alone planes aligned with the Mach angle. Thus, the fuse should be tailored to weaken the shock wave. Figure 12 gives the over pressure of sonic boom on the ground. The solid line is the result the optimized configuration in section 4.1 and the dashed line is the result of the configuration with wing geometry optimization. The over pressure of wing geometry optimization is 60 pa with the reflect factor 1.9, 26% decreased compared with the optimization configuration in section 4.1, and the A-weight sound pressure level is 83.74 dB, 3.8 dB decreased after optimization.

Figure 10: F-function and equivalent area alone aircraft with wing geometry parameters optimized.

Figure 11: Sonic boom signals at R=5L below the aircraft before and after wing geometry parameters optimized.

Figure 12: Sonic boom signals at ground before and after wing geometry parameters optimized.
From the results, it can be seen that the shock wave caused by the lift component of the effective area decrease obviously, and the tiny shock wave at the 20% alone the aircraft was caused by the change of wing geometry, which lead to the volume component of effective area change. The over pressure on the ground is 60 pa with the reflect factor 1.9, 26% decreased compared with the configuration without wing optimization, and the A-weight sound pressure level is 83.74 dB, 3.8 dB decreased after optimization. Compared with the basic configuration, the sonic boom noise of the optimized configuration of fuse and wing geometry optimization was decreased greatly, with the over pressure decreased 41%, and the A-weight noise level decreased 7.55 dB. Figure 13 gives the 1/3 octave sound pressure level comparisons between the basic configuration (solid line), the configuration with nose and fuse optimization (dashed line) and configuration with wing geometry optimization (dash dot line). It can be seen that the sonic boom noise of the optimized configuration was mitigated greatly from 10Hz to 10k Hz according to the 1/3 octave spectrum.

Figure 13: 1/3 octave sound pressure level before and after optimization design.
In order to compare the both aerodynamic characteristic and flow field between the basic configuration and optimized configuration, the numerical simulation was done. The computation domain was composed of two parts as shown in Figure 14: a cylinder domain at the inner part with non-aligned volume mesh and a mach cone domain around the cylinder with aligned anisotropic cells [14]. The Euler equation was solved for the basic configuration and optimized configuration.

Figure 14: Computation Domain around the aircraft.
Figure 15 gives lift coefficients, drag coefficients and pitching moment coefficients comparison between the basic configuration and optimized configuration in section 4.2. It can be seen that the slope of lift coefficients of the optimized configuration decreased because of the increased wing swept. The angle of attack when cruising (Cl = 0.11) varied from 1.65 to 2.6 degree after optimization. The drag decreased after optimization while the pitching moment change was tiny.

Figure 15: Aerodynamic characteristic comparison between basic and optimized configuration.
Figure 16 shows the pressure distribution around the aircraft at the symmetrical plane. From the flow field results, it can be found that the shock wave of the optimized configuration was weakened remarkably compared with the basic configuration, which meant that the low sonic boom optimization was available.

Figure 16: Pressure contour around the aircraft.
For a supersonic business jet without considering the sonic boom attenuation, distinct shock waves were induced that made big noise. According to the analysis results by supersonic linearized theory, the fuse, nose and wing geometry were optimized. Compared with the basic configuration, the sonic boom level of optimized configuration decreased greatly. The maximum over pressure on the ground decreased 41% and the A weighted sound pressure level decreased 7.55dB. The angle of attack when cruising varied from 1.65 to 2.6 degree after optimization. The drag of the optimized configuration reduced but the change of pitching moment was tiny. The shock waves around the aircraft were weakened obviously from the numerical simulation results, which meant that the low sonic boom optimization was available. The low sonic boom optimization in this paper can be applied to multi-object aerodynamic configuration optimization in the future, with the constraints of aerodynamic characteristic and the optimization objective of weighted sonic boom noise level at multiflight condition.