Journal of Proteomics & Bioinformatics
Open Access
ISSN: 0974-276X
ISSN: 0974-276X
Research Article - (2019)Volume 12, Issue 6
Introduction: Glioblastoma (GBM) is the most common primary malignant brain tumor in humans and, even with aggressive treatment that includes surgical resection, radiation (IR), and chemotherapy administration, prognosis is poor due to tumor recurrence. There is evidence that within GBMs a small number of glioma stem-like cells (GSLCs) exist, which are thought to be therapy resistant and are thus capable of repopulating a tumor after treatment. Like most cancers, GBMs largely employ aerobic glycolysis to create ATP, a phenomenon known as the Warburg Effect. There is no consensus on the metabolic characteristics of cancer stem cells. GSLCs have been shown to rely more heavily on oxidative phosphorylation, but there is also evidence that cancer stem cells can adapt their metabolism by fluctuating between energy pathways or acquiring intermediate metabolic phenotypes. We hypothesized that the metabolism of GSLCs differs from that of differentiated GBM tumor cell lines, and that the steady state metabolism would be differentially altered following radiation treatment.
Materials and Methods: We evaluated the oxygen consumption rate, extracellular acidification rate, and metabolic enzyme levels of GBM cell lines and GSLCs before and after irradiation using extracellular flux assays. We also measured absolute metabolite levels in these cells via mass spectroscopy with and without radiation treatment.
Results: GSLCs were found to be significantly more quiescent in comparison to adherent GBM cell lines, highlighted by lower glycolytic and maximal respiratory capacities as well as lower oxygen consumption and extracellular acidification rates. Analysis of individual metabolite concentrations revealed lower total metabolite concentrations overall but also elevated levels of metabolites in different energy pathways for GSLCs compared to GBM cell lines. Additionally, the metabolism of both GSLCs and GBM cell lines were found to be altered by IR.
Conclusion: While there is not one metabolic alteration that distinguishes irradiated GSLC metabolism from that of GBM cell lines, therapies targeting more metabolically quiescent tumor cells and thus the resistant GSLC population may increase a cancer’s sensitivity to radiotherapy.
Glioblastoma; Biomarker; Serum; Metabolomics
Glioblastoma (GBM) is the most common central nervous system tumor in adults and is characterized by an exceptionally aggressive clinical phenotype. The standard treatment regimen includes surgical resection followed by radiation therapy with concurrent and adjuvant temozolomide. Despite this, prognosis remains poor, with a 15-month median survival and only 10% of patients living more than 5 years [1,2]. Additionally, most tumors recur within the high-dose irradiation volume suggesting additional information about tumor cell radioresistance is needed [3,4].
Two models have been proposed to explain the development of cancer. The traditional theory is that cancer cells develop through the successive accumulation of mutations in a cell’s DNA. Each mutation furthers the loss of the differentiated cell phenotype and eventually results in regression from specialized function with a loss of proliferative regulation. A second model, the cancer stem cell (CSC) theory, suggests that cancer originates from a small population of stem-like cells, which are responsible for populating and maintaining an entire tumor [5]. There is evidence that these stem-like cells exist in GBM, harbor the same somatic mutations as tumor cells, and can produce tumor endothelium [6-8]. Furthermore, studies have shown that CSCs can have an enhanced DNA repair capacity, potentially leading to a resistance to chemoradiotherapy [9,10]. With these characteristics, the CSC theory can be applied to GBM recurrence wherein the glioma stem-like cells repopulate a tumor after chemoradiotherapy treatment.
One of the hallmarks of cancer that is of renewed interest is the ability of cells to adapt their metabolism to favor aerobic glycolysis over oxidative phosphorylation, a phenomenon known as the Warburg effect [11]. While the Warburg effect has been observed in glioma [12], it is also known that the metabolism of these brain cancers can be pliable. In vitro, glioblastomas have shown variability in their mitochondrial respiration, while tissue derived GBM cell lines have shown glucose dependency and a reliance on fatty acid oxidation [13-15]. Additionally, GBM xenografts have shown an increased utilization of glycolysis, even with the loss of the hexokinase I gene [16].
To further define the metabolic differences between glioma stem-like cells (GSLCs) and traditional cell lines we have studied the metabolism of glioma stem-like cell lines compared to the traditional GBM cell lines U87 and U251. The data presented herein indicate that GSLCs have a quiescent metabolic phenotype that is minimally perturbed after irradiation in contrast to the traditional cell lines.
GBM-BioDP analysis
Analysis of the metabolites was performed using The Cancer Genome Atlas (TCGA) database and the Glioblastoma Bio Discovery Portal (GBM-BioDP), a freely accessible web resource that hosts a subset of the glioblastoma TCGA data and enables detailed queries and an interactive display of the resultant data [14]. The heatmap analysis, used to visualize the correlation matrix, and the Kaplan-Meier plots, comparing the prognostic index with overall survival, were generated with the BioDP software.
Tissue culture
The glioblastoma cell line U87 was purchased from ATCC and U251, GBMJ1, 923, and NSC11 (from the lab of Frederick Lang) cells were maintained in the Radiation Oncology Branch, National Cancer Institute. U87 and U251 cells were cultured as adherent monolayers in DMEM with 10% heat inactivated fetal bovine serum at 37°C in a humidified atmosphere with 5% CO2. The GSLCs NSC11, 923, and GBMJ1 were cultured as neurospheres in DMEM-F12 media with 10 mL B-27 (Thermo Fisher)/500 mL media plus 50 ng/mL human fibroblast growth factor and epidermal growth factor (Sigma). Before experiments, GSLCs were grown in monolayer for 24 hours on plates coated with 0.01% poly-L-lysine (Sigma) [17].
Extracellular flux assay
The oxygen consumption rate (OCR) and extracellular acidification rate (ECAR) of cells were measured using a Seahorse XFe96 Analyzer (Agilent). Cells were plated in 96 well plates and allowed to adhere overnight (NSC11 - 20,000 per well, U87 - 10,000/well, U251 - 5,000 per well). Cells were then treated with 6 Gy irradiation (IR) 24 hours prior to analysis. One hour before analysis, cells were washed with XF media (Agilent) and placed in 20% oxygen at 37°C. The Cell Mito Stress Test (Agilent) and Glycolysis Stress Test (Agilent) kits were used via manufacturer’s instructions. Basal respiration and maximal respiration were calculated using changes in OCR using the Cell Mito Stress Test kit and basal glycolysis and glycolytic capacity were calculated using changes in ECAR during usage of the Glycolysis Stress Test kit.
Metabolomics
Cells were plated in a monolayer on 10 cm dishes and allowed to adhere overnight. Treated cells were given 6 Gy IR and cells collected 24 h later (2-5 × 10⁶ cells). Media was aspirated from dishes and washed with 5% mannitol in MilliQ water two times. 800 uL of methanol and 550 uL of an internal standard solution (H3304-1002, HMT, Inc., Tsuruoka, Japan) was added to each dish. Metabolite extracts were collected and centrifuged (2,300 × g at 4°C) for 5 minutes. 350 uL of the supernatant was placed into two filter tubes and centrifuged (9,100 × g at 4°C) for 2-5 hours until no liquid remained in the filter cup. The extracted sample solutions were evaporated under vacuum conditions at room temperature, wrapped with parafilm, and shipped to Human Metabolome Technologies, Inc. on dry ice for capillary electrophoresis-time of flight mass spectrometry (CE-TOFMS) and capillary electrophoresis-triple quadrupole mass spectrometry (CE-QqQMS) analysis. Briefly, the positive mode of CE-TOFMS and the positive and negative modes of CE-QqQMS were used to evaluate cationic and anionic compounds, respectively. Peak information was extracted using MasterHands software (Keio University, Tsuruoka, Japan and MassHunter Quantitative Analysis, B.04.00, Agilent Technologies, Santa Clara, CA). Concentrations of metabolites were calculated by normalizing the peak area of each metabolite to an internal standard [18].
Metabolic enzyme expression as a prognostic indicator
The program BioDP was used to explore The Cancer Genome Atlas (TCGA) mRNA expression database to determine if mRNA for enzymes involved in metabolic functions were present in samples from patients with GBM and if those mRNA levels could be used as predictors of survival [19,20]. As shown in the hierarchical cluster (HC) in Figure 1A, 15 metabolic enzymes were mapped to mRNA within the TCGA and separated the patients into two main clusters (top colored row). The left cluster (blue bar) had a higher percentage of samples, classified by Verhaak [21], as classical and proneural, while the right cluster (red bar) had more samples classified as mesenchymal. The neural subclass was distributed throughout. The values for these 15 enzymes were used to create a prognostic index (PI) by weight averaging their gene expressions with the regression coefficients of a multi-gene Cox proportional hazards model. This PI was compared to overall survival using Kaplan-Maier analysis. In the plot shown in Figure 1B comparing patients in the upper and lower quartiles, those patients with a PI in the first quartile survived longer than those in the fourth quartile (HR 1.8, p=0.012), even when stratified by both age (HR 1.027) and MGMT status (HR 1.004). This finding implicates that metabolic function may be useful as a prognostic marker for patient survival in patients diagnosed with a GBM.
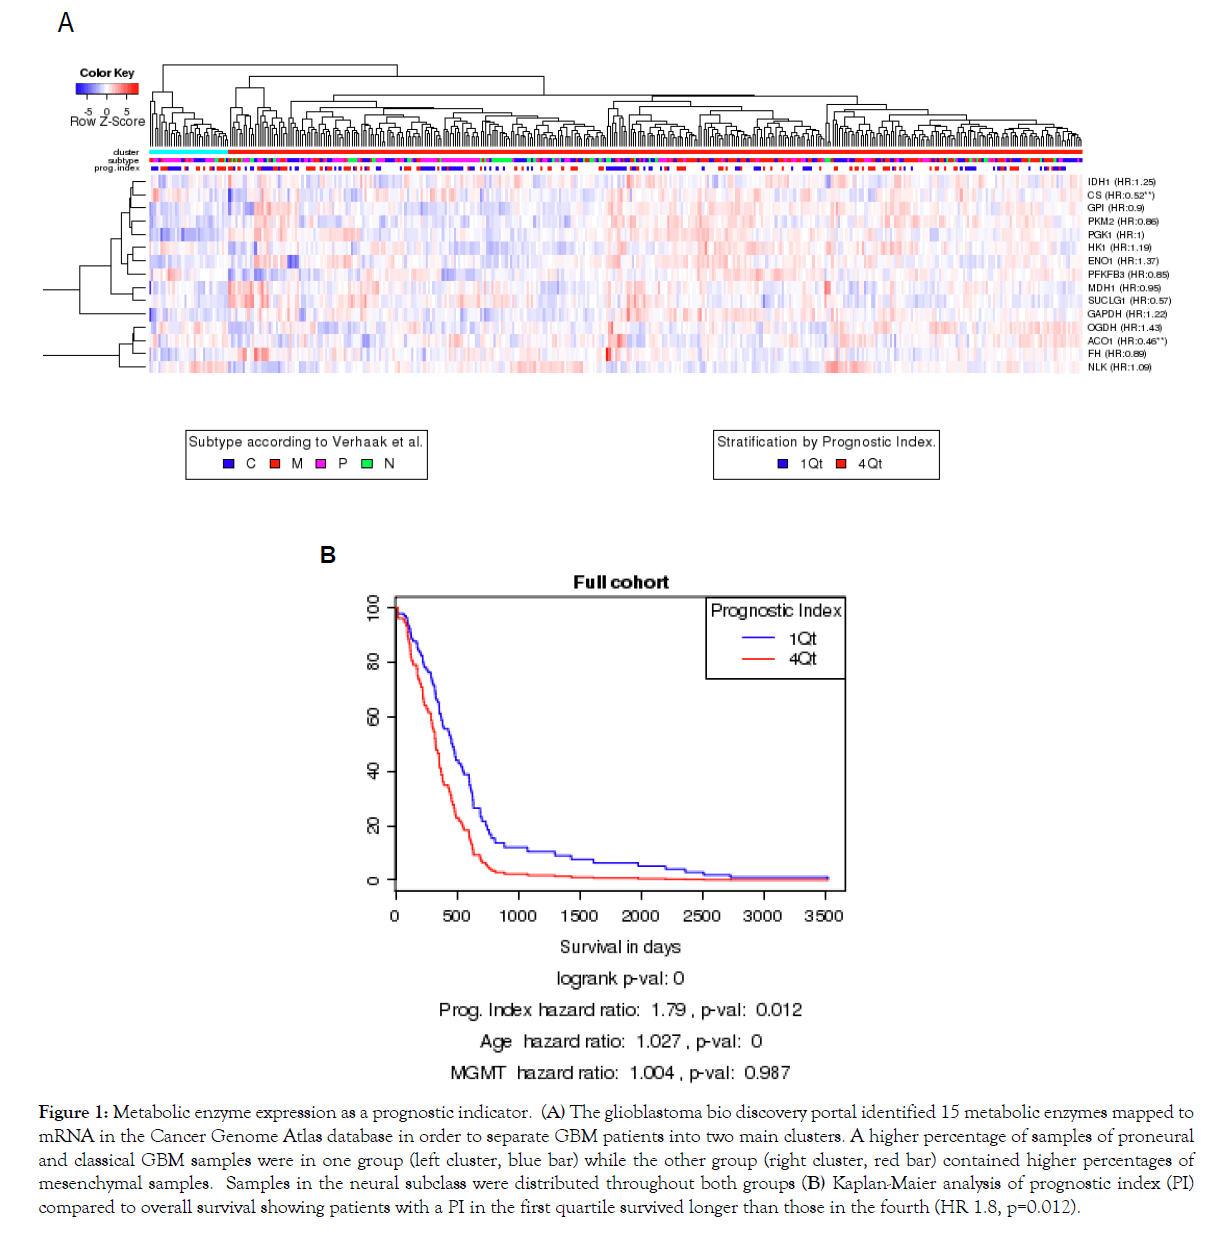
Figure 1: Metabolic enzyme expression as a prognostic indicator. (A) The glioblastoma bio discovery portal identified 15 metabolic enzymes mapped to mRNA in the Cancer Genome Atlas database in order to separate GBM patients into two main clusters. A higher percentage of samples of proneural and classical GBM samples were in one group (left cluster, blue bar) while the other group (right cluster, red bar) contained higher percentages of mesenchymal samples. Samples in the neural subclass were distributed throughout both groups (B) Kaplan-Maier analysis of prognostic index (PI) compared to overall survival showing patients with a PI in the first quartile survived longer than those in the fourth (HR 1.8, p=0.012).
Glioma stem-like cells exhibit a more quiescent metabolic phenotype than GBM cell lines
It has been previously reported that when grown in vitro glioma stem-like cells (GSLCs) have an altered metabolism compared to their differentiated progeny [22]. However, there has not been a direct comparison of GSLCs and traditional glioma cell lines. To determine how the in vitro metabolism of GLSCs differs from that of established GBM tumor cell lines (U87 and U251), a Seahorse XFe96 analyzer was used to measure the oxygen consumption rate (OCR) and the extracellular acidification rate (ECAR) of each cell. As shown in Figure 2, the three GSLCs (923, GBMJ1, and NSC11) had lower OCR and ECAR than either U251 or U87 and also clustered together. To study these differences in greater detail additional Seahorse measurements were made of the NSC11, U251 and U87 cells. As shown in Figures 3A and 3B, NSC11 cells had a significantly lower basal respiration and maximal respiratory capacity than either U87 or U251. Likewise, NSC11 had lower basal glycolysis and glycolytic capacity (Figures 3C and 3D). Taken together, the data suggests that NSC11 has a more quiescent phenotype, U251 a more energetic phenotype, and U87 a more glycolytic phenotype.
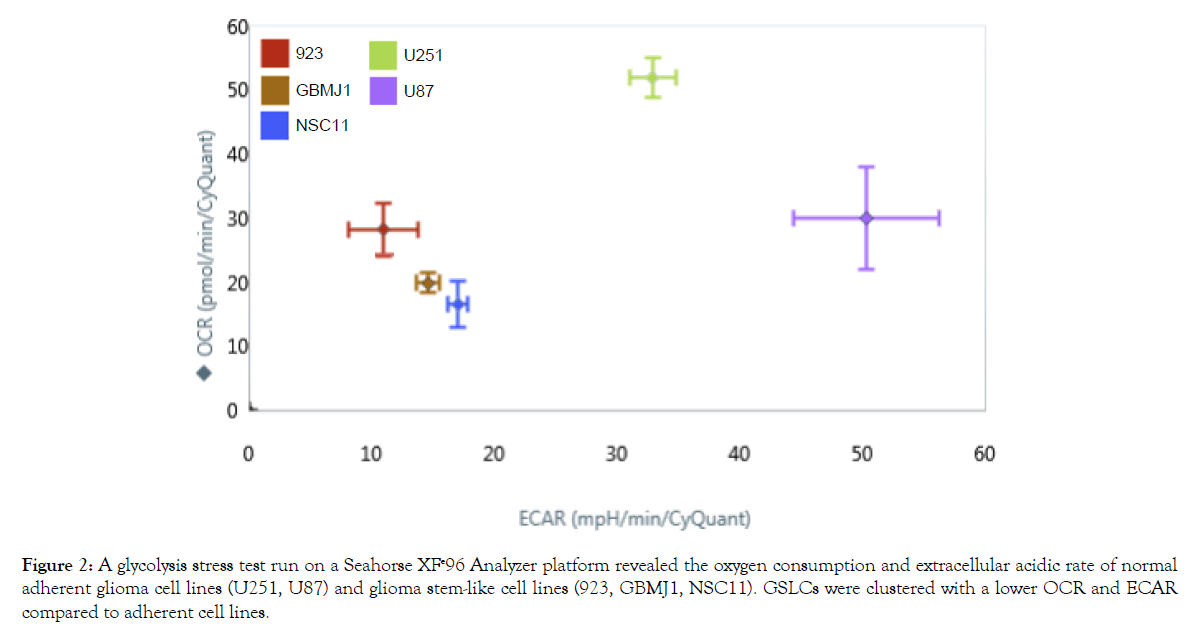
Figure 2: A glycolysis stress test run on a Seahorse XFe96 Analyzer platform revealed the oxygen consumption and extracellular acidic rate of normal adherent glioma cell lines (U251, U87) and glioma stem-like cell lines (923, GBMJ1, NSC11). GSLCs were clustered with a lower OCR and ECAR compared to adherent cell lines.
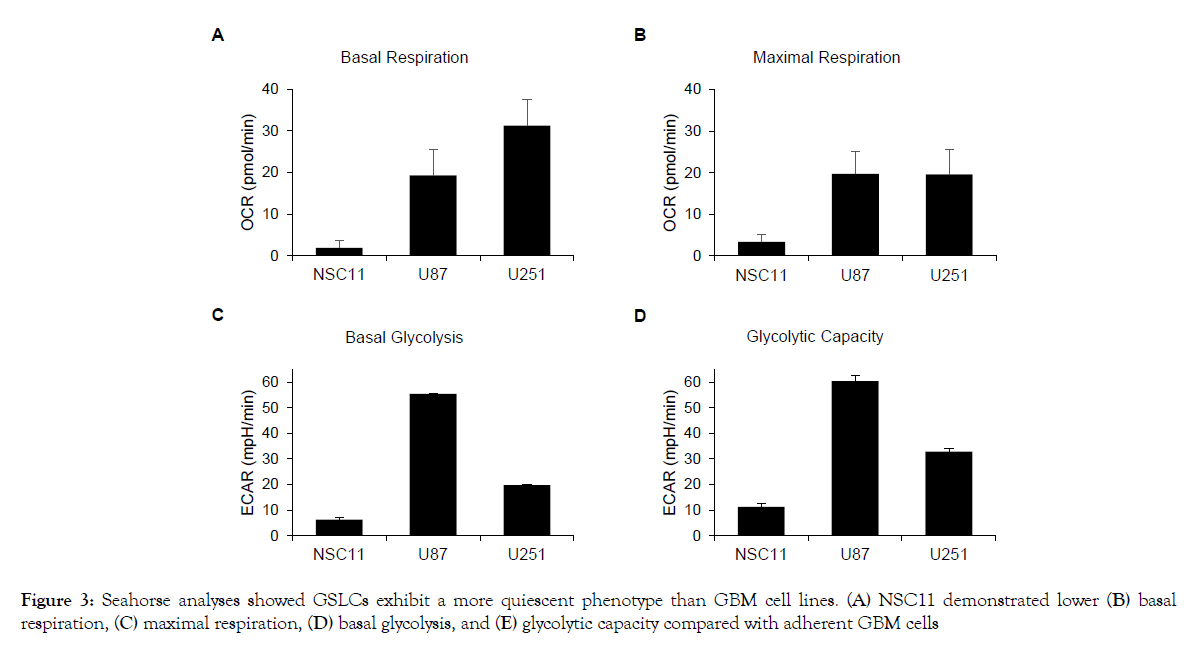
Figure 3: Seahorse analyses showed GSLCs exhibit a more quiescent phenotype than GBM cell lines. (A) NSC11 demonstrated lower (B) basal respiration, (C) maximal respiration, (D) basal glycolysis, and (E) glycolytic capacity compared with adherent GBM cells
To further define these phenotypes, absolute concentrations of cellular metabolites were measured via mass spectrometry. A hierarchical cluster analysis of 116 metabolites showed three distinct patterns for each cell in Figure 4A (the absolute concentrations for each metabolite are listed in Figure 1). The adenylate energy charge, an indicator of active cellular metabolism (calculated from ATP/ADP/AMP levels), was approximately 0.9 for each cell type, which is typical for cells in a metabolic steady state [23] (Figure 4B). Consistent with U251 having a more energetic phenotype, the absolute concentration of GTP and ATP was highest in U251 cells followed by U87 and NSC11 (Figure 4C) (p<0.0001). Highly energetic cells catabolize glutamate via transaminases to synthesize higher levels of non-essential amino acids than their quiescent counterparts [24]. Consistent with this was a higher absolute concentration of non-essential amino acids in U251 compared to U87 or NSC11 (Figure 4D). Conversely, the metabolism of a quiescent phenotype has a higher glutamine/ glutamate ratio [24] as shown to be the case for NSC11 cells in Figure 4E (p<0.01). Concentrations of glycolytic products are shown in Figure 4F, where NSC11 shows significantly lower levels of total glycolytic metabolite concentrations as compared to U87 (p<0.01). Evaluating metabolites involved in the early stages of glycolysis, we observed that U87 cells had the highest glucose 6-phosphate and fructose 6-phosphate concentrations whereas NSC11 had the lowest fructose 6-phosphate and fructose 1,6-bisphosphate concentrations. Despite lower levels of total metabolite concentrations, further exploration into the individual metabolite concentrations (Supplementary Table 1) revealed the NSC11 cell line had higher baseline concentrations of several metabolites involved with glycolysis and the pentose phosphate pathway (glycerol 3-phosphate, glycolic acid, lactic acid, pyruvic acid), galactose metabolism (galactose 1-phosphate, and glucose 1-phosphate), glutaminolysis (folic acid, glutamine, 2-hydroxyglutaric acid, NADH), and the citric acid cycle (succinic acid, and 2-oxoglutaric acid). Thus, the metabolite data is consistent with that derived from the Seahorse measurements concluding that traditional glioma cell lines have a more energetic/glycolytic phenotype and the NSC11 cell line a more quiescent phenotype.
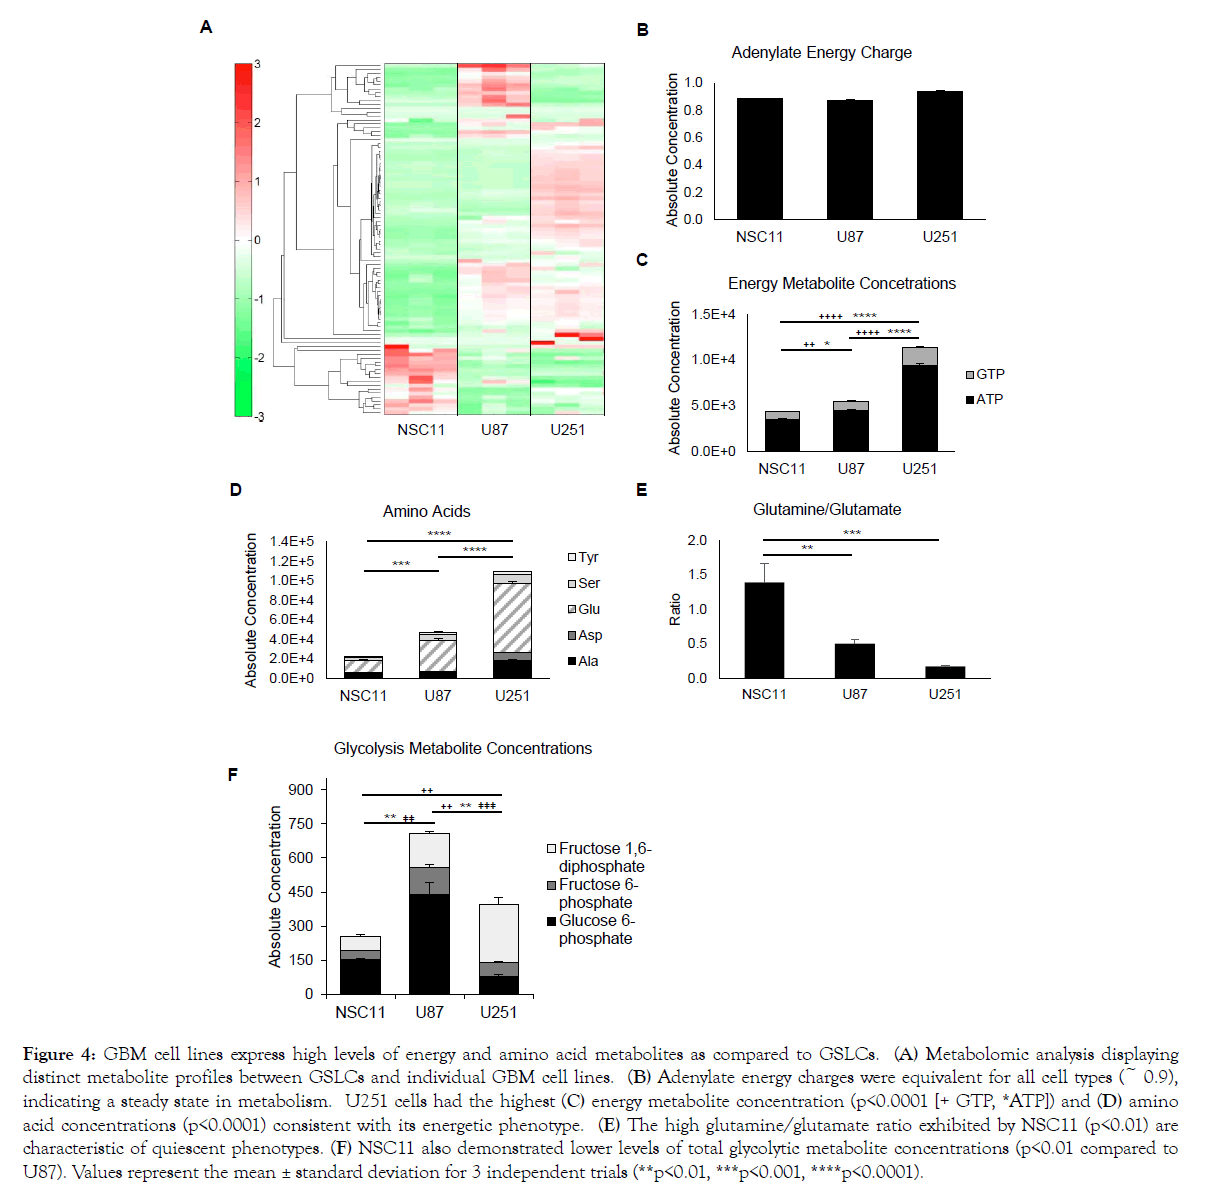
Figure 4: GBM cell lines express high levels of energy and amino acid metabolites as compared to GSLCs. (A) Metabolomic analysis displaying distinct metabolite profiles between GSLCs and individual GBM cell lines. (B) Adenylate energy charges were equivalent for all cell types (~ 0.9), indicating a steady state in metabolism. U251 cells had the highest (C) energy metabolite concentration (p<0.0001 [+ GTP, *ATP]) and (D) amino acid concentrations (p<0.0001) consistent with its energetic phenotype. (E) The high glutamine/glutamate ratio exhibited by NSC11 (p<0.01) are characteristic of quiescent phenotypes. (F) NSC11 also demonstrated lower levels of total glycolytic metabolite concentrations (p<0.01 compared to U87). Values represent the mean ± standard deviation for 3 independent trials (**p<0.01, ***p<0.001, ****p<0.0001).
Changes in GSLC and GBM cell line metabolism following irradiation
To determine if irradiation altered the metabolism of GSLCs or traditional glioma lines in vitro, Seahorse bioanalyses were used to measure changes in OCR and ECAR. After IR, the basal respiration of U87 and NSC11 remained unchanged, however U251 cells had a significant increase (Figure 5A) (p<0.001). For maximal respiratory capacity, the NSC11 cells had an increase, but of lesser magnitude, compared to U251 cells (Figure 5B). For glycolysis measurements, there was a small increase in basal glycolysis and glycolytic capacity in all cell lines (Figures 5C and 5D). To further define the metabolic changes after IR, mass spectrometry was again used to define the absolute concentrations of 116 metabolites. Interestingly, all cell lines maintained their baseline adenylate energy charge, signaling that none of the cell lines were in energy stress after IR (Figure 6A). However, there was an absolute increase in both ATP and GTP in the U251 cells (p<0.0001) (Figure 6B). Conversely, there was little change in the absolute ATP/GTP levels in NSC11 or U87 cells. A similar pattern for the total amino acids was seen with little change in NSC11 or U87 cells and a significant change in the U251 cells (p<0.0001) (Figure 6C). The glutamine/glutamate ratios remained the same as untreated cells for each cell type (Figure 6D). These data indicate that after irradiation the NSC11 cells maintain their quiescent phenotype, the U251 cells shift to a more energetic phenotype, and U87 cells have an intermediate response.
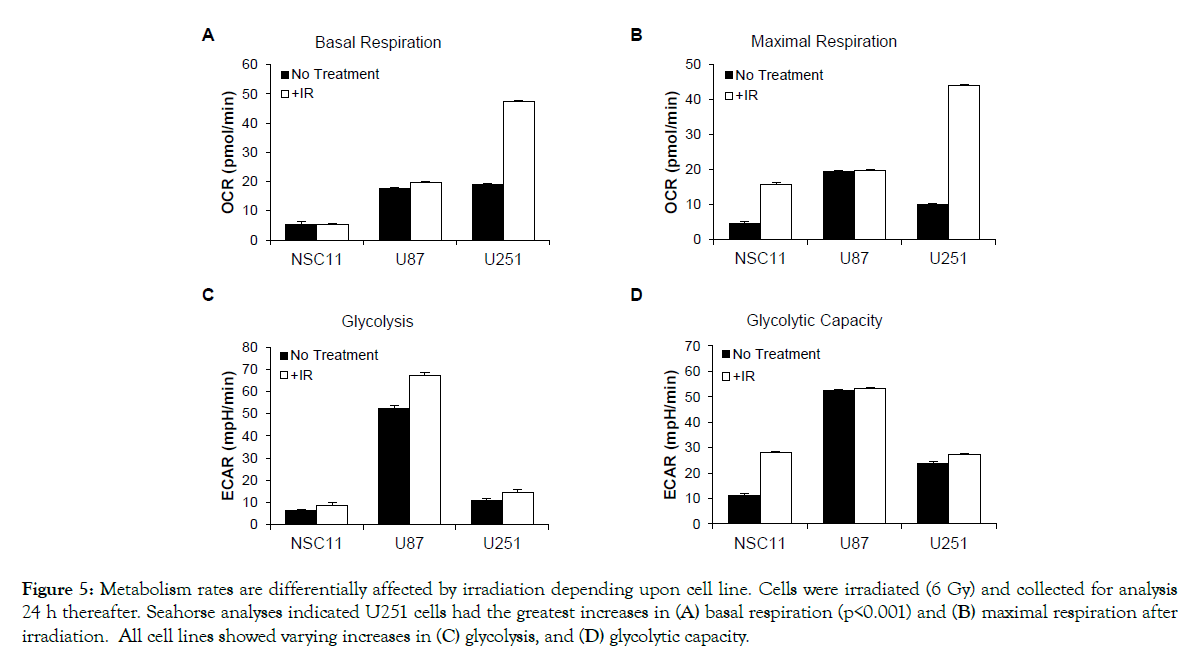
Figure 5: Metabolism rates are differentially affected by irradiation depending upon cell line. Cells were irradiated (6 Gy) and collected for analysis 24 h thereafter. Seahorse analyses indicated U251 cells had the greatest increases in (A) basal respiration (p<0.001) and (B) maximal respiration after irradiation. All cell lines showed varying increases in (C) glycolysis, and (D) glycolytic capacity.
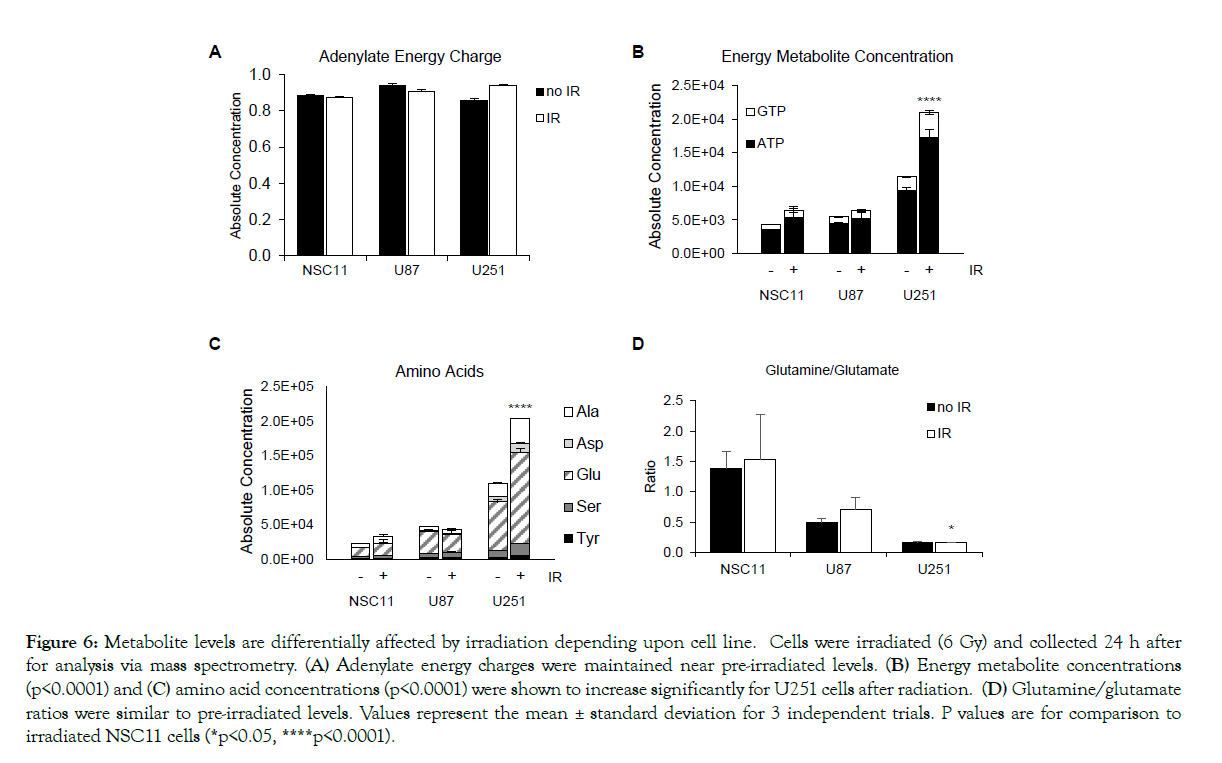
Figure 6: Metabolite levels are differentially affected by irradiation depending upon cell line. Cells were irradiated (6 Gy) and collected 24 h after for analysis via mass spectrometry. (A) Adenylate energy charges were maintained near pre-irradiated levels. (B) Energy metabolite concentrations (p<0.0001) and (C) amino acid concentrations (p<0.0001) were shown to increase significantly for U251 cells after radiation. (D) Glutamine/glutamate ratios were similar to pre-irradiated levels. Values represent the mean ± standard deviation for 3 independent trials. P values are for comparison to irradiated NSC11 cells (*p<0.05, ****p<0.0001).
Our ability to isolate and propagate tumor stem-like cells from glioblastoma has allowed greater study of their intrinsic properties. Previously, the presence of glucose has been shown to significantly increase the number of cancer stem cells while glucose deficiency leads to a reduction of cancer stem cells in vitro [25]. Conflicting studies have shown that GSLCs can be highly glycolytic [26], conversely, others studies have shown a predominance of oxidative phosphorylation when GSLCs are compared to their differentiated counterparts [22]. The goal of this study was to determine the metabolism of traditional glioma tumor cell lines and GSLCs when grown in vitro before and after irradiation.
Using ECAR and OCAR for multiple GSLCs and two traditional cell lines, we found that GSLCs have a more quiescent phenotype, U251 cells a more energetic phenotype, and U87 cells a more glycolytic phenotype. This was confirmed at the metabolite level, with ATP/GTP elevated in U251 cells and an elevated glutamine/ glutamate (GLN/GLU) ratio in GSLCs. This agrees with a previous paper that showed an elevated GLN/GLU ratio in quiescent cells [24]. Additionally, elevated glycolytic metabolites and enzymes were measured in U87 cells compared to either GSLCs or U251 cells consistent with this being the most glycolytically active cell line. The fact that GSLCs generally behave in a less proliferative and more quiescent manner than differentiated tumor cells may confer on GSLCs a survival advantage when faced with treatments that target rapid cell proliferation, such as chemotherapy and radiation [27]. From these in vitro studies one can hypothesize that U87 cells would be more sensitive to drugs that inhibit glycolysis. Similarly, as glutamine serves several functions in cancer stem cells including providing an alternative source for components used in the TCA cycle, nitrogen, and components for the suppression of mitochondrial reactive oxygen [28], it could be hypothesized that NSC11 cells would be more sensitive to drugs that inhibit GLN/GLU pathways. Glutamine metabolism and mitochondrial function have been the focus of several studies for the treatment of GBM including the inhibition of GLN/GLU pathways directly or indirectly through the inhibition of mTOR in cancer stem cells [29-31].
After irradiation there was little change in metabolism for the NSC11 or U87 cell lines as measured by ECAR and OCAR but for U251 cells there was a large increase in both basal and maximal respiration leading to a more energetic phenotype. Total metabolite concentrations were also steady for NSC11 and U87 cells but in U251 cells there were large shifts noted, with increases in many metabolites including an increase of 80% for GTP/ATP and 100% for the common amino acids. Prior studies of irradiated U251 and U87 showed a shift in the metabolism of both cell lines but this effect was after much higher doses of irradiation (12-20 Gy) making a direct comparison with our data difficult [32,33]. Of note, the GLN/GLU ratio in the NSC11 cells was unchanged after irradiation implying that the NSC11 cells maintained their quiescent phenotype after this treatment.
To date clinicians have used clinical features and genomic signatures to define the subgroups of glioma. As functional imaging improves and allows for real-time metabolic imaging the possibility of including metabolic signatures to enhance diagnosis or monitor treatment response might become a reality. While there is not one metabolic alteration that distinguishes irradiated GSLC metabolism from that of GBM cell lines, therapies targeting more metabolically quiescent tumor cells and thus the resistant GSLC population may increase a cancer’s sensitivity to radiotherapy.
Citation: Spehalski EI, Lee JA, Peters C, Tofilon P, Camphausen K (2019) The Quiescent Metabolic Phenotype of Glioma Stem Cells. J Proteomics Bioinform 12:6. DOI: 10.35248/0974-276X.19.12.502
Received: 20-Jul-2019 Accepted: 06-Aug-2019 Published: 13-Aug-2019 , DOI: 10.35248/0974-276X.19.12.502
Copyright: © 2019 Spehalski EI, et al. This is an open-access article distributed under the terms of the Creative Commons Attribution License, which permits unrestricted use, distribution, and reproduction in any medium, provided the original author and source are credited.