Journal of Tourism & Hospitality
Open Access
ISSN: 2167-0269
ISSN: 2167-0269
Research Article - (2017) Volume 6, Issue 5
To determine the exogenous and endogenous latent constructs of tourism destination competitiveness (TDC), Partial Least Square (PLS) path modeling of the Structural Equation Modeling (SEM) is used with a 2013 data of 78 economies. Siding to a post-positivism research paradigm, the following conclusions are drawn. The exogenous latent construct “urbanization” is found to have a strong, positive and direct effect on the outcome variable which signifies that the number of worldwide psycho-centric tourists is marginally higher than allo-centric and mid-centric tourists together, which has great policy and marketing implications. The path relationship between demand conditions and TDC was found statistically significant, but negative. The exogenous latent construct “complementary conditions” took the first rank on the power of explaining TDC. This confirms the theoretical postulate that this construct amplifies Impulse Travel Decision of highly spending tourists which increases spending per arrival ratio and thereby to TDC.
<Keywords: Tourism destination competitiveness; Urbanization; Structural equation modeling
The current study resides in the following domains of the Tourism Management Discipline:
• Tourism Policy Development and Management
• Tourism Economics
Background of the study
In the contemporary world economy, the tourism sector has become a significant driver of social, technological and economic development, Dwyer and Kim [1]. Statistics state it that one in every eleven jobs in the world is in travel and tourism, Christie, et al. [2]. The sector is mainly acknowledged for benefitting women and young people and thereby to poverty alleviation, Gomezelj and Mihali? [3].
However, to reap the full potential of the tourism sector it demands enhancing its competitiveness in the vastly more complex world tourism market with a multiplicity of players involved in the delivery of the service, Dwyer, Forsyth and Rao [4]. The product of the tourism sector is an experience that is delivered not by a single firm but by so many actors involved in a destination from departure to return. The satisfaction of tourists is the combined result of the diverse services they get during their stay by different providers with vastly great variety of product attributes and ranges. Here one can see the different goals of service providers (short or long term profit, exploiting or satisfying), different goals of destination mangers (economic or social return), and the uniqueness of tourists’ interest as they come from different background and corners of the world which makes it difficult to manage destination competitiveness, Crouch [5]. The dynamics and complexity of the sector has, therefore, required an ongoing study of Destination Competitiveness, Namhyun [6]. As a result, TDC has become scholars’ major topic of interest since Porter [7]. Different theories, concepts, paradigms of thinking, on how TDC need to be explained and measured, have emerged during the 1990s and afterwards.
Through these paradigms and dynamics of on-going debates, TDC has become a great a field of inquiry in the Tourism Discipline.
Despite the evolvement on different models, there are fostered debates on comprehensiveness of indicators, the question of practicalities, their policy relevance, measurability, data comparability, time and place variance, and rankings of attributes. This study is an extension of the warm an inconclusive debate about the exhaustion of variables and their rankings.
Statement of the problem
A pattern of observation from the literature review is that though a great insight is provided by all the scientists to explain tourism destination competitiveness, there are still some interesting and relevant problems to be addressed. The variations on the great body of researches and theories indicate that TDC cannot be boiled down to a small set of agreed determinants.
One critical gap identified is, therefore, that the effort of different authors to rank the indicators has resulted in a significantly different output for all. This deserves verification as there are many variables which are relevant to be factored into the model but with varied level of importance in determining TDC. There is a need for considering which one factor and how has a leveraging effect on competitiveness. The fact is some factors may be sine qua non but not sufficient, others could be factored neither to push nor to pull model but could be amplifiers, Ritchie and Crouch [8].
Second observation, ever since the pioneering time, in all these models, the inclusion of urbanization in the TDC model has been scarcely debated and investigated from the theoretical point of view, to the author´s knowledge. It is one critical dimension that previous studies and theories missed.
The postulate for the factorization of urbanization into the models depends on the fact that TDChas for many years been controlled by the urbanized economies mainly Europe and the Americas. In 2012, for example, Europe and the Americas together took 63% of world Tourism Revenue while the African counterpart took 3% share of the total, UNWTO [9]. As these regions are more urbanized than Africa, this scenario posed the postulate that urbanization could be factored on to the model of tourism destination competitiveness.
Therefore, this study aimed to test a structural equation model (SEM) of TDC including urbanization as factor which contributes to the extension of the existing TDC models. This is how the current study resulted in an original contribution of new knowledge in the field of inquiry by extending its comprehensiveness when considering the factorization of urbanization into the model.
H0: The coefficient of urbanization parameter β on the path relationship with TDC is statistically not different from zero, i.e. β=0.
H0: There is no statistically significant direct path relationship between demand conditions and TDC.
This part indicates the knowledge on literatures relevant to the chosen field of study; the current state of knowledge and its limitation, the main elements of the proposed endeavor in the context of the current knowledge, demonstrate how this research fit into the broad framework of theory and the extent to which the current study results in an original contribution to new knowledge in the field of study. It starts from how TDC is operationalized in this paper, the pioneer contributors, theoretical literature and completes it with empirical literatures.
Definition of TDC
In this paper, TDC is understood in the widely accepted definition suggested by Ritchie and Crouch [8] i.e. “a destination’s ability to increase tourism expenditure, to increasingly attract visitors while providing them with satisfying, memorable experiences, and to do so in a profitable way, while enhancing the well-being of destination residents and preserving the natural capital of the destination for future generations” (p. 2).
Theoretical literature
In the 1990s, Porter brought up a brand new topic domain of inquiry pioneering the idea of firm and national competitiveness and developing a theoretical and conceptual basis. Porter has contributed significantly to the literature by providing a comprehensive understanding of his competitiveness and presenting it in a diamond model.
Though Porter is the pioneer of general competitiveness model, he was followed by so many Tourism Management scientists from around the world to examine the model’s application into TDC.
Pioneering contributors of TDC theory
Though this study has its own original contributions, it doesn’t bring up a brand new topic domain for discussion. It is rather an extension of an idea pioneered by so many scientists from around the world. Some of the dominant and pioneering contributors to TDC on developing a theoretical basis include, but not limited to, Crouch and Ritchie [8], Cores and Rivera [10], WEF [11], Poon [12], Hassan [13], and Heath [14].
They are the reason for the emergence of different theories, paradigms of thinking, frameworks and models that serve as auxiliary on the insights of how destination competitiveness need to be explained and measured. They are the reason for triggering interest to other theoreticians and academician on growing the topic to a greater field of inquiry. The pioneering and dominant models and contributors to a theoretical framework on TDC include the following.
The Ritchie and Crouch’s model of TDC
The Ritchie and Crouch model is the most frequently cited model of TDC that has relatively tried to include relevant predictor which has a critical significance in the eye of scientific inquiry.
According to Ritchie and Crouch model [8], this conceptual model of TDC has about 36 attributes classified into six key factors. Core resources and attractors, Supporting factors and resources, Destination policy, planning and development, Destination management and Qualifiers and amplifiers
The variables in the model explain and measure more direct and immediate impact than the macro environment elements. Of course, this kind of presentation has pros and cons. The good part of taking the factors that have direct impact makes a very clear understanding to interpreters while its weakness is that it doesn’t pinpoint the root of the phenomenon that limits the sight of perfect intervention by top policy makers.
General critics of the Ritchie and Crouch’s model of TDC
Though Ritchie and Crouch [8] have come with a broad scope of coverage on the TDC model, there is still a need to better understand the relative importance of the attributes of competitiveness, thereby strategies for improving TDC could consider where and how limited resources should be directed. Ideas that help to identify which attributes are likely to influence TDC most effectively, are of great value. Given the scarcity of resources, it is wise that efforts should be accumulated and put on leveraging indexes so others can be enhanced along with in the process. However, despite the great moves of these scientists, such kind of scrutiny is not seen in the model which would have answered how to scrutiny the composition of the industry structure so that enhancing some indexes could mean enhancing the competitiveness of the different categories in the sector.
Another related claim of incompleteness to this model is that it has not acknowledged the interactions between different indicators and there is no waiting to a factor as per the importance level of each factor to competitiveness. Factors can also be classified as threshold and sine qua non. Threshold and sine qua non is a classification of an indicator is a depiction that asserts a level of any indicator because of which tourists risk the unavailability of another indicator, or where tourists’ propensity to be affected by that variable becomes in elastic after a certain level of another indicator. This kind of analysis is not given in this model which would have greatly benefited policy makers.
This model is claimed to overlook, the demand conditions which are frequently pronounced in the following other models. It has also slipped away the impact of globalization and urbanization on competitiveness.
Finally, it would complete the work of Ritchie and Crouch, had it been beyond the listings of variables in a way that explains variable measurability, availability of reliable data and the flexibility to inculcate other variables like urbanization in order to operationalize the model.
The Dwyer and Kim’s integrated model of TDC
The second dominant model is the Dwyer and Kim’s Integrated Model of TDC developed in 2003. It has four general attributes; core resources, destination management, demand conditions, situational conditions. The Model came up with a brand new generic variable called Demand Conditions. These scientists recognized the demand condition as an important determinant of TDC which the Crouch- Ritchie model seems to neglect. This model also separates between tourism infrastructure and general infrastructure which are under the label “superstructure” of the Core Resources and Attractors in the Crouch-Ritchie model
General critics of the Dwyer and Kim’s integrated model TDC
On basic understanding, the model structure and content of this model are more or less in favor of Ritchie and Crouch’s Model except in that this model has included the generic variable of “Demand Condition” and has more of a macro view with better scrutiny of the generic variables into components.
Hence, all the general criticisms of the Ritchie and Crouch’s Model (other that demand condition and macro perspective) also apply here. Therefore, considering these criticisms would complete the work of Dwyer and Kim’s Integrated Model.
The WEF travel and tourism competitiveness index (TTCI)
This index of travel and tourism competitiveness is the major well organized undertaking at international level. In this model, there is a crystal-clear way of measuring a given destination as to what to embrace to be a competitive, Dupeyras and MacCallum [15].
This has fourteen pillars that measures countries TDC through quantitative indicators which is started in 2007. The index has three sub-indexes. Sub-index A: The travel and tourism regulatory framework; Sub-index B: The travel and tourism business environment and infrastructure and Sub-index C: The travel and tourism human, cultural and natural resources
The main strength of this model is that it has magnificently devoted into going beyond the listing of indicators to methodological development for analysis and policy purpose. As a result, there is anonymous acceptance of these indexes by many tourism management scientists around the world.
General critics of the WEF travel and tourism competitiveness index
Though the WEF Travel and Tourism Competitiveness Index is the best existing index in terms of comprehensiveness and methodological development, they are not second to none and deserve some more attentions to be complete.
One criticism is the quantification of all variables and the use of proxy value for immeasurable variables. In the index, the indicators with no quantitative value are given a proxy value where numerical proxies may not exhaustively show the exact value of the fact. Proxy scores of the indicators means the nearest numerical value of the variable but doesn’t show its exact value which leads that their impact can be under or over estimated.
Another point of unfavorable indexing is that some proxies used in an index measure the intervention level made on a factor which is just one step and an input observation. Example of this type is “percentage of government budget” as a proxy to government’s prioritization to travel and tourism. An output may not be achieved or implementation may not be completed but a destination is considered competitive just because an input is observed. So, such indicators are misleading which may not equally contribute as the value assigned to them.
Other model of measuring competitiveness
Though the dominant conceptual models of TDC are the above three, there are other models that contributed their part to the literature. To mention a few: 1. The Omerzel’s model developed in 2006 which is tailored to fit the contest of small tourism destinations of Slovenia; 2. The De Keyser and Vanhove Model [16] developed in 1994 focusing the macroeconomics factors that incline to the importance of institutions and institutional infrastructures; 3. Hassan’s model [13] developed in 2000 that inclines to the importance of environmental sustainability, ecological concepts and human development 4. Heath’s model [14] developed in 2002 which inclines to a strategic framework. Thematically, these all models have major resemblance with the above models.
Empirical literature
TDC is also not constrained to theories, paradigms of thinking and frameworks. Ever since the development of the theories, many tourism researchers became critical on explaining, measuring, analyzing data and comparing destinations. A great deal of research has been conducted in different part of the world to develop an empirical auxiliary on the theoretical insights of this regard. This way, not only became an area of interest to theoreticians but also a growing field of investigation for researchers. The contemporary TDC paradigms have developed to the point that researches are done to structure and purify the composition of the attributes, rank their relative weight, distilling them into threshold impact, cross country effect and time effect and many more advanced way of looking at the variables.
Crouch [5] found that the impact of a TDC attribute on the relative performance of a destination is a function of both the importance of the factors as well as the degree to which destinations vary on the factors. He claims that although an attribute may be considered to be important, it will not be a determinant of TDC if there is little difference among destinations on the factors. Kayar and Kozak [17] made a study aimed on detecting the more and less effective determinants taking the Travel and Tourism Competitiveness Index 2007. Their finding reveals that the most effective factors of TDC were air transport infrastructure, natural and cultural resources, ground transport infrastructure, and health and hygiene, respectively. The less effective determinants of the TDC were environmental regulation, ICT infrastructure, safety and security, and policy rules and regulations. Mihalic [18], in her study of destination competitiveness, claimed that scenery, natural hydrologic structures, clean water, fresh air and species diversity. Crouch and Ritchie [8] found that TDC is directly dependent on the level of economic, social and environmental conditions offered to residents. Kozak and Rimmington [19] found that the friendliness of local people, value for money, safety and security, local transport, natural environment were consequently ranked.
Another paradigm in the study of TDC is the devotion of specific study to specific elements like; geographically to regions, cities; sector wise to hotel, spa; conceptually to price, environment and demand.
This way, different empirical and theoretical literature has contributed to the dependent and independent variable filtration of the current study.
Research paradigm
There is a philosophical approach that underpins this study which is the paradigm in which the work is grounded. By paradigm it means the overall view held by the researcher of how the world works [20] or a basic set of beliefs that guides action taken in a disciplined inquiry Guba [21].
The research paradigm of this study is Post Positivism. This paradigm strives to generate outcomes that apply to the wider population than the sample used Cresswell and Clark [22] and uses mathematical calculations to make generalizations based upon the analysis of probability. Veal [23] the Post Positivism paradigm is explained below
Research design, sampling and inclusion criteria
Semi-explanatory research design is used in this study given that it is based on existing literatures and models as well as there is huge empirical study and theoretical backgrounds regarding the issue on all of the exogenous latent constructs other than “Urbanization”. The fact that urbanization has no prior literatures makes this exogenous construct as exploratory and all in all the design is semi-explanatory which mixed both designs.
As to the sampling, 78 countries from all over the world were taken as a sample. The inclusion criteria was covering all the countries as long as a country has a data of all the TDC indexes in the TTCI of the year 2013, the urbanization data of the countries and the data of the dependent variables(International tourist arrival and tourism revenue) in the world bank data base for the same year. This study has 5 exogenous latent constructs. Ken [24] stated that if the number of exogenous constructs is 5 then, the minimum sample size should be 70. This paper takes 78 sample size which makes the sampling process of this paper meaningful. The list of countries included in the sample is annexed to this paper.
Missing value treatment method
Missing values are treated using the Case wise Deletion Method (sometimes called list-wise deletion) which deletes each row (i.e., case, response, observation) that contains a missing value. Only the remaining data are used for computations.
This method has the disadvantage of changing the sample size, precision and power of the estimates and the sample mean of variables. However the case-wise deletion missing value treating strategy is a very conservative and accurate with consistent sample size for each analysis across parameter estimations. Hence, the sample size 78 is a final and reduced size after missing value is treated.
Model specification of the SEM theorem
Partial Least Square (PLS) path modeling of the SEM was used because it best when; sample size is small, applications have little available theory, predictive accuracy is paramount, correct model specification cannot be ensured and when there is non-normal distributional assumption of the data [25-27].
The PLS model has two kinds of measurement models: reflective and formative. This study used the reflective model as the indicators of the exogenous latent variable are highly correlated and interchangeable among themselves. So, the causality direction goes with arrows pointing away from the blue-color latent variable to the yellow-color indicators. The reflective outer model is specified as:
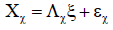
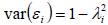
Where X is Latent Variables, Λ (capital lambda) denotes the loading coefficients, and ξ (small letter xi) is the vector of latent variables, and ε (epsilon) is the residual.
The reflective inner model is specified as follow;

Where η (small letter eta) is endogenous variables, Β denotes the matrix of coefficients of their relationships, ξ (small letter xi) is the vector of latent variables, and ζ (small letter zeta) represents the structural model residuals.
Data for the independent variables other than the urbanization variables was used from the WEF’s 2013 TTCI data. For the dependent variables and urbanization, data was gained from the World Bank.
After the data was cleaned and arranged using Microsoft Excel, it was processed by a PLS data processing package called SMARTPL (Sversion 3).
Limitations of the study
The score of the independent variables on different countries other than the urbanization data are captured from the World Economic Forum (WEF). The scores of the measures are therefore only as good as the implicit assumptions of the WEF. As the study uses secondary data source, the quality of the data wholly depends on the previous source of data (Table 1).
| Independent Variables (Abbreviated for Software use purpose) | Measurement |
|---|---|
| Core Resources and Attractions (CRA) | |
| 1. NWHeritage | Number of World Heritage natural sites in the country |
| 2. Qenv't | Quality of the natural environment. How would you assess the quality of the natural environment in your country? (1=extremely poor; 7=among the world’s most pristine |
| 3. TtlSpecies | The total known species of mammals, birds, and amphibians in the country |
| 4. CWHeritage | Number of World Heritage cultural sites and Oral and Intangible Heritage |
| 5. Sports | The ratio of total seats for all major sports stadiums in the country to the total population (in millions) |
| 6. FairsExh | The number of international fairs and exhibitions held |
| Complementary Conditions (CC) | |
| 7. TrsmInfra | Number of hotel rooms per 100 people, the presence of seven major car rental companies and number of automated teller machines (ATMs) accepting Visa credit cards per million people |
| 8. AirInfra | Quality of air transport infrastructure, an airline’s passenger-carrying capacity, number of departures per 1,000 population, airport density, number of operating airlines, and international air transport network |
| 9. GrndInfra | Quality of roads, quality of railroad infrastructure, quality of port infrastructure, quality of ground transport network, and road density. |
| 10. ICT Infra | Extent of business internet use, internet users, telephone lines, broadband internet subscribers, and mobile telephone subscribers |
| 11. AttitudeP | Attitude of population towards foreign visitors measured by “How welcome are foreign visitors in the country?” (1=very unwelcome; 7=very welcome) |
| Destination Management (DM) | |
| 12. TPrioritiza | Destination marketing and branding, the availability of the travel and tourism data, and government prioritization of the travel and tourism industry |
| 13. Qeduc | Quality of the educational system: How well does the educational system in a country meet the needs of a competitive economy? (1=not well at all; 7=very well) (2013 weighted average) |
| 14. TResearch | Local availability of specialized research and training services: To what extent are high-quality, specialized training services available in the country? (1=not available; 7=widely available) |
| 15. Ttraining | Extent of staff training: To what extent do companies in the country invest in training and employee development? (1=hardly at all; 7=to a great extent) |
| 16. TSustainabty | Sustainability of T&T development: How would one assess the effectiveness of a government’s efforts to ensure that the T&T sector is being developed in a sustainable way? (1=very ineffective; 7=very effective) |
| 17. Env'tTrty | Total number of ratified environmental treaties |
| Demand Condition (DC) | |
| 18. PPP* | Ratio of purchasing power parity (PPP) conversion factor to official exchange rate |
| 19. FuelPr | Retail diesel fuel prices (US cents per liter) |
| 20. HotelPr | Hotel Price Index Average room rates calculated for first-class branded hotels for calendar year, in US dollars |
| Urbanization (UR) | |
| 21. UrbPpn | Population in the largest city (% of urban population) |
| 22. UrAglumer | Population in urban agglomerations of more than 1 million |
*Indicates that reverse coding is used for this variable.
Table 1: Independent Variables and their Measurement. Notes: Details are presented in the 2013 TTCI Report of the World Economic Forum (WEF).
Dependent variables and their measurement
TDC can be measured by market share of international tourist arrivals, international tourism receipts [5] and tourism receipt per arrival, Namhyun [6].
However, taking one element of the indicators alone would create a skewed representation of reality. For example, a country which has high number of international tourist arrivals may have less number of international tourist receipt because of the reason that the country attracts price sensitive tourists or its services are so cheap in price that the country is getting exploited which is literally unsustainable and uncompetitive form of tourism. Similar logic applies with the other way round of the argument and with the other indicators as well. Mazanec, et al. [28], for example, considered TDC dimensions as a latent construct and included three variables: market share based on international arrivals, tourism growth, and distance-weighted market share. Tourism receipt per arrival is a better parameter but that doesn’t acknowledge the value of international tourist arrival alone or international tourist receipt alone.
Therefore, with the mind of mitigating such problems, this study has considered measuring TDC based on three basic indicators merged as a latent construct which better TDC. They are; market share of international tourist arrivals (Total International Tourism Arrivals of a country per Total International Tourists of the 78 countries), market share of international tourism receipts (Total International Tourism Receipt of a country per Total International Tourism Receipt of the 78 countries) and international tourism receipt of a country per international tourist arrival of that country.
How they are used in the latent construct model is illustrated in the following Table 2.
| Dependent Variable (TDC) abbreviated for software purpose | Measurement |
|---|---|
| 23. ShareReven | Market share based on international arrivals in a destination |
| 24. ShareTArri | Market share based on international tourism receipts in a destination |
| 25. RevenperArri | Tourism revenue/spending per arrival in a destination (US$) |
Table 2:Dependent variables and their measurement.
Inner model path coefficient size and analysis of hypotheses testing
The number 0.671 in the center blue circle of the above diagram shows how much of the variation on the endogenous latent variable (TDC) is being explained by the exogenous latent variables. Therefore, 67.1% of the total variation on the endogenous latent variable is explained by the five exogenous latent variables (Figure 1).

Figure 1: Path modeling. Source: Own computation.
The values on the arrows are the path coefficients of the constructs and these values explain how strong the effect of one variable is on another variable.
Path coefficient matrix of the inner model diagram 1suggest that CC(Complementary Conditions), CRA(Core Resources and Attractions) and UR (Urbanization)have positive and direct effect on the dependent variable (0.555 and 0.451, 0.218 respectively) indicating that a high level of these latent constructs contribute to an increase in TDC.
In the first test it is found that the exogenous latent construct “complementary conditions” took the first rank on the power of explaining TDC with a path coefficient value of 0.555 indicating its greater importance for destination competitiveness.
The second tested exogenous latent construct is urbanization. It is found to have a strong, positive and direct effect on the dependent variable with a path coefficient value of 0.218 indicating that an increase in the level of the urbanization contributes to an increase in tourism destination competitiveness.
Therefore, the null hypotheses that “The coefficient of urbanization parameter β on the path relationship with TDC is statistically not different from zero, i.e. β=0” is rejected or declined.
The third test was the direct path relationship between destination management and TDC which is found to be statistically insignificant with a standardized path coefficient value of 0.084 which is lower than the accepted vale (0.2).
Finally, the path relationship between demand conditions and TDC was found statistically significant, but negative. This indicates that a high level of these latent constructs contributes to a decrease in tourism destination competitiveness. Therefore, the null hypotheses “There is no statistically significant direct path relationship between demand conditions and tourism destination competitiveness” is rejected (Tables 3 and 4).
| Ontologically (Nature of Reality, Being and Truth) | •There is an objective external reality which is independent of human’s thinking and out of personal value systems •Researcher sees people as phenomena to be studied from the outside and behavior to be explained on the basis of facts •Strives towards single view point •No relativism •Begins with a hypothesis and then gathers the required data to test this hypothesis against data •Generates outcome that apply to the wider population than the sample |
| Epistemologically (Relationship between the researcher and the researched) | •The researcher has neutral role on the researched •Dualism/objectivism - knower and known independence and separable •Distance/not close and impartiality- data collected objectively •Findings are probably true - not emergent/created, not mediated by values, •Participants are not treated as collaborators •Reality not co-constructed with participants |
| Axiologically (Role of Values) | •Value-free inquiry - their influence is controlled, no bias, •Not guided by social justice - not value bounded. •No negotiation with participants about interpretation |
| Methodologically (Methods to investigate reality) | •employed quantitative statistics and calculation of probabilityto go for generating knowledge •Test of prior hypothesis and theory •Not participatory |
Table 3: Research paradigm.
Graph of the path coefficients is annexed to this paper (Annexure).
As elaborated in Table 4, correlation among main predictor variables is positive. Hence, logic dictates us to use correlation as suggestive of ample relationship between TDC and the predictors, as long as one factor is positively associated to TDC. Accordingly, the values from the table are in support of this claim. The values range from 0.142 which is a correlation value of TDC and DC to 0.655 that is a correlation value of TDC and CC. Besides, all values are statistically significant. A word of caution is important, for the values are rather correlation of endogenous latent variables; variables that are not measurable by themselves. Thus, 0.655 which is a correlation between TDC and CC is association value of the indicators of TDC and indicators comprised in CC. The same explanation applies to the rest correlation values (Table 5).
| CC | CRA | DC | DM | 1 DC | UR | |
|---|---|---|---|---|---|---|
| CC | 1.000 | |||||
| CRA | 0.161 | 1.000 | ||||
| DC | 0236 | 0.487 | 1.000 | |||
| DM | 0.385 | 0373 | 0.501 | 1A00 | ||
| TDC | 0.655 | 0.483 | 0.142 | 0.369 | 1.020 | |
| UR | 0205 | 0.058 | .0197 | 0036 | 0.402 | 1000 |
Table 4: Latent variables correlation test. Source: own computation.
| Adjusted R Square | |
|---|---|
| TDC | 0.648 |
Table 5: Adjusted R-square test. Source: Own computation.
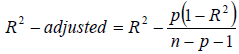
The coefficient of determination, R2, of the endogenous latent variable is found to be 0.671. This means that the five exogenous latent variables explain 67.1% of the variation in TDC. According to Chin [29], R2 values of 0.67, 0.33, and 0.19 in PLS path models are substantial, moderate, and weak, respectively. However, R2is such floating measure that its value increases even if an irrelevant predictor is added. Therefore, adjusted R2 is used to penalize the irrelevance and mitigate out the false additional contribution of the predictor variable added.
Accordingly, the Adjusted R2 is calculated using the following formula;
Where,
R2=Unadjusted R-square.
n=sample size which is 78, after missing value treatment.
p=number of predictor variables (latent constructs) which is 5 in this model.
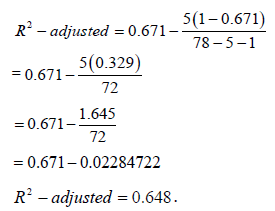
This means that the five exogenous latent variables have a 64.8% penalized, adjusted and true value of explaining the variation in TDC unconditional to an irrelevant additional predictor.
This demonstrates that the overall model is substantially capable of explaining the endogenous latent constructs of TDC.
Validity tests
In this paper, internal validity tests are conducted to confirm the research design measures what is intended to measure and whether the total variations found reflect true variations.
Qualitatively it is found that, this paper establishes content validity as the instrument contains a representative sample of the universe which is adequate as to the principle of sampling for PLS. As the criterion gives each subject an equal opportunity to score and the information specified by the criterion is available, criterion-related validity is also established. Quantitatively, the following two measures of validity expressed the soundness of the measure.
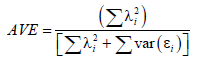
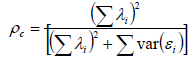
Convergence validity (average variance extracted): Henseler et al. [30] indicate that Average Variance Extracted can be calculated using the following formula:
Where;
 is the component(outer) loading to an indicator,
 in case of standardized indicators.
Henseler et al. (2009) put that the average variance extracted should be higher than 0.5.
From Table 6, it is found that most of the AVE values are greater than the acceptable threshold of 0.5, so convergent validity is confirmed.
| AVE | |
|---|---|
| CC | 0.635 |
| CRA | 0.353 |
| DC | 0.502 |
| DM | 0.391 |
| TDC | 0.632 |
| UR | 0.519 |
Table 6: Average variance extracted (AVE). Source: Own computation.
Discriminant validity: Fornell and Larcker suggest that the square root of AVE in each latent variable can be used to establish discriminant validity. To do this, AVE is calculated and written on the upper diagonal of the table. The correlations between the latent variables are placed in the lower left triangle of Table 7.
| CC | CM | DC | DM | TDC | UR | |
|---|---|---|---|---|---|---|
| CC | 0.797 | |||||
| CRA | 0.161 | 0.594 | ||||
| DC | 0236 | 0467 | 0.709 | |||
| DM | 0.385 | 0.373 | 0.501 | 0.626 | ||
| TDC | 0.655 | 0483 | 0.112 | 0.369 | 0.795 | |
| UR | 0.205 | 0.058 | -0.197 | 0.036 | 0402 | 0.720 |
Table 7: Fornell-Lacker criterion. Source: Own computation.
If the number is larger than the correlation values in the column and also larger than those in the row, the result indicates that discriminant validity is well established. Therefore, the current results presented in Table 8 satisfy these requirements and hence the constructs are valid constructs which are a sound measurement of TDC.
| Composite Reliability | |
|---|---|
| C C | 0.878 |
| C RA | 0.732 |
| DC | 0.724 |
| DM | 0.760 |
| T D C | 0.833 |
| UR | 0.636 |
Table 8: Composite reliability. Source: Own computation.
Reliability test
The test of reliability is conducted to check the soundness of measurement which tests whether it provides consistent results with repeated measurements of same instrument but different investigators or different samples. The quality of reliability is satisfied by Indicator Reliability and Composite Reliability tests. The Indicator Reliability test is annexed in the form of Outer Loadings (which is its square root) and shows that much of the variables satisfy the minimum threshold value of 0.4 as Hulland [31] indicates.
Composite reliability or internal consistency reliability: Composite Reliability is used for the internal consistency measure of PLS as a replacement of the traditional Cronbach’s alpha as suggested by Hair.
To measure Composite Reliability the following formula of Henseler et al. [30-38] is used;
Where;
is the outer (component) loading to an indicator, and in case of standardized indicators.
A sound measure of internal consistency is a value greater than 0.6and hence all latent constructs of TDC satisfy the composite reliability measure (Table 8).
Collinearity test; inner variance inflation factor (VIF) values
We need to have a VIF of 5 or lower to avoid the collinearity problem. As can be seen in Table 9, The VIF of value of all exogenous latent variables is lower than 5 which indicate that there is no collinearity problem.
| CC | CRA | DC | DM | TDC | UR | |
|---|---|---|---|---|---|---|
| CC | 12:4 | |||||
| CRA | 1336 | |||||
| DC | 1316 | |||||
| DM | 1529 | |||||
| TDC | ||||||
| UR | 1.156 |
Table 9: Inner variance inflation factor (VIF) values. Source: Own computation.
Conclusions
From the discourse, the following conclusions are drawn; the first finding of a positive and direct effect of “urbanization” on the outcome variable indicates that an increase in the level of the urbanization contributes to an increase in TDC. This speaks that the number of worldwide psycho-centric tourists is marginally higher than allocentric and mid-centric tourists together, which has great policy and marketing implications. The current finding supports the postulate that the most competitive destinations in terms of tourism receipts and inbound tourist arrival are the most urbanized economies. Therefore, the null hypotheses that “The coefficient of urbanization parameter β on the path relationship with TDC is statistically not different from zero, i.e. β=0” is rejected or declined. The previous theoretical and conceptual models have not included urbanization in to TDC model. However, in the present study urbanization is found to be significant predictor of TDC.
Had urbanization been excluded from the TDC model, the model would have suffered from the “Omitted Variable Bias” problem. “Omitted Variable Bias” means excluding relevant predictor from the model which is a serious problem in the eye of scientific inquiry. As a conclusion, this test of new construct has refined and calibrated the framework and added a fuel to the debate of comprehensiveness and robustness of the existing TDC models.
The second finding of statistically significant and negative relationship between demand conditions and TDC indicates that a high level of these latent constructs contributes to a decrease in TDC. Therefore, the null hypotheses “There is no statistically significant direct path relationship between demand conditions and tourism destination competitiveness” is statistically not supported and therefore is declined. This finding has an implication of better policy response on the pricing strategy of a destination attributes.
The third strong finding of statistically significant relationship between the latent construct “complementary conditions” and TDC with a first rank on the power of explaining the outcome variable confirms the theoretical postulate that this construct amplifies Impulse Travel Decision of tourists. Highly spending tourists are more likely to make Impulse Travel Decision and a destination which has the ability to attract impulse tourists has the probability to be competitive in international tourism receipt and spending per arrival ratio. Impulse tourists are characterized as relatively rich tourists, aggressive spenders, and price insensitive which has to do with a destination’s propensity of getting high spending per arrival ratio. Destination infrastructure, especially quality of air transport infrastructure, plays amplifying role on the impulse travel decision behavior. Quality of air transport infrastructure is measured by the airline’s passenger-carrying capacity, number of departures, airport density, number of operating airlines, and international air transport network which are drivers of impulse tourists. This finding is, thus, in support of the argument that complementary conditions do not play just complementary role on TDC rather as main driver of Impulse Travel Decision Behavior. This latent construct is, therefore, found to be one of the sets of intervention area for policy makers which help them to enhance optimal competitive balance.
The overall findings of this paper are important for policy makers to be able to see where interventions would be valued, make wise public spending and how to prioritize their focus across a portfolio of policies by giving higher margins to the things that matter to maintain a competitive destination.
Recommendation
Further research using panel data points would strengthen the finding of the current study.