Journal of Defense Management
Open Access
ISSN: 2167-0374
ISSN: 2167-0374
Research Article - (2017) Volume 7, Issue 1
In a military context, the collection, analysis, and use of geographic data can provide leaders with timely and accurate information on which to base decisions. GIS systems are used to store, manipulate, analyze, and manage all types of geodata, and are widely used by many military organizations in military decision making processes (MDMPs). Apart from accuracy, usage of GIS in MDMPs has provided many advantages, becoming a powerful and popular tool in the militaries of developed countries. However, even though GIS is a sophisticated tool in MDMP, the Sri Lankan Army has not employed widespread use of these systems. Tactical operations in which covert movement is paramount to success depend on high quality data and information concerning enemy positions, as was the case in the Sri Lankan Civil War (1983-2009). A case study of base siting using GIS is explored here; in this research we attempt to introduce GIS as a powerful tool in MDMPs in the Sri Lankan military. Sri Lanka is a developing country that suffered from a terrorist war for more than 30 years. All decision making and data gathering was done manually, spending more money and man power that was realistically necessary. This research is focused on providing solid evidence for the use of GIS techniques in MDMPs, which can partially supplant slower, less reliable humanbased decision making processes. In selecting a suitable permanent or temporary military operation base in enemy territory, all parameters need to be evaluated accurately. Injecting logical and statistical data, thus more automated processes into command-level decisions, will minimize errors in MDMPs. The analytic hierarchy process (AHP) is utilized to structure commander?s perceptions of important selection criteria, and optimal base selection procedures are described.
Keywords: Military decision-making process; Analytic hierarchy process (AHP); Location analysis; Military base location; GIS
AHP: Analytic Hierarchy Process; CENTCOM: Central Command; CI: Consistency Index; CR: Consistency Ratio; DS: Divisional Secretary; GIS: Geographic Information System; GIS-MCE: Geographic Information Systems-based Multi-Criteria Evaluation; IPB: Intelligence Preparation of Battlespace; LTTE: Liberation Tigers of Tamil Elam; MDMP: Military Decision Making Process; MOB: Military Operation(s) Base; MOS: Military Occupational Specialty; RI: Random Consistency Index; RS: Remote Sensing.
Geographic information systems in a military context
Geo-technologies have widened the use of location-based information in a military context. For example, the introduction of satellite technology, and subsequent advances in remote sensing (RS), brought accuracy and precision to the battlefield. Geographic information systems (GIS) have since become useful tools in storing, analysing, manipulating, and managing location-based information, and have further enhanced military operation effectiveness [1-10]. Many modern armies take advantage of GIS in their military decisionmaking processes (MDMP) (all branches of the United States military have a military occupational specialty (MOS) focused on geospatial data and analysis, for example, the U.S. Army’s 12Y-Geospatial Engineer). The use of GIS provides far-superior accuracy in analyzing locationbased information than previously used techniques, and supports easy information sharing, thus building a common picture of a geographic environment in a very short time period. This capacity supports MDMP by reducing uncertainty in decision making, and as such, GIS technologies have become widely used tools in a modern military organization [11-13]. Sri Lanka is a developing country, one which uses far fewer advanced technologies compared to other countries, especially within the military establishment. In MDMPs, terrain factors need to be analysed precisely, but with the lack of adequate technology, most commanders depend on outdated methods and equipment. Planning is typically accomplished by using 1:50,000 maps and satellite images, even though GIS and RS technologies can produce more robust results. A military operation base (MOB) is a secured forward military position generally used to support either permanent or temporary tactical operations. We use the definition of “operation base” to comprise all related facilities and central command (CENTCOM) designations for services in support of expeditionary contingency operations. MOBs can be classified depending on size, troop strength, and tactical importance; these bases are contingency operation base, main operation base, camp, combat outpost, patrol base, base complex, tactical base, logistics base, logistics support area, intermediate staging base, and fire base [4]. The selection of MOBs is one of the most difficult tasks during a military operation, as commanders need to consider many factors to ensure optimal results-substandard imagery and maps can complicate this task. A common method in the Sri Lankan Army consists of deploying a reconnaissance patrol to gather information which largely determines the base location; this method, however, puts soldiers in positions where enemy contact is possible and casualties could result. Using GIS- and RS-based methods can not only avoid needless deployment of soldiers into potentially hostile environments, they can produce more complete data and information on which to finalize a site selection. This research presents a case study of a location analysis procedure that is an integral part of military intelligence operations on the battlefield during the base selection stage. Site selection using GIS is a well-established use of geospatial data [5,14-17]. Armed forces use GIS in cartography, combat area management, military deployment, intelligence, and terrain analysis, allowing decision makers and commanders to obtain useful data and information. The main terrain features observed, cataloged, and utilized include rivers, roads, vegetation types, soil types, settlements, bridges, and slopes. Communication coverage (radio) is also considered, however; this is should be cataloged as a dependent, rather than a characteristic, of a holistic concept of “terrain”. Decision makers can evaluate terrain in terms of the collective military-centric characteristics such as field of fire, cover and concealments, obstacles, key terrain, and avenues of approach [18]. Further, the military commander which acquires and uses data and information quickly will be in an advantageous position before or during a conflict. This was amply demonstrated during the Gulf War in the early 1990s by Allied Forces against Iraq: “The lessons gained from military history indicate that the key to military victory lies (regardless of military size of the opposing forces) in remaining ahead of the enemy in time sensitive SCORE loop of C4I2 process. If a defending force or weapon system with some accuracy and sufficient warning can find out where the attacker is or what his future course of action would be, it would be easier to defeat him by occupying position of advantage or by massing a superior force at the point of decision [19]. Given these considerations, the authors identify three objectives for this study; to:
1. utilize MDMP for site selection by considering established selection factors and criteria;
2. select precise operation bases for military operations, and;
3. test and evaluate actual camp locations or vacated sites, creating optimal avenues for Sri Lankan military forces during MDMPs in postwar situations and future training exercises.
The Batticaloa District of the Eastern Province in Sri Lanka, one of 25 districts, is the primary study area. It is a second-level administrative division of the country. The Ampara district was carved out of the southern part of the Batticaloa district. The district is divided into 14 divisional secretary’s divisions (DS divisions), each headed by a divisional secretary. The DS divisions are further subdivided into 346 Grama Niladhari Divisions (GN divisions) (Figure 1) The research area of paramount importance during the Sri Lankan Civil War era (1983- 2009)-is limited to three DS divisions: Koralei Paththu (Oddamavadi, Valaichchenai) and Eravur Paththu, covering approximately 1,200 km2 (~460 mi2). This sparsely populated area was dominated by Tamil people during the war, and was controlled by the secessionist militant organization the Liberation Tigers of Tamil Eelam (LTTE); because of this, geospatial data were not properly updated by the government of Sri Lanka during the war. Most of the area is covered with forest, isolated rocks, Chena cultivations, paddy lands, and teak cultivations, as well as heavily networked with cart tracks, making base siting a very difficult task by conventional methods (i.e., conducting extensive field operations and verification observations).

Figure 1: Study area, Batticaloa district of eastern province, Sri Lanka.
We use a three-step decision-making process to site military bases which involves the analytic hierarchy process (AHP) [6], expert elicitation by way of surveying military personnel (command level), and weighted overlays in a GIS to gain insight concerning the weighting of criteria for optimal selection. Data collected from different sources are given in Table 1.
| Data | Scale or Type | Source |
|---|---|---|
| Land use data (1988) | 1:50,000 | Survey department |
| Contour data | ||
| Hydrologic data (1988) | ||
| Road data (1988) | ||
| Soil data (1988) | ||
| Radio communication data | GPS coordinates | Army signal corps |
| Animal movement data | Wildlife department | |
| Historical locations data (1988) | Archaeological department | |
| LTTE and government forces camp locations data | Military operations completion reports | |
| Population data | From 1988 to 2012 | Census and statistics department |
Table 1: Research data.
MOB selection plays a vital role in the MDMP. Adequate preparation and analysis of the factors in base selection is essential-improper site decisions invite mistakes. Sri Lankan military forces apply both simple geographic methods and on-ground reconnaissance for site selection. Typical methods involve the use of 1:50,000 military maps, satellite images, and deploying soldiers on reconnaissance missions to patrol the operation area. MDMP and intelligence preparation of battlespace (IPB) processes were applied, and several criteria were selected based on the military context relative to this study area and the accepted doctrine for MOB selection; the criteria are as follows:
1. Safety clearance zone from the enemy
2. Avoidance of urban areas
3. Airfield clearance zone
4. Base location in areas of flat topography
5. Electromagnetic transmission interference (germane to communication coverage)
6. Surface water, groundwater, and flood inundation zones
7. Avoidance of historical, archaeological, cultural, and religious areas
8. Prevailing wind patterns and air quality (pollution levels)
9. Consideration of threatened or endangered species
10. Soil type and conditions (sand, rock, and gravel)
11. Base should be accessible by road, track, and helipad for emergency situations
12. Maximize cover from air observations
13. Ease-of-location of high-ground observation points
14. Defilade positions are easily obtainable using natural objects
Technology has ushered in an era in which military data analysis has improved greatly in the context of military mapping (e.g., battlefield terrain analysis, troop movement), and data collection-information and data dominance leads to successful operations. Traditional methods of GIS site selection are based on the transformation of geodata layers into a classified map (e.g., Boolean model or index overlay operations). GIS-based multi-criteria evaluation (GIS-MCE) can be defined as processes that integrate and transform geographic data (map criteria) and value judgments (decision-maker’s preferences) to obtain a more holistic assessment of decision alternatives. The proposed GIS-based MCE approach employs five steps (Figure 2).

Figure 2: Military operation base selection conceptualization chart.
The analyst declares the type of factors and defines the area of interest based on tactical considerations and the research area in question. Terrain conditions in the study area consist of flat to rolling plains with isolated mountains, and a relatively dry climate type. The study area consists of open lands, paddy fields, streams, scrub cover, and a few jungle patches. The Batticaloa district is a very urbanized zone, with a surrounding, and sparely populated, rural area consisting mostly of jungle terrain. Considering these geographic characteristics and factors listed 1-14 above, base selection factors were adjusted accordingly. After defining the selection criteria, the criterion maps are prepared based on the predefined selection criteria. A criterion map represents the spatial distribution of an attribute that measures the degree to which its associated objective is achieved. The procedure for generating criterion maps is based on expert military knowledge and several GIS functions (Tables 2 and 3).
| Factors | Criteria | ||
|---|---|---|---|
| Not Suitable | Suitable | Most Suitable | |
| Population zones map | <5 km withinthebuffer area to population density of the area | 5 km to 7 km buffer area to population density of area | >7 km outside the buffer area to population density |
| Ground height zones map | < 9 m of ground height | 47 m < as high ground | 9 m to 47 m ground height |
| Communication coverage zones map | Uncovered area by three base stations | Covered area by one of base stations | Covered intersect area by three base stations |
| Surface water map | Within 500 m buffer area (<500 m buffer) |
2 km < outside of the buffer area | 500 m to 2 km buffer area |
| Soil map | Regosoil on recent beach and dune sands in flat terrain, alluvial soils of variable drainage and texture in flat terrain, tank | Solodized solonetz and solonchaks flat terrain, erosional remnants | Noncalcic brown soil, soil on old alluvium and solonetz undulating terrain, rock knob plains, reddish brown earth, noncalcic brown soil and low humic glay soil |
| Road zones map | < 5 km within the buffer area to main road | 5 km to 8 km buffer area to main road | > 8 km outside buffer area to main road |
| Camp zones map | 8 km < outside buffer area to hilly areas | 5 km to 8 km buffer area | < 5 km within the buffer area to hilly area |
| Animal locations | < 1 km buffer area | N/A | > 1 km buffer area |
| Historical locations | < 1 km buffer area | N/A | > 1 km buffer area |
| Enemy locations | Dependent on patterns of behavior and weapons ranges | ||
Table 2: Consideration factors and criteria for MOB selection.
Analytic hierarchy process
The AHP, first described by Saaty [6] is based on the rational comprehensive theory. The focus of the AHP is to arrive at the most rational decision by accepting subjective data assessment from individuals (usually experts in the field of study), ranking by perceived importance, then calculating weights based on those constructions [6]; people are often faced with complex problems that require the analysis and understanding of multiple criteria. The AHP provides a method by which qualitative information and quantitative data can be understood through building a hierarchy of top-down decision-making (Figure 3).

Figure 3: AHP hierarchy levels.
Result sets are subjected to tests of internal consistency to assure outlying or errant data is not clouding the resultant decision set, with the end-result being an optimal decision based on all available factors considered. After Saaty [6], we break the decision process into three components: 1) decomposition: division of the stated problem into component sets; 2) utilizing a pairwise comparison matrix, the relative importance of a data element or some qualitative element under consideration is assessed through expert elicitation, and; 3) resulting eigenvalues from each pairwise matrix (by element of consideration) are utilized as weights to set a priority for a consideration in the decision-making process. The AHP is a desirable method to apply in situations where qualitative information may otherwise be difficult to assess in a quantitative manner, as the ranking, weighting, and priority setting features allow the analyst to transform more abstract concepts into quantitatively derived packages [20]. Taylor [21] describes the decision-making process utilizing AHP by these seven steps:
1. Establishing pairwise comparison matrices for each decision alternative to each criterion
2. Synthesization
3. Establishing pairwise comparison matrices for each criterion
4. Establishing the normalized matrix
5. Establishing the preference vector
6. Calculating a value for each decision alternative
7. Determining the rank of alternatives according to the value for that alternative.
Typically, a scale of 1-9 is used as this number of levels represents what is thought to be the practical limit of what a person can realistically be expected to organize into a hierarchy of importance [16]. The standard preference scale for pairwise comparisons used here is shown in Table 3 below.
| Preference Level | Numerical Value |
|---|---|
| Equally Preferred | 1 |
| Equally to Moderately Preferred | 2 |
| Moderately Preferred | 3 |
| Moderately to Strong Preferred | 4 |
| Strongly Preferred | 5 |
| Strongly to Very Strongly Preferred | 6 |
| Very Strongly Preferred | 7 |
| Very Strongly to Extremely Preferred | 8 |
| Extremely Preferred | 9 |
Table 3: Preference scale for pairwise comparison (after Saaty, 2008).
AHP test of consistency
Taylor [21] states that human beings desire consistent decisions, but conditions in the actual practice of operational decision-making will not always support consistency. Inconsistency in decision-making is dealt with through use of the AHP’s assessment ability; measuring inconsistency and adjusting for those inconsistencies is a key reason the AHP is widely used in the context of expert elicitation with the goal of optimal decision-making by collective consensus. A higher measure of consistency is desired, as measured by the consistency ratio during the calculation process. After Forman and Selly [22], we use the baseline consistency ratio of 10% or less. It is noted that Forman and Selly [22] recognize that a consistency ratio of 10% or greater may still be considered acceptable in some analyses, however; we opted to use the more stringent 10% cutoff in this research.
The consistency index (CI) can be calculated by using the formula [21]:
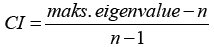 (1)
(1)
CI = Consistency index
n = Number of items compared (max 10)
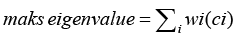 (2)
(2)
Where
wi = Weight
ci = Sum of column
After acquiring the CI values, the consistency ratio (CR) is calculated by:
 (3)
(3)
Where
CR = Consistency ratio
RI = Random consistency index as given by Table 4
| n | 1 | 2 | 3 | 4 | 5 | 6 | 7 | 8 | 9 | 10 |
| RI | 0 | 0 | 0.58 | 0.90 | 1.12 | 1.24 | 1.32 | 1.41 | 1.45 | 1.49 |
Table 4: Random consistency index (Saaty, 2000).
The result of these calculations allows the analyst to reach one of the following conclusions concerning the data [23].
1) If CR ≥ 10%, the data acquired is inconsistent
2) If CR < 10%, the data acquired is consistent
GIS layers
Population zones: When planning a battle, human population in the area is an important consideration for commanders in terms of selecting a best approach for MOB siting in the MDMP. Successful military operations will depend on surprise and if that element is lost an entire operation can fail. If commanders wish to maintain the element of surprise in operations, avoiding areas of high population is paramount. Fighting in built-up (urban) areas and jungle environments are the main two types of operations in Sri Lanka; this work focuses on the jungle operation scenario. Figures 4 and 5 display the population density and population density classification for the study area.

Figure 4: Population density (square kilometers).

Figure 5: Population density classification.
Ground height zones: High ground is an area of elevated terrain which is more suitable for military operations. During MDMP, leaders are advised to take high ground as the enemy will then be forced to attack from a lower position. Fighting from an elevated position is easier than operating from lower elevation, and, holding high ground offers an elevated vantage point with a wide field of view, enabling surveillance of the surrounding landscape, in contrast to valleys which offer a limited field of view. In addition, soldiers fighting uphill will become fatigued more quickly, while soldiers fighting downhill may not. Furthermore, soldiers who are elevated above their enemies can get greater range and velocity out of low-speed projectiles (e.g. rocks, grenades). Conversely, low-speed projectiles will have less velocity and range when thrown uphill. Very steep and/or rocky terrain, like mountain sides, can present obstacles to armored vehicles as well. Ground height classification is displayed in Figure 6.

Figure 6: Ground height classification.
Radio communication coverage: The terrain found within the study area is undulated and consists of isolated rocks, paddy fields, scrubs, open patches, and streams. These types of undulating terrain can be a barrier for electromagnetic radiation during the process of communication. Communication is one of the greatest influential factors during MDMP, and commanders must consider coverage as a key element in the decision making process when siting an MOB. If decision makers find any difficulties in communication in using one antenna or the repeater, commanders can establish two or more towers, ideally covering 360°. In a tactical context, during a military operation scenario, communication is one of the most significant factors influencing success; the failure of communication can result in unacceptable casualties and equipment loss, thus, communication base stations are key points of vulnerability in a battle. Protecting a communication center is prioritized as enemies will seek to attack them; if whole operations depend on a single communication center, and that center fails, both ground troops and commanders alike will be handicapped.
Results of the communication analysis show the areas that can be covered by each base station (Figure 7). Considering coverage, it suggests that establishing one base station cannot adequately cover the entire operation area. Based on the above comparisons, three communication coverage maps and the research area map were merged. Consequently, the areas were weighted as uncovered areas =1, less covered areas =2 and intersect areas =3. Thereafter the output result was reclassified as uncovered area, moderately covered area, and intersect coverage area.

Figure 7: Radio communication coverage classification.
Climate, weather, surface water, and soils: Surface water is one of the most important factors in MOB siting, as it can affect various conditions in an operation. In selecting an MOB site, close proximity to a stream or river is preferred, as to provide a water source for the contingent of soldiers stationed at that MOB. However a river should not affect the flow of an operation. In Sri Lanka, seasonal climate regimes are highly variable; during the planning stage of an operation, this factor can greatly influence a commander’s MDMP. Sri Lanka displays a variety of climatic conditions across the island nation. The average annual rainfall varies from 900 mm to 5,400 mm (~35 to 210 inches). It is common to distinguish two climatic regions in Sri Lanka, namely the wet zone and dry zone. (This is based on local knowledge; it is worth noting the K-ppen-Geiger classification for Sri Lanka is A (tropical) across the entire island.) Decision makers should have knowledge of current meteorological conditions and climatological regimes (both intra- and inter-seasonally) in the area, as failure to take these into account can expose an operation to climate- and weather-related vulnerabilities and natural disasters, such as intense rainfall events and potentially, subsequent flooding. The research area is situated in the dry zone, and is also part of the Aralaganvila land system. The study area is in the eastern dry zone and it occupies parts of the residual plantation surfaces as well as an old alluvial depositional surface together with a river floodplain. The dominant landforms that constitute this system are mantled plain, undulating to rolling and mantled plain level, level old alluvial plain, rock knob plains, erosional remnants, and semi-recent alluvial complexes. Various soil types were considered in the research area:
1. Alluvial soils of variable drainage and texture; flat terrain
2. Erosional remnants (Inselbergs)
3. Noncalcic brown soils and low humic gley soils; undulating terrain
4. Noncalcic brown soils, soils on old alluvium, and solonetz; undulating terrain
5. Reddish brown earths and low humic gley soils; undulating terrain
6. Reddish brown earths, noncalcic brown soils, and low humic gley soils; undulating terrain
7. Regosols on recent beach and dune sands; flat terrain
8. Rock knob plain
9. Solodized solonetz and solonchaks; flat terrain
10. Tank
Soil conditions can directly affect the momentum of an operation. Additionally, weather changes can alter soil trafficability. Most of the soils in this area increase in moisture content during rainy periods which in turn results in slipperiness, stickiness, and decreased strength. Dry periods produce the opposite effects; loose sands improve trafficability through an increase in cohesion during rainy periods and return to the loose, less trafficable state during dry periods. Trafficability characteristics affect armored and other vehicles, but usage of those vehicles depends on the operation in question. Most of the armies of the developed countries use various technologies to evaluate soil conditions, but Sri Lankan military forces still depend on expert knowledge and ground reconnaissance. Typically, jungle operations rely on surprise, and as such, commanders must pay careful attention to soil conditions, as wetter conditions can hinder troop and vehicle movement; an area with dry soil area is preferred when establishing an MOB. The various types of soils in the study area as listed previously are divided into three classes as follows:
1. regosoil on recent beach and dune sands in flat terrain, alluvial soils of variable drainage and texture in flatterrain, tank;
2. solodized solonetz, solonchaks flat, terrain, erosional remants;
3. noncalcic brown soil, soil on old alluvium, solonetz, undulating terrain, rock knob plains, reddish brown earth, noncalcic brown soil, and low humic glay soil.
The above classified data were reclassified as weighted values: 1=least suitable area; 2=moderately suitable area; 3=the most suitable area, as shown on the following soils map (Figures 8-10).

Figure 8: Surface hydrology classification.

Figure 9: Soil types (after Mapa et al. 2010).

Figure 10: Soil classification.
Road zones: Within the study area, main roads, minor roads, cart tracks, and railway tracks can be found. Main roads and the railway tracks are closer to the city area and other roads and tracks extend towards the more remote (less-urban) areas. Populations have developed around the main roads and the railways in the urban areas. When planning for an MOB, commanders must consider the type of base required. If the base is to be tactical it should be established in an isolated area; if an MOB is established closer to civilians it may be vulnerable for troops who are operating on ground. If the site is closer to a road, that can expose the base to detection by enemy forces, surrendering the element of surprise. Based on population distribution, and the nature of the road networks, the research area criterion has been created for the base to avoid the main roads and the railway tracks by a distance of 8 km (~5 miles) (Figure 11).

Figure 11: Road classification.
Camp zones: The value of natural support and natural advantages of the area needs to be considered in MOB planning. Bases established closer to mountain or rock will allow commanders to take advantage of better deployment of observation points, natural cover from air attacks, concealment for any number of operational purposes, and a solid point of communication. The study area consists of a few isolated rocks not higher than 60 m (~200 feet), but that height is suitable for observation points of the area. Even from the observation points, troops can observe far-off distances from the base and it can be protected with low trajectory gunfire. By considering the above factors and the geographic/ geologic features of the area, sites should be selected based on those characteristics (Figure 12).

Figure 12: Camp zones.
Data standardization and MCE
In this study, some data collection was carried out based on a questionnaire circulated among selected commanders. The questionnaire was targeted at tactical level planners and users, and the convenience sampling method adopted using fifteen officers of the ranks lieutenant colonel (5), major (5), and captain (5). Identifying the use of GIS for improving MDMP at higher levels was tested using live interviews. A number of MCE techniques have been implemented in a GIS framework for addressing site selection problems; AHP and weighted overlay methods are of the most commonly used techniques in site selection exercises [2]. Expert-opinion surveys assisted in identifying appropriate decisions in order to complete the pairwise comparison table in AHP. Results of the survey exercise are presented in the next section.
IPB and MDMP were the main criteria for the selection of those factors which describe the conventional method of MOB selection. The process of MOB selection can be described by the following decision inputs (Figure 13):

Figure 13: Decision input diagram.
Analysis using AHP was completed in two stages. First Stage: Determining the MOB selection factors (Table 4): (a) establishing the pairwise comparison matrix for each decision factor for each criterion; (b) Synthesization; (c) establishing the pairwise comparison matrix for each criteria; (d) establishing the normalized matrix; (e) establishing the preference vector; (f) calculating overall values for each decision alternative, and; (g) determining the rank of alternatives according to the values that have been acquired in the previous stage.
Second Stage: Test of consistency: After analyzing data using the AHP method, the result of the selection process must be tested for consistency. The test of consistency is completed using Equations (1), (2), (3) and Table 4 (random consistency index) [24].
In order to generate the pairwise comparison matrix, it is important to generate a standard preference table (Table 5) using a standard preference scale ranging 1-9. This is based on the knowledge of IPB, MDMP and military field manuals. To develop a pairwise comparison matrix, data on these factors were tabulated and analyzed through seven stages, from the developing of a pairwise comparison matrix stage to generating the factor’s ranks.
| Factors | |
|---|---|
| Communication coverage | A |
| Soil type | B |
| Surface water | C |
| Camp zones | D |
| Road zones | E |
| Population | F |
| Ground heights | G |
Table 5: MOB selection factors.
The scores in Table 6 are generated from the average measurement in the standard preference table (Table 5). For example, the score 5.0 in row A and column B is the average measurement given by the preference according to the factor ratio criteria; this means that respondents assess strongly to extremely favors (From Table 5, the standard preference scale).
| Factors | Extreme favors | Very strongly favors | Strongly favors | Slightly favors | Equal | Slightly favors | Strongly favors | Very strongly favors | Extremely favors | |
|---|---|---|---|---|---|---|---|---|---|---|
| A | 9 | 7 | 5 | 3 | 1 | 3 | 5 | 7 | 9 | B |
| A | 9 | 7 | 5 | 3 | 1 | 3 | 5 | 7 | 9 | C |
| A | 9 | 7 | 5 | 3 | 1 | 3 | 5 | 7 | 9 | D |
| A | 9 | 7 | 5 | 3 | 1 | 3 | 5 | 7 | 9 | E |
| A | 9 | 7 | 5 | 3 | 1 | 3 | 5 | 7 | 9 | F |
| A | 9 | 7 | 5 | 3 | 1 | 3 | 5 | 7 | 9 | G |
| B | 9 | 7 | 5 | 3 | 1 | 3 | 5 | 7 | 9 | C |
| B | 9 | 7 | 5 | 3 | 1 | 3 | 5 | 7 | 9 | D |
| B | 9 | 7 | 5 | 3 | 1 | 3 | 5 | 7 | 9 | E |
| B | 9 | 7 | 5 | 3 | 1 | 3 | 5 | 7 | 9 | F |
| B | 9 | 7 | 5 | 3 | 1 | 3 | 5 | 7 | 9 | G |
| C | 9 | 7 | 5 | 3 | 1 | 3 | 5 | 7 | 9 | D |
| C | 9 | 7 | 5 | 3 | 1 | 3 | 5 | 7 | 9 | E |
| C | 9 | 7 | 5 | 3 | 1 | 3 | 5 | 7 | 9 | F |
| C | 9 | 7 | 5 | 3 | 1 | 3 | 5 | 7 | 9 | G |
| D | 9 | 7 | 5 | 3 | 1 | 3 | 5 | 7 | 9 | E |
| D | 9 | 7 | 5 | 3 | 1 | 3 | 5 | 7 | 9 | F |
| D | 9 | 7 | 5 | 3 | 1 | 3 | 5 | 7 | 9 | G |
| E | 9 | 7 | 5 | 3 | 1 | 3 | 5 | 7 | 9 | F |
| E | 9 | 7 | 5 | 3 | 1 | 3 | 5 | 7 | 9 | G |
| F | 9 | 7 | 5 | 3 | 1 | 3 | 5 | 7 | 9 | G |
Note: A=Communication coverage; B=Soil type; C=Surface water; D=Camp zones; E=Road zone; F=Population; G=Ground height
Table 6: Standard preference table.
Compared to factor B according to the factor ratio criteria, the upper triangle of the matrix fills up values by using the standard preference table, if the judgment value is on the left hand side of 1 in the standard preference table we use the actual judgment value. In contrast, if the judgment value is on the right side of 1, we use the reciprocal value, for example the score 0.2 in row B and column A.
Synthesization
Synthesization initiates from the factor pairwise comparison matrix until the preference vector is found. This is achieved by summing the value of each column in the pairwise comparison matrix table (Table 6). This stage is completed by dividing the value of each cell with the total value of the same column. The result of this operation for the factor ratio criteria is shown in the “Total” column, Table 7. Normalization is accomplished by converting the values in the pairwise comparison matrix into a decimal value. Next, the values of each row are summed and averaged. Finally, the preference vector is identified and labelled (the “Average/Preference Vector” column in Table 7).
| Factor | A | B | C | D | E | F | G |
|---|---|---|---|---|---|---|---|
| A | 1.0 | 5.0 | 0.3 | 1.0 | 3.0 | 0.2 | 0.2 |
| B | 0.2 | 1.0 | 0.1 | 0.1 | 0.3 | 0.1 | 0.1 |
| C | 3.0 | 7.0 | 1.0 | 1.0 | 5.0 | 1.0 | 0.3 |
| D | 1.0 | 7.0 | 1.0 | 1.0 | 5.0 | 0.1 | 0.2 |
| E | 0.3 | 3.0 | 0.2 | 0.2 | 1.0 | 0.1 | 0.1 |
| F | 5.0 | 9.0 | 1.0 | 7.0 | 7.0 | 1.0 | 0.3 |
| G | 5.0 | 9.0 | 3.0 | 5.0 | 7.0 | 3.0 | 1.0 |
| Total | 15.53 | 41.00 | 6.68 | 15.34 | 28.33 | 5.60 | 2.32 |
Table 7: Factors pairwise comparison matrix for the factor ratio criteria.
Determining the rank of mob selection factors
After acquiring the preference matrix, each alternative for each criteria and the preference vector for each criteria, the next step is multiplying the preference matrix by the preference vector. The result of this multiplication yields the priority of factor selection, as shown in Table 8. Generated from the multiplication between the preference matrix and the preference vector, scores prioritize values for MOB selection factors to assign to layers in a weighted overlay tool in a GIS.
| Factors | A | B | C | D | E | F | x | = | ||
|---|---|---|---|---|---|---|---|---|---|---|
| G | (Factor)Ratio | CM | ||||||||
| A | 0.064378 | 0.121951 | 0.049929 | 0.065177 | 0.105882 | 0.035735 | 0.086183 | (A) 0.075605 | 7.545869 | |
| B | 0.012876 | 0.02439 | 0.021398 | 0.009311 | 0.011765 | 0.019853 | 0.04788 | (B) 0.021067 | 7.264659 | |
| C | 0.193133 | 0.170732 | 0.149786 | 0.065177 | 0.176471 | 0.178673 | 0.143639 | (C) 0.153944 | 7.698715 | |
| D | 0.064378 | 0.170732 | 0.149786 | 0.065177 | 0.176471 | 0.025525 | 0.086183 | (D) 0.105464 | 7.353577 | |
| E | 0.021459 | 0.073171 | 0.029957 | 0.013035 | 0.035294 | 0.025525 | 0.06156 | (E) 0.037143 | 7.110652 | |
| F | 0.321888 | 0.219512 | 0.149786 | 0.456238 | 0.247059 | 0.178673 | 0.143639 | (F) 0.245256 | 8.503711 | |
| G | 0.321888 | 0.219512 | 0.449358 | 0.325885 | 0.247059 | 0.536018 | 0.430917 | (G) 0.36152 | 8.060632 | |
Table 8: Factor pairwise comparison matrix and normalization for the factor ratio criteria.
Next, the consistency index (see Equation 1) is calculated by:
[(7.65-7)/(7-1)] = 0.11
(seven is the amount of base selection factors being compared)
where n=7, the acquired random consistency index (RI) is 1.32.
According to the consistency index and random consistency index, the consistency ratio (by using Equation 4) is 0.08 (0.11/1.32) or 0.08%. Since the consistency ratio is less than 10%, it follows that the site selection factors comparison and the weighted methods can be considered precise. With these results, when analysing the location for MOB siting, each factor should be weighted according to the AHP results; the weighted values are displayed in Table 9.
| Factors | A | B | C | D | E | F | G | Total | Average (Preference Vector) |
|---|---|---|---|---|---|---|---|---|---|
| A | 0.06 | 0.12 | 0.05 | 0.07 | 0.11 | 0.04 | 0.09 | 0.53 | 0.08 |
| B | 0.01 | 0.02 | 0.02 | 0.01 | 0.01 | 0.02 | 0.05 | 0.15 | 0.02 |
| C | 0.19 | 0.17 | 0.15 | 0.07 | 0.18 | 0.18 | 0.14 | 1.08 | 0.15 |
| D | 0.06 | 0.17 | 0.15 | 0.07 | 0.18 | 0.03 | 0.09 | 0.74 | 0.11 |
| E | 0.02 | 0.07 | 0.03 | 0.01 | 0.04 | 0.03 | 0.06 | 0.26 | 0.04 |
| F | 0.32 | 0.22 | 0.15 | 0.46 | 0.25 | 0.18 | 0.14 | 1.72 | 0.25 |
| G | 0.32 | 0.22 | 0.45 | 0.33 | 0.25 | 0.54 | 0.43 | 2.53 | 0.36 |
| Total | 1.00 | 1.00 | 1.00 | 1.00 | 1.00 | 1.00 | 1.00 |
Table 9: Multiplication between the preference matrix and the preference vector.
| Factor | A | B | C | D | E | F | G |
| Weight | 0.8 | 0.2 | 0.15 | 0.11 | 0.04 | 0.25 | 0.35 |
Table 10: Final factor weighting.
Suitable MOB sites
An accumulative factors area created a suitable site selection area with the weighted values; the areas indicated in light tan are not suitable, as those areas fail to satisfy optimal site selection factors. In addition, those areas are potentially dangerous for ground troops. The middle brown/sand-colored areas indicate a moderately suitable area for base locations; it would be reasonable to select from such areas in comparison to those displayed in light tan. However, the dark reddishbrown shading indicates the most suitable areas in which to establish an MOB within the study area (Figure 14).

Figure 14: Weighted classification for site selection.
Result analysis
All the weighted values were generated based on military tactical doctrines in mind as well as expertise erudition; although the methods used here have identified felicitous areas, actual MOB siting should be narrowed down to a more exact a location if these methods are used in a practical context. Other than site selection factors and the geographically-driven criteria, when deployment is considered, Sri Lankan terrain conditions following sub-criteria should be considered. The animal habitat factor is paramount in jungle operation scenarios; the following maps designate animal movements within the research area. Figure 15 displays 1 km buffers as applied to animal points. Field commanders should attempt to avoid areas identified as animal habitats in order to lessen the danger to troops as well as assist clandestine troop movement.

Figure 15: Archaeologic and animal locations; points and buffers.
Archaeological points are also considered, as military forces should make reasonable attempts to avoid the needless destruction of important cultural sites. Most important archaeological locations have been identified and included on topographic maps produced in Sri Lanka. In Figure 16, black points denote archaeological locations in the research area and black colored buffer rings denote areas to avoid during the site selection process. During this process, MOBs should not be placed within approximately 1 km of those zones, with optimal placement shown in the dark reddish-brown areas. Here we have precisely generated a suitable area based on tactical factors; this can be further compared with locations which were actually used by the LTTE during the Civil War.

Figure 16: Suggested locations for military operation bases.
Suggested MOB locations
Based on the weighted overlay maps (Figures 16 and 17) and above base selection criteria, four MOB locations were selected (Figure 17). Suggested locations are located in the dark reddish-brown (most suitable) zone, and all base points are located inside the most suitable camp zone area. Locations are close to high ground areas. Selected base points do not exceed 5 km buffer zones on the camp zone map. Those base points avoid animal movements and historical areas based on above-described site selection criteria. Suggested base points can be evaluated by using enemy points which were established in postwar evaluations of those areas. Figure 17 shows the ten actual enemy base points in the Batticaloa district-this area was dominated by the LTTE from 1988 to 2007. During the Civil War, they enjoyed many tactical advantages by using natural features of the area for cover and concealment. According to Figure 17, most of the enemy bases (seven of the ten: A, B, C, D, E, H, J) are located in the most suitable portion. Figure 17 also shows points F and G as located in the moderately suitable area, and point I located in the least suitable area. To evaluate suggested MOB siting, enemy density maps were created. Figure 18 shows enemy density in the study area (shaded circles) based on actual enemy locations identified after the conclusion of the war. The LTTE selected their bases by conducting ground-based reconnaissance operations. For 20 years the LTTE dominated the buffered areas above, conducting operations against the Sri Lankan military. This research was completed solely based on available geospatial data. Table 11 displays the distances from features that resulted from enemy base selection without the assistance of GIS or RS packages. Enemy base points A, B, C, D, and H were selected by considering the above factors related to the position of Sri Lankan forces, as well as those which would have provided cover and concealment. Bases I and G were sited closer to civilized areas in order to better facilitate administration and intelligence gathering. Tamil people were well-settled in this area and were fully controlled by the LTTE, but points E, F, and J were located in moderately suitable areas and those were created to link with other bases. Figure 18 indicates four suggested base points; base point 1 overlays the dense enemy area and is very close to enemy base points B, C, and D, and relatively close to enemy base point D. Base point 1, which is established in a dense enemy area, represents the optimal location to establish a military operation base in the study area (Table 12).
| Actual enemy points | A | B | C | D | E | F | G | H | I | J |
|---|---|---|---|---|---|---|---|---|---|---|
| Minimum distance to historical point | 11 km | 7 km | 6 km | 8 km | 3 km | 6 km | 6 km | 2 km | 2 km | 2 km |
| Minimum distance to animal point | 2 km | 5 km | 6 km | 6 km | 8 km | 5 km | 5 km | 10 km | 13 km | 6 km |
| Most suitable camp zone | Inside | Inside | Inside | Inside | Outside | Outside | Outside | Inside | Outside | Outside |
Table 11: Enemy base points; established based on distances.
| Suggested Base Points | Base 1 | Base 2 | Base 3 | Base 4 |
|---|---|---|---|---|
| Minimum Distance to Historical Points | 7 km | 5 km | 3 km | 10 km |
| Minimum Distance to Animal Points | 6 km | 7 km | 8 km | 3 km |
Table 12: Suggested MOB points; established based on distances.

Figure 17: Actual enemy locations.

Figure 18: Suggested base points with enemy location buffers (study area map included).
Military operations are stochastic and erratic, with many factors that can be difficult to account for. They are intricate struggles between contrasting human wills. Commanders can never be completely certain how the enemy will act or how scenarios will develop. Military commanders who understand how time and probability affect enemy and friendly forces are better prepared to develop successful plans. Given the nature of operations, the object of planning is not to eliminate uncertainty but to develop an outline for action in the midst of it. Systematic military operation planning is executed through MDMPs, and under uncertain situations, the use of new technologies will play a major role.
This paper has investigated the dilemma of finding the optimal location for MOBs. We suggest that the AHP method is an appropriate decision-making tool to assist in MDMPs in the context of base siting. Using expert elicitation and common selection criteria, we define AHP weights to suggest the most suitable base locations for forward military operations. We have considered many social and geographical site selection factors to select a suitable MOB in the study area. These were optimized by using a GIS tool to obtain suitable military operation base sites. After comparing these theoretical data points with the actual enemy base points in the Koralai Pattu and Eravur Pattu areas, a close proximity relationship was found, suggesting that GIS evaluations can be used to make accurate location decisions. Actual enemy base points (Figure 18) were selected by the LTTE during the Sri Lankan Civil War, considering all available on-ground tactical factors. Therefore, these base points provide strong evidence to support the GIS-based selection method utilized in this research. This technique can be introduced into the Sri Lankan MDMPs which, in turn, will minimize the drawbacks associated with current traditional decision making processes. While the data used in this case study are specific to the island nation of Sri Lanka, the methods employed to produce the weighted overlay output could easily be applied to any geospatial data for the purpose of base siting.