Translational Medicine
Open Access
ISSN: 2161-1025
ISSN: 2161-1025
Research - (2023)Volume 13, Issue 4
Background: Malaria is a significant health challenge in Africa. However, studies on the spatial dynamics of malaria transmission in Ghana using a geospatial analysis approach, have received little attention. This study used geospatial analysis and Geographic Information System (GIS) technology to examine the spatial intricacies of malaria transmission, focusing on how proximity to dumpsites and stagnant waters affects disease prevalence.
Materials and methods: We employed spatial analysis techniques such as buffer and overlay analyses, spatial autocorrelation Getis-Ord G statistics, geo-statistical modeling and correlation analysis, to explore the spatial relationships between dumpsites, stagnant waters, households and malaria incidence.
Results: The study revealed persistent difficulties associated with malaria, despite global attempts to eradicate and highlights the importance of environmental factors. Malaria transmission is higher near dumpsites and stagnant waters, where mosquitoes breed. The study also revealed the seasonal variation in malaria cases, with more in the rainy season and less in the dry season. The study suggests specific waste management strategies, vector control measures and public health interventions to reduce transmission risks.
Conclusion: Geospatial analysis and GIS technology provide valuable insights for evidence-based policymaking, enabling more effective malaria control and preventive measures. Collaboration involving health authorities, communities and stakeholders are essential for implementing these suggested interventions and lowering the malaria burden in endemic areas.
Disease prevalence; Dumpsites; Environmental factors; Geospatial analysis; Malaria transmission; Seasonality; Stagnant waters
Malaria remains a significant and persistent global health challenge, particularly in sub-Saharan Africa, where it exerts a disproportionately heavy burden on public health and socio-economic development. According to the World Health Organization (WHO), malaria caused 229 million infections and 409,000 deaths worldwide in 2019, with Africa suffering the most from this disease, accounting for 94% of cases and fatalities. Despite significant efforts to combat this deadly disease, malaria remains a pressing concern for both global and local health authorities. Within the WHO’s African region, Ghana, a West African nation, grapples with the ongoing and substantial public health challenge posed by malaria [1]. The Tano North municipality, located in the Brong Ahafo region of Ghana, represents one of the endemic regions where malaria transmission continues to be a major issue. The significant number of reported malaria cases and hospital admissions in this municipality presents a formidable obstacle to achieving Sustainable Development Goal 3 (SDG 3) ensuring good health and well-being for all. In 2016 alone, the Tano North municipality reported a staggering 27,982 cases of malaria, with a concerning 73.5% of these cases testing positive, despite global declines in malaria rates. Additionally, a case fatality rate of 7.2% underscores the severity of malaria-related hospitalizations and morbidity. Malaria transmission in the Tano North municipality is influenced by a complex interplay of factors. These include climatic conditions, socio-economic status, environmental factors and human behaviors, all of which affect the propagation of the disease [2]. Environmental factors, especially those that favour the breeding and survival of female Anopheles mosquitoes, the primary malaria vectors, are crucial. These factors are stagnant water bodies, temperature, humidity and proximity to densely populated areas [3,4]. A comprehensive understanding of these geographical and temporal dynamics is imperative for developing effective malaria control measures.
Malaria remains a significant public health threat in Ghana, despite numerous interventions aimed at reducing its incidence. These interventions include the distribution of insecticide-treated bed nets, indoor residual spraying and improved access to antimalarial drugs [5,6]. The Tano North municipality, like many other regions in Ghana, faces persistent challenges in effectively combating malaria. A complex interplay of factors, such as climate change, environmental modifications, human mobility patterns and emerging drug resistance, contributes to the resilience of malaria in this region [7].
Previous research has provided valuable insights into the general malaria situation in Ghana and Africa, but a significant research gap remains, especially regarding the localized spatial dynamics of malaria transmission at the community level in high-risk areas like the Tano North municipality [8]. To assess and design targeted and effective malaria control strategies that address the research gap, a nuanced and in-depth understanding of the local epidemiological and environmental factors driving transmission is essential [9,10]. Hence, this study sought to address this critical research gap by applying a comprehensive geospatial analysis approach to investigate the spatial dynamics of malaria transmission in the Tano North municipality of Ghana.
Geographic Information System (GIS) technology offers a powerful tool to decipher the intricate interactions between environmental factors and malaria transmission. By integrating geographic data such as topography, climate, land use and socio-economic characteristics, GIS enables the visualization, analysis and modelling of spatial patterns and processes. Leveraging GIS has the potential to significantly enhance malaria control programmes by guiding the direction of interventions, optimizing resource allocation and informing decision-making processes. However, the application of GIS in malaria research and control is still limited in many malaria-endemic regions, especially in sub- Saharan Africa.
This research, therefore, bridges a critical gap in the existing literature by utilizing advanced GIS and spatial statistical methods to examine the interplay between environmental factors and malaria transmission in the Tano North municipality, located in the Brong Ahafo region of Ghana. Given Ghana’s high malaria burden, particularly among children under five, this study provides valuable insights. The findings also promise to inform evidence-based, precisely targeted malaria control and prevention policy initiatives. This research helps to improve our understanding of the spatial dynamics of malaria by using GIS and spatial analysis. It, thus, offers the potential to optimize public health interventions and practices in the Tano North municipality and to serve as a possible model for malaria-endemic regions in Ghana and across Africa.
Malaria, a mosquito-borne disease caused by Plasmodium parasites, remains a serious global health threat, especially in endemic areas such as the Tano North municipality in Ghana’s Brong Ahafo region. The complex dynamics of malaria transmission are influenced by various environmental factors that affect the suitability of habitats for mosquito vectors and the development of the parasite within them. According to Hutchinson concept of ecological niche, each species has a specific set of ecological requirements for its survival and reproduction. This concept highlights the importance of different environmental factors in determining the spatial distribution of malaria, such as temperature, humidity and vegetation cover [11].
Temperature has a significant impact on the development of the parasite inside the mosquito as well as the mosquito’s survival and biting behavior. Warmer temperatures can accelerate the growth of the parasite during the extrinsic incubation period of Plasmodium in mosquitoes. Temperature-driven changes in mosquito behavior, such as increased activity and shorter feeding intervals, can also enhance transmission rates [12].
Humidity and rainfall patterns also play a crucial role in the dynamics of malaria transmission. High humidity and favorable precipitation patterns facilitate mosquito development in places like stagnant water bodies [13]. Conversely, changes in precipitation can affect mosquito populations and disease transmission. These ecological factors interact to create the geographical variation of malaria transmission, with different levels of disease prevalence occurring in different geographic regions.
Human modifications of the environment and land use also influence malaria transmission. Yasuoka, et al. suggest that deforestation, urbanization and changes in land cover can alter local microclimates and create new mosquito breeding sites [14]. Tusting argues that there may be more breeding sites in urban areas with poor drainage and sanitation systems, increasing the risk of malaria transmission. On the other hand, agricultural practices and changes in land use may change the availability of breeding sites, affecting the dynamics of mosquito populations.
GIS technology provides a powerful tool for integrating and analyzing spatial data to model malaria transmission. GIS can visualize spatial associations between environmental factors and disease outcomes. Spatial analytical techniques such as interpolation, clustering and overlay analysis can help researchers identify malaria hotspots and estimate disease risk based on ecological factors. The use of GIS for health-related spatial analyses is becoming more widely recognized as a way to effectively target interventions and resources [15].
Research philosophy and design
This study adopted a positivist research philosophy, which assumes that objective and measurable data can reveal the truth about the natural phenomena [16]. The descriptive cross-sectional research design employed in this study is to analyse the spatial dynamics of malaria transmission in the Tano North municipality, Ghana. The research design follows a quantitative approach, using geospatial analysis techniques and Geographic Information System (GIS) technology to investigate the relationships between environmental factors, proximity to dumpsites and stagnant waters and malaria prevalence. The study uses spatial autocorrelation measures, overlay analysis, geo-statistical modelling and correlation analysis to reveal patterns and associations between variables, aiming to provide evidence-based insights for malaria control strategies [17-19].
Spatial analysis techniques
Data preparation and processing in ArcGIS: We utilize a systematic analytical method with GIS software to thoroughly evaluate the impact of proximity to waste disposal sites on the spread of malaria. Here are the datasets we have acquired for this purpose.
• House positions: A dataset comprising the geographical coordinates (positions) of residences within the designated study region.
• Dumpsites positions: A dataset consisting of the geographical coordinates (positions) of waste disposal sites within the study area.
• Malaria occurrence data: Data pertaining to documented instances of malaria within the study area.
• The data related to malaria, stagnant water, dumpsites and households were additionally referenced to a shared coordinate system, ensuring that they are now synchronized spatially.
Buffering analysis to evaluate proximity effects
We utilize GIS software to perform a buffer operation on the dumpsites and stagnant waters layer multiple times, creating buffer zones at distances defined by the function.
fq = f1 + (q-1)c
Here, fq represents the distance for the qth term f1 is the first term, q is the term number and c is the common difference. This approach allows us to systematically determine the sequential proximity of dumpsites and stagnant waters to households, which in turn supports subsequent analysis.
The analysis utilized multiple ring buffering techniques within ArcGIS 10.8. Multiple ring buffering, as a spatial analysis method, generates concentric zones around geographic elements (in this case, dumpsites) using defined distances or ranges. The buffering operation in ArcGIS plays a pivotal role in examining proximity, spatial connections and service areas related to specific features. Ring buffers are instrumental in creating visually insightful maps that highlight areas of interest and their connections with neighboring elements. This tool has diverse applications for examining spatial connections, performing proximity analyses and guiding decision-making processes rooted in spatial patterns and the distances between geographic features.
Overlay analysis
Overlay analysis represents a fundamental spatial technique within Geographic Information Systems (GIS), where multiple geographical datasets or layers are merged to generate fresh information or glean insights based on their spatial connections. It serves as a potent tool for comprehending how distinct geographic elements interact and exert influence upon one another, thereby supplying valuable intelligence for decision-making, planning and spatial scrutiny. The primary notion underpinning overlay analysis revolves around the amalgamation of spatial attributes rooted in their spatial proximity or intersection. This analytical process takes into account both the geographic placement and characteristics of each element to produce novel datasets or discern particular spatial trends. In the context of identifying houses within buffer zones, overlay analysis becomes instrumental. This undertaking allows for the identification of residences situated at specified distances from dumpsites, offering a comprehensive view of their spatial distribution.
Malaria incidents and hotspots
A map illustrating the spatial distribution of malaria cases was crafted through ArcMap. The process of pinpointing malaria hotspots using the Inverse Distance Weighting (IDW) technique within ArcMap encompasses a geospatial analysis approach that enables the visualization and evaluation of regions with elevated concentrations of malaria cases.
In this methodology, IDW comes into play as a tool for interpolating values from established data points, which in this case are the recorded instances of malaria. The outcome is the generation of a seamless surface, which serves as a representation of the probability or magnitude of malaria occurrences across the entire study area. This approach aids in identifying clusters or areas where malaria is more likely to be prevalent, offering valuable insights for further analysis and public health interventions.
Statistical analysis
Three consecutive measurements were taken for each participant and their average values were calculated for data analysis.
Spatial autocorrelation using global Moran’s I: Spatial autocorrelation in count data, such as disease cases, is assessed through various statistical indices like Moran’s I, Geary’s C and the Getis-Ord G statistic. These indices can be calculated as either global or local measures, depending on the analytical focus. Global spatial autocorrelation provides an overall measure of spatial dependency across the entire study area, summarizing the similarity or dissimilarity of count values throughout the dataset. In contrast, local spatial autocorrelation examines individual features, revealing specific spatial patterns and relationships among neighboring elements. By considering the relationships between these elements, it uncovers localized variations in spatial patterns, such as identifying hotspots or coldspots within the study area. These indices, rooted in the concept of the Gamma (γ) index, serve as valuable tools for understanding the spatial structure and dependencies within count data, assisting in the analysis of various phenomena, including disease distribution and spatial clustering.
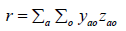
The Global r index, equation consists of the sum of the cross products of the elements yao and zao in two matrices of similarity, using spatial similarity in one matrix and value similarity in the other matrix, such that
Using different value similarity result in different indices. For example, setting
yao = pa po
would result in Moran’s I statistic and setting would result in Geary’ C index given as
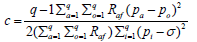
Where, q=number of spatial units, p=variable, σ=mean, 2Raf = matrix of spatial weights with Raa = 0, Rff = 0.
The global gamma index equals the sum of local gamma indices within the study area.
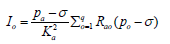
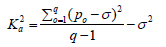
Moran’s I statistics: The Moran’s I statistical tool is employed in spatial analysis to evaluate how a variable (such as dumpsites/ stagnant waters versus households) is distributed across a geographic area, indicating whether it tends to cluster together (positive spatial autocorrelation) or disperse (negative spatial autocorrelation) in nearby regions, as described in equations. Although Moran’s I is one of the earliest measures of spatial autocorrelation, it can be applied to assess both global and local spatial autocorrelation in continuous data. This involves calculating the mean (σ) of any continuous variable, denoted as pa and determining the deviation (φ) of an observation from that mean based on the differences in values from the mean. The statistic then compares the value of the variable at one location to its values at all other locations. For q observations on a variable p at locations a, o, global Moran’s I can be calculated as follows:
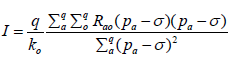
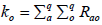
Where; σ=mean value of p, pa = value variable of p at location m, pa = value variable of p at location o, Rao = elements of the weight matrix, q=number of observations and ko = the sum of the elements of the weight matrix such that
The local Moran’s I for location m can be calculated as
The values for this index usually fall within the range of -1.0 to +1.0. A value of -1.0 signifies negative spatial autocorrelation, while a value of +1.0 indicates positive spatial autocorrelation. When neighboring points exhibit similar Moran’s values, their cross product is high. Conversely, when nearby points have dissimilar Moran’s values, as described in equation, their cross- product is low. The expectation of Moran’s I statistic is

When the Moran’s I value exceeds E(I), it signifies positive spatial autocorrelation, whereas if Moran’s I is lower than E(I), it indicates negative spatial autocorrelation. In Moran’s original equation, the weight variable, denoted as Rao, represented a contiguity matrix. Consequently, when zone o is adjacent to zone a, the product is assigned a weight of 1.0; otherwise, it receives a weight of 0.0. A study generalized these definitions to include any type of weight and in a wider term, Rao, is a distance-based weight which is the inverse distance between locations m and n (1/dao).
The z-score of Moran’s I can also be computed:

Where E(I) is the expected value of I and J(I) is the variance of I, as shown below
J(I) = E(I²) - E²(I)
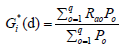
To compute a single statistic for the entire study area with respect to the specified threshold distance as defined, the Getis-Ord Gi statistic is deployed. The Global G statistic computes a single statistic for the entire study area whereas the Gi statistic is an indicator for local spatial autocorrelation for each data point. The Global G statistic can be calculated as:
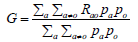
where, pm is the value of variable p at location o, po is the value of variable p at location o and Rao are the elements of the weight matrix.
There are two types of local Gi statistics, although almost the two types produce identical results. The first one, Gi, does not include the autocorrelation of a zone with itself, whereas the Gi* includes the interaction of a zone with itself (Gi statistic does not include the value of pa itself, but Gi* only the neighborhood values, but includes pa as well as the neighborhood values) and both can be computed by the formulae:
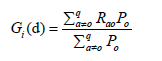
In the above equations, d represents the neighborhood threshold distance denoted as a, while Rao is the weight matrix that takes on values of 1.0 if o is within a distance d of o and 0.0 if it’s beyond that distance. These formulas demonstrate that the cross- product of the value of P at location m and another location o is adjusted by a distance weight, Rao, which is defined as 1.0 if the two locations are closer to or equal to a threshold distance, d and 0.0 otherwise. The G statistic can range from 0.0 to 1.0. The statistical significance of the local autocorrelation between each point and its neighbors is evaluated using the Z-score test and the associated p-value. ArcGIS uses the following formulae to calculate the local Getis-Ord Gi*;
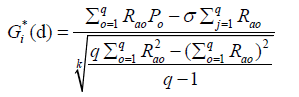
Where, pa is the value of variable P at location a, po is the value of variable P at location o, Rao is the elements of the weight matrix and q is the number of observations.
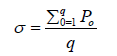
The expected G value for a threshold distance, d, is defined as:
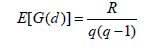
Where, R is the sum of weights for all pairs of locations  and q is the number of observations. For normal
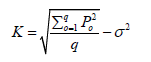
distribution, the variance of G(d) is defined as:
and q is the number of observations. For normal
distribution, the variance of G(d) is defined as:
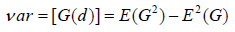
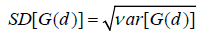
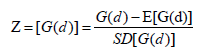
The Standard Deviation (SD) of G(d) is the square root of the Variance (V) of G. Therefore, a Z-test can be computed by:
Geo-statistics: This study utilized a conventional geo-statistical model as outlined by Collins in 2006. Various vital components were allocated to variables. In this context, xi represents distinct locations within a study region, denoted by G, C and R², Ro:l=1……., q signifies individuals at risk in each community, following equation. The data pertaining to the disease under study included records indicating whether each test yielded a positive or negative result and this data was analyzed. Ya denotes positive malaria Rapid Diagnostic Test (RDT) occurrence out of Rn individuals in xi regions of interest G C R² and a vector of associated covariance d(xi) ∈ Rp.This assumes binomial function as y ~ Binomial (Ro, p(xi)), where p(xi) measures the disease prevalence at locations (distance between dumpsites/stagnant waters and households).
Logistic function was adopted to further assume that
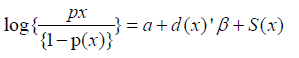
Where, a=intercept, S(x)=unobserved random effect with zero mean as applied in Gaussian process with a constant variance, d(x)’=observed vector associated with the response Y, β =vector of the spatial regression coefficient for the covariates.
This helped analyzed malaria cases of residents who are not targeted in the research to compute the correctness between the targeted communities.
The empirical logit transform is defined as below:
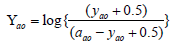
The assumption to this equation is that
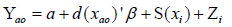
Where, Za is a mutually independent zero-mean Gaussian random variable with variance. The indexes a and o represent an individual household and a member within the household respectively. Equation was used to check the dependencies of malaria cases and variables of unknown predictors.
Correlation analysis: The study evaluated the average malaria incidence for houses located within different buffer zones. The level of malaria transmission varied depending on the proximity of households to the dumpsites. To identify any statistically significant trends or patterns, the study further examined the relationship between the proximity of households to dumpsites and reported cases of malaria, as described by Okrah, et al. [20]. Regression analysis was employed to assess the strength of the relationship between the distance from dumpsites and malaria incidence. This analysis helped quantify the impact of proximity to dumpsites on malaria transmission. Additionally, Pearson’s correlation coefficient (denoted as R in equation) was used to determine the correlation between proximity to dumpsites and malaria transmission.
Where, R=correlation coefficient xi = values of the x-variable in the sample, μ = average values of the x-variable, yi = values of the y-variable in the sample, δ = average values of the y-variable.
A regression heatmap was utilized to visually represent the relationships among various variables within the dataset. This heatmap offers a graphical depiction of the correlation coefficients (denoted as R) between pairs of variables, aiding in the identification of patterns, trends and interdependencies. Correlation coefficients help in swiftly determining whether variables exhibit positive or negative correlations. Positive correlations, with values close to 1, suggest that two variables tend to rise or fall together, whereas negative correlations, with values close to -1, indicate that as one variable increases, the other tends to decrease.
Statistical inferences
Spatial distribution of dumpsites, stagnant waters and households: The Moran I index values for each town reveal varying degrees of spatial autocorrelation in the distribution of dumpsites, stagnant waters and households, as depicted in Figures 1-3. A positive Moran I index (close to +1) indicates the clustering of similar values, while a negative Moran I index (close to -1) suggests the dispersion of values. The associated p-values for each Moran I test convey the level of statistical significance. A p-value below 0.05 (at a 95% confidence interval) signifies statistically significant spatial autocorrelation.

Figure 1: Spatial autocorrelation distribution in stagnant water. 


Figure 2: Spatial autocorrelation distribution in dumping site. 


Figure 3: Spatial autocorrelation distribution in households with malaria. 


From the results illustrated in Figures 1-3, it becomes evident that stagnant waters (0.945), dumpsites (0.765) and malaria cases (0.945) in Tano North tend to cluster together. Consequently, areas with a high concentration of stagnant waters and dumpsites, such as Duayaw Nkwanta, Yamfo, Bomaa, Tanoso and others, exhibit elevated malaria cases. In contrast, regions with low malaria cases are located in areas with a lower concentration of stagnant waters and dumpsites, including Mensukrom, Akokoaman and Binkyem, among others (Figures 1-3).
Malaria incidents hotspots and proximity: The results of the buffer analysis for each town, as depicted in Figures 4 and 5, reveal distinct patterns related to malaria cases and their proximity to dumpsites. Duayaw Nkwanta, Yamfo, Bomaa and Tanoso consistently display elevated malaria cases across various buffer distances, indicating a strong correlation between proximity to dumpsites/stagnant water and the incidence of malaria. Conversely, Akokoaman and Mensukrom record the lowest malaria cases as the distance from dumpsites increases, with the highest cases occurring at a distance of 200 meters. This analysis supports the hypothesis that improper waste disposal sites can serve as breeding grounds for disease vectors, leading to a heightened risk of disease transmission (Figures 4 and 5).

Figure 4: Area infected with malaria incidence. 

Figure 5: Malaria risk category. 
The results of the standard geo-statistical model provide valuable insights into the spatial distribution of malaria cases among residents who are not the primary targets, considering their proximity to dumpsites and stagnant waters. These findings showcase variations across different towns, underscoring the potential health risks associated with their proximity to such sites. They underscore the urgent necessity for tailored waste management practices and health interventions to mitigate adverse health effects in these communities.
The model’s conclusions emphasize the critical importance of customized interventions, enhanced waste management procedures and effective vector control strategies in reducing malaria risks in areas close to dumpsites and stagnant waters. The diagrams in Figure 6 vividly illustrate that households located closer to dumpsites and stagnant waters consistently report higher incidences of malaria cases compared to those situated farther away from these locations. For example, Duayaw Nkwanta, Yamfo, Bomaa, Tanoso and others consistently report elevated malaria cases due to a significant portion of their households being in close proximity to dumpsites and stagnant waters. Conversely, areas like Mensukrom, Akokoaman and Binkyem often experience lower malaria cases, primarily because the majority of households are situated at a greater distance from dumpsites and stagnant waters (Figure 6).

Figure 6: Distance covered from dumpsite/stagnant (meters) water to household. 


Seasonal variation of malaria cases: Malaria is endemic in the Tano North municipality and the country experiences seasonal variations in malaria cases. The patterns of malaria transmission can vary by region within the municipality, but generally, there are two main seasons that influence the prevalence of malaria.
(a) High transmission season (rainy season): This typically occurs during the rainy season, which in the municipality is from May to October as shown in Figure 7A. During this period, increased rainfall creates breeding sites for mosquitoes, which are the primary vectors for transmitting malaria. The higher humidity and increased mosquito populations lead to a surge in malaria cases. This is often referred to as the peak malaria season.

Figure 7: (A): Malaria cases in rainy season; (B): Malaria cases in dry season. 


(b) Low transmission season (dry season): The dry season in the municipality typically runs from November to April as shown in Figure 7B. During this time, there is a decrease in mosquito populations and breeding sites due to reduced rainfall and drier conditions. As a result, malaria transmission is lower and the number of cases tends to decline during this season (Figures 7A and 7B).
It is important to note that while these are general patterns, there can be local variations and some areas in Tano North may experience malaria transmission throughout the year, especially in areas with stable, year-round transmission. The distribution of bed nets sprayed with insecticide, indoor residual spraying and the administration of antimalarial drugs are some of the methods used to manage and prevent malaria in Tano North. The Ghana Health Service (GHS) and various international organizations work together to implement malaria control programs and raise awareness about prevention measures. For the most current and region-specific information on seasonal variations of malaria cases in the municipality, it is recommended to consult the Ghana Health Service (GHS) or the WHO, as they monitor and report on malaria trends and control initiatives in the municipality.
This study provides valuable insights into how the spatial distribution of dumpsites, stagnant waters and households affects malaria incidence. Using various spatial statistical methods, the analysis explores the relationships between environmental factors and disease transmission risks.
Spatial distribution of dumpsites, stagnant waters and households
The positive Moran I index values indicated that there was clustering or aggregation of similar values for the environmental factors in localized areas within the study area. This clustering or aggregation of environmental risk factors is a crucial, as it suggests that certain areas within the study area may be at a higher risk for malaria transmission due to the concentration of the risk factors. In other words, areas with a high Moran I index value for dumpsites, stagnant waters or households were more prone to malaria transmission because they have a higher density of the risk factors. The significance of the spatial autocorrelation, as indicated by the p-values, suggest that the observed clustering of environmental risk factors is not random but rather a statistically significant pattern. This means that there is a spatial structure to the distribution of these risk factors and this structure has implications for disease transmission. Our findings align with the results of Wimberly, which emphasized the importance of considering spatial autocorrelation when estimating disease distribution. Spatial autocorrelation indicates that neighboring locations tend to have similar values, which is a common phenomenon in geospatial data related to diseases.
Failure to account for spatial autocorrelation can lead to biased estimates and inaccurate assessments of disease risk. Therefore, our study’s recognition of spatial autocorrelation in the distribution of environmental risk factors highlights the need for spatially explicit and context-specific interventions in malaria control. It implies that targeting interventions solely based on overall averages may not be as effective as focusing on areas with high Moran I index values where risk factors cluster. This insight can guide public health authorities in prioritizing resources and interventions to address the specific areas at the highest risk of malaria transmission, ultimately leading to more efficient and targeted disease control efforts.
Malaria incident hotspots and proximity to dumpsites
The results of our buffer analysis strengthened the idea that the proximity of dumpsites and stagnant water to certain towns was linked to malaria cases. For example, in towns like Duayaw Nkwanta, Yamfo, Bomaa and Tanoso, we consistently found malaria cases, even at varying distances from these environmental factors. This suggests a strong connection between environmental factors and the occurrence of malaria in these areas. Our findings support earlier studies who used spatial methods to study diseases and found that identifying specific geographic areas to disease spread was effective [21,22]. So, our results align with their work and add to the evidence that spatial approaches are valuable in understanding disease transmission. However, something interesting emerged in the cases of town like Akokoaman and Mensukrom. We noticed that as you moved farther away from dumpsites, there was a decrease in malaria cases, but this decrease peaked at a distance of 200 meters. At first, this might seem a bit confusing or unexpected. To explain this, we should consider that the relationship between environmental factors, mosquitoes that transmit malaria and people is quite complex. It is not just about how close you are to a dumpsite; it is also about local factors like how people interact with their environment, the habits of local mosquitoes and even seasonal changes. So, while we see this pattern, it is a reminder of how unique each region can be in terms of disease transmission. Overall, our findings resonate with other studies which emphasized the influence of seasons on disease transmission, especially during the wet seasons. Additionally, our use of GIS mapping techniques, as seen in studies by Snow and Markus, confirms the importance of mapping disease distribution to guide how we respond to and prevent diseases.
Seasonal variation of malaria cases
The high transmission season in the study area, which coincides with the rainy season, is characterized by increased malaria incidence due to factors such as mosquito breeding. This observation aligns with the study conducted in Mozambique, where it was found that wet seasons are associated with a high incidence of malaria and its transmission. The increased rainfall during the rainy season provides favorable conditions for mosquito development and the transmission of the Plasmodium parasite, contributing to the observed peak malaria season. Additionally, the distribution of insecticide-treated bed nets and the provision of antimalarial medications during the high transmission season, as observed in the study area, are in line with recommended interventions highlighted in broader malaria epidemiology literature. The low transmission season during the dry season, characterized by a reduction in malaria cases, is consistent with the findings from other endemic regions. For instance, in Northeastern Venezuela, a study which utilized local spatial statistics and geographic weighted regression, revealed a spatial pattern of malaria incidence associated with factors like population density and proximity to aquatic habitats. This pattern is indicative of the impact of environmental factors, including seasonal variations, on malaria transmission. While the specific seasonality of dengue was not the focus of the Thailand study, the link between rainfall and mosquito development can be inferred. The study noted that urban villages located on the periphery had a higher incidence of dengue, emphasizing the role of geographic factors and potential seasonal influences like rainfall on disease transmission. Another study in Thailand showed that rural epidemics lead urban epidemics within a dengue season, both nationally and within health regions and that rainfall and humidity played a role in dengue transmission.
This study has explored the spatial distribution of dumpsites, stagnant waters and households in relation to malaria incidence and highlighted the seasonal dynamics of the disease in the Tano North municipality. The study has significant implications for public health interventions and the understanding of malaria transmission in the studied region. We suggest targeted interventions in areas identified as consistent malaria hotspots, particularly those near dumpsites and stagnant waters, prioritizing them for intensified vector control measures such as the distribution of mosquito nets, indoor residual spraying and community-based education on malaria prevention. We also recommended the incorporation of geospatial techniques and GIS mapping in disease surveillance and intervention planning to create accurate and up-to-date georeferenced data for real-time monitoring and timely outbreak responses. Adaptive strategies that account for seasonal variations in malaria cases, especially the peak incidence during the rainy season, were proposed. These strategies include allocating additional resources and strengthening healthcare infrastructure during high transmission seasons and using the dry season for reinforcing healthcare systems, conducting research and preparing for potential outbreaks. Context-specific interventions that consider local factors influencing disease transmission in different towns in the region were advised, with a call for future research to delve deeper into these nuances to inform tailored interventions. Interdisciplinary collaboration between epidemiologists, environmental scientists and geospatial experts was encouraged to achieve a comprehensive understanding of disease transmission and develop effective control strategies. Community engagement initiatives and public health campaigns were recommended to be adapted to local contexts and seasonal variations, with continuous education to raise awareness about malaria prevention and early treatmentseeking behavior. Long-term surveillance and year-round data collection were stressed as vital for monitoring changing disease dynamics, especially in the context of seasonal variations, to identify trends and predict potential outbreaks. Lastly, assessing the potential impact of climate change on rainfall patterns and malaria transmission was proposed as a critical focus for future research.
[Crossref] [Google Scholar] [PubMed]
[Crossref] [Google Scholar] [PubMed]
[Crossref] [Google Scholar] [PubMed]
[Crossref] [Google Scholar] [PubMed]
[Crossref] [Google Scholar] [PubMed]
[Crossref] [Google Scholar] [PubMed]
[Crossref] [Google Scholar] [PubMed]
[Crossref] [Google Scholar] [PubMed]
[Crossref] [Google Scholar] [PubMed]
[Crossref] [Google Scholar] [PubMed]
[Google Scholar] [PubMed]
[Crossref] [Google Scholar] [PubMed]
[Crossref] [Google Scholar] [PubMed]
Citation: Amponsah SK, Apenkwa J, Yeboah E, Ayaaba E, Dormechele W, Okrah A, et al (2023) Spatial Dynamics of Malaria Transmission in the Tano North Municipality of Ghana: A Geospatial Analysis Approach. Trans Med. 13:308.
Received: 03-Nov-2023, Manuscript No. TMCR-23-27906; Editor assigned: 06-Nov-2023, Pre QC No. TMCR-23-27906 (PQ); Reviewed: 13-Nov-2023, QC No. TMCR-23-27906; Revised: 27-Nov-2023, Manuscript No. TMCR-23-27906 (R); Published: 04-Dec-2023 , DOI: 10.35248/2161-1025.23.13.308
Copyright: © 2023 Amponsah SK, et al. This is an open-access article distributed under the terms of the Creative Commons Attribution License, which permits unrestricted use, distribution, and reproduction in any medium, provided the original author and source are credited.