
Journal of Fundamentals of Renewable Energy and Applications
Open Access
ISSN: 2090-4541

ISSN: 2090-4541
Research - (2020)Volume 10, Issue 6
Solar energy is one of the cleanest and infinitely available energy sources for the Earth. Though there are many advantages of solar power generation, it all comes down to the availability of space required to set up solar power panels. The cities usually have little to none space except the rooftops of the buildings, which are also not available every time because of the presence of other setups on the rooftops. This paper deals with increasing the solar power generation in the metropolitan cities by using the previously unused space above the metro train lines with are free of overhead wires. A case study for Berlin is done in this paper and it shows the potential of increasing the power generation by 12 MW. Different scenarios are also discussed for increase in the power generation in other cities and different configurations.
Solar energy; Metropolitan cities; City planning; Photovoltaic; Power generation; Renewables; Clean Energy; Green energy
Solar energy is considered one of the cleanest energy resources available to mankind. Solar energy is created by light and heat which is emitted by the sun, in the form of electromagnetic radiation. With modern technology, it is possible to capture this radiation and turn it into usable forms of solar energy - such as heating or electricity. The technical feasibility and economic viability of using solar energy depends on the amount of available sunlight (solar radiation) in the area where it is intended to place solar heaters or solar panels. This is sometimes referred to as the available solar resource.
Scientists measure the amount of sunlight available in specific locations during the different times of year. Estimation is then made to calculate the amount of sunlight which falls on similar regions at the same latitude with similar climates and conditions [1].
Measurements of solar energy are normally expressed as "total radiation on a horizontal surface", or as "total amount of radiation on a surface tracking the sun". In the latter case, the assumption is that one is using a solar panel that automatically tracks the sun. In other words, the solar panel would be mounted on a tracking device so that the panel would remain at right angles to the sun throughout the day. This system is primarily used for industrial setups, when it is used at all. Radiation data (the amount of solar energy available at a given location) for solar electric (photovoltaic) systems is often represented as kilowatt-hours per square meter (kWh/m2). Direct estimates of solar energy may be expressed as "watts per square meter" (W/m2) [2].
Solar Photovoltaic Panels
Photovoltaic (PV) systems are made of PV modules. The smallest unit in a PV module is the solar cell, which convert the light into electricity. The direct electric current (DC) produced varies constantly depending on the intensity of the incoming solar light. Also current is depended of the incoming solar energy. A PV module consists of many solar cells connected to achieve a higher voltage. A module for off-grid application normally is adapted for a voltage of 12 V or 24 V (with respectively 36 and 72 cells in series). When modules are used for grid connected systems with higher voltage and alternating current (AC), an inverter is needed to change the DC current into AC current. When the cells are connected into a module, different losses also lower the module efficiency from the cell efficiency.
The Figure 1 explains the working of a photovoltaic panel wherein light, when shined onto a semiconductor such as silicon (Si) generates electron-hole pairs. These electron-hole pairs are separated spatially by an internal electrical field created by introducing special impurities into the semiconductor. This separation creates negative charges on one side of the interface and positive charges on the other side, generating a voltage and direct current (DC) when connected to a load. Photovoltaic cells are interconnected to form PV modules with a power capacity of up to several hundred watts. Photovoltaic modules are then combined to form PV systems. The unit watt-peak is often used to express the costs or efficiency of Solar PV because the output of a PV cells varies according to solar irradiance and ambient temperature. For the sake of simplicity, the factbook uses the term watt to denote watt peak. The Classification of PV cells and Comparison of PV Panels are shown in Figure 2 and Table 1.
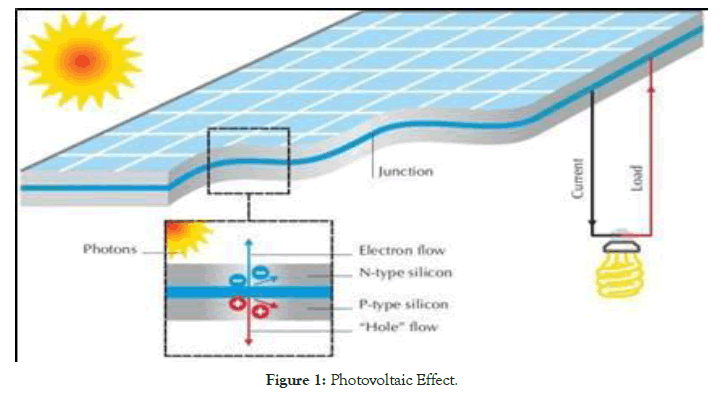
Figure 1: Photovoltaic Effect.
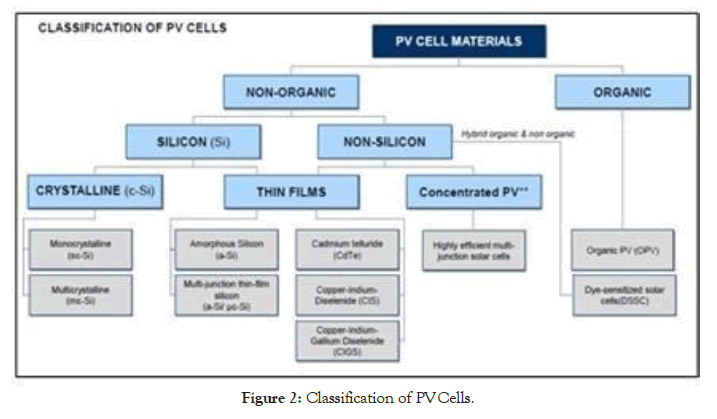
Figure 2: Classification of PV Cells.
Table 1: Comparison of PV Panels.
| Type of PV | Pros | Cons |
|---|---|---|
| Crystalline silicon (c-Si) Cells are made of highly purified silicon (5 grams per watt) | •Higher efficiency than other technologies •Most mature technology, benefits from semi-conductor industry •High lifespan – currently 30 years, could increase to 40 years |
•Efficiency decreases as temperature rises (-0.45% per °C) •Silver accounts for 5% of the cost and may have an impact on future cost reduction •Higher lifecycle GHG emissions than other technologies |
| Thin films semi-conductors like Amorphous Silicon (a-Si), Multi-junction thin-film silicon (a-Si/ μc-Si), Cadmium Telluride (CdTe), Copper-indium- (gallium)-(di)selenide (CIS-CIGS) | •Cheap when there is no land-use constraint •Flexible, available in many colors, shapes and sizes •Helps integration onto buildings |
•Conversion efficiency is limited •Vulnerable to rare earth scarcity •Cadmium toxicity raises concerns |
| Non-silicon-based materials -
-Full organic cells: organic photovoltaic (OPV); -Hybrid: dye-sensitized solar cells (DSSC). |
•Very low manufacturing costs •Not linked to silicon price •No use of rare materials •No pollutants |
•Very low efficiency •Stability issues; UV light, irradiation, electrolyte leaking •Shorter lifespan than competing technologies |
Power Generation Analytics
The Renewable Energy Production in World and Renewable Energy Production in Germany is shown in Figure 3 and Figure 4. The world power consumption has increased from about 112 TWh in the year 2000 to around 157 TWh in 2018 [3, 4]. This increase in consumption of energy is projected to further increase in the years to come and is attributed to not only the global manufacturing and service industry as well as private needs. As the global standard of living increases, so does the demand of energy required to satisfy those needs.
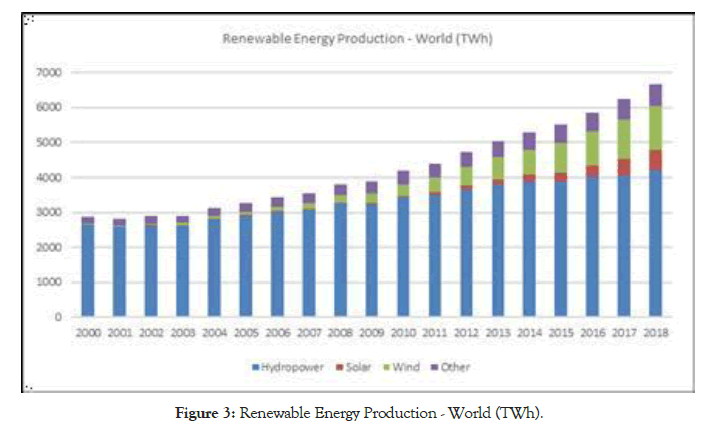
Figure 3: Renewable Energy Production - World (TWh).
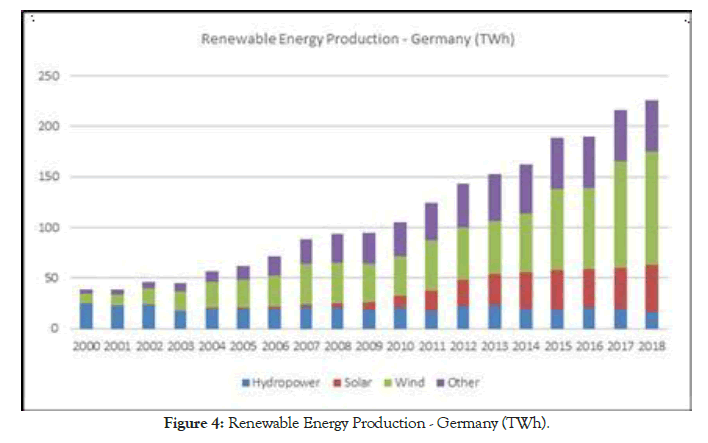
Figure 4: Renewable Energy Production - Germany (TWh).
Germany’s energy transition, called the “Energiewende”, is a major plan for transforming the energy system into a more efficient one supplied mainly by renewable energy sources. In 2010, the federal government adopted the Energy Concept document, which sets out Germany's energy policy until 2050 and specifically lies down measures for the development of renewable energy sources and energy efficiency. In 2011, it was supplemented by the decision to completely phase out nuclear from electricity generation by 2022. As such, “Energiewende” is meant to move Germany towards a low- carbon, nuclear-free energy system by the middle of the century.
In 2019, PV generated 8.2% of gross electricity consumption with an electricity generation of about 46.5 TWh in Germany, all renewable energies (RE) came to 43%. On sunny days, PV electricity can temporarily cover up to 50% of our current electricity consumption. At the end of 2019, PV modules with a nominal output of almost 49 GWp were installed in Germany, distributed over 1.7 million systems [5].
Installation Aspects and Untapped Potential
There always are space constraints while planning a solar generation system for an urban setting. Two key factors playing the most important role are the lack of space in urban metros and the transmission network requirements in order to transport the energy being produced somewhere else to the place of consumption. So, for a city like Berlin, the solar farms on the outskirts of the city other key players in solar power generation apart from that call, the rooftop solar panel implant installations in the city also play a vital role. The city of Berlin boasts of 7181 solar installations in the city with an installed capacity of 97,462 kW and a total of 44,694,204 kWh energy generated in 2018 [6]. A few plants in Berlin produce energy from renewable sources. These plants, however, do not meet Berlin's total demand for electrical energy. Therefore Berlin, as the main customer in the region, takes renewable energy from the surrounding area. This means that today, 22% of Berlin's energy consumption already comes from green energy. The solar power generation of Berlin can be increased by either increasing the number of rooftop installations or by identifying and using installation points that have not been used yet.
There are many different configurations that could be created using a solar electricity installation. These are explained in the Figure 5.
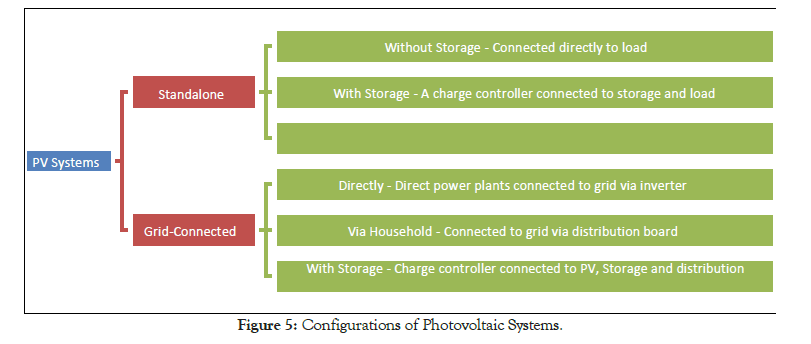
Figure 5: Configurations of Photovoltaic Systems
Canal Project as Inspiration
According to the Central Electricity Authority of India, the average requirement of energy per capita in India is 1,010 kWh. Even though the per capita energy demand is the lowest in the world, there is a substantial need to increase the energy generation as India is emerging as one of the leading manufacturing nations in the world. India recognizes the need for producing clean energy and for this reason, several policies have been enforced. Currently, over 70 per cent of the country’s electricity is generated from fossil fuels, but as per the draft National Renewable Energy Act, the government has a target 175 GW through renewable resources by 2022 and hence renewable energy utilization, particularly solar energy, is being enthusiastically enforced in India. However, land is a precious commodity for India. Justifying the use of land to set up solar plants, which can be used for habitation, cultivation, and manufacturing, is a tough proposition. A key challenge under Smart City Program is to generate solar energy from barren landmass or through rooftops, a requirement which is difficult to accommodate in metropolitan and other large cities. Considering the country’s large irrigation canal network, the Government of Gujarat put forth the concept of construction of solar PV plant on canal top and created the first pilot demonstration project near Sanand, Gujarat, in 2012 [7] is shown in Figure 6.
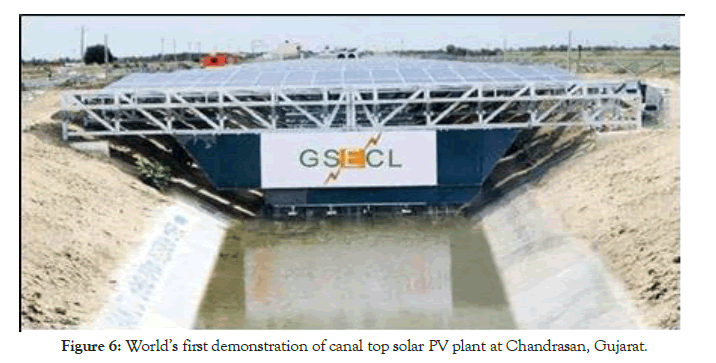
Figure 6: World’s first demonstration of canal top solar PV plant at Chandrasan, Gujarat
This project was developed to be utilised with an extensive network of 19,000-kilometre-long canal system in India. The panel design was developed to be easily replicable over a width of 16 metre, which conveniently includes the widest of canals in India as well. This installation was 750-metre- long with 113 solar panels in total, each 16 metre in width and 4 metre in length and produced around 1 MW energy [8]. This project would then turn into one of the more successful government projects and helped to increase the flexibility of conventional power plants as well as improve irrigation water availability in the surrounding villages.
But since a city like Berlin does not have water availability issues nor does it have ample canal overhead space for an installation like this, new venture must be tested but working on the same principle ground of optimum space utilisation.
Berlin – A New Vista of Thinking
The Berlin U-Bahn (short for Untergrundbahn, "underground railway") is a rapid transit railway in Berlin, the capital city of Germany, and a major part of the city's public transport system. Together with the S-Bahn, a network of suburban train lines, and a tram network that operates mostly in the eastern parts of the city, it serves as the main means of transport in the capital. Opened in 1902, the U-Bahn system serves 173 stations spread across ten lines, with a total track length of 153.1 kilometres (95.13 mi) [9]. The entire system is maintained and operated by the Berliner Verkehrsbetriebe, commonly known as the BVG.
According tothe data collectedandprocessedbyArbeitsgemeinschaft Berliner U-Bahn and Krebsa total of roughly 30 kilometres of track is above ground. The Table 2 below details the above ground track for the respective train lines. This above ground track length presents a potential for the city of Berlin to improve its intrinsic solar energy production, similar as in the case of India’s canal project. The required space is now made available by using the unused overhead of the BVG U Bahn track length. As both networks of BVG U Bahn – Kleinprofil (small profile) and Großprofil (large profile) have 1,435 mm standard gauge track and are electrified at 750 volts DC with underground laid power transmission, overhead wiring and the interferences thereof do not pose a threat to the viability of the overhead solar panel installations.
Table 2: Total Length and Above Ground Length of BVG.
| Line | Total Length | Above Ground | Line | Total Length | Above Ground |
|---|---|---|---|---|---|
| U1 | 9 km | 5.6 km | U55 | 1.6 km | - |
| U2 | 20.7 km | 6.2 km | U6 | 19.9 km | 2.9 km |
| U3 | 11.9 km | 5.6 km | U7 | 31.8 km | - |
| U4 | 2.9 km | - | U8 | 18.2 km | - |
| U5 | 18.4 km | 9.4 km | U9 | 12.5 km | - |
Total Above Ground Length – 29.7 km
Since this system aims at optimum usage of the overhead of the U Bahn network in Berlin, it is important to calculate the appropriate height and width of the supporting structure to be a set default for both - small and large profiles. The Figure 7 gives a comparison of the profiles of the Berliner U Bahn. According to the figure the frame needs to be the double of large profile train width and allow some manoeuvrability room. Taking all the factors into consideration, a width of 7000 mm is decided (2650mm + 2650mm + 50% width + Tolerances). As for the height of the overhead frame 4000 mm is set to cover both profiles. The length can be modified and adjusted according to the track length available. Since the frame is madeup of Truss structure, it can be easily installed and modified. Apart from that standard sizes, angles, curves and bends for the same are available which remove the need of custom designed parts and hence reduces the costs related to the same.
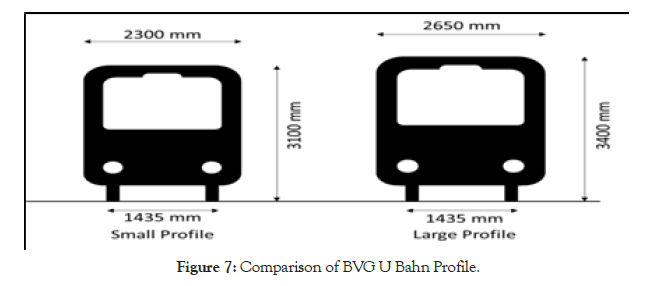
Figure 7: Comparison of BVG U Bahn Profile.
The Figure 8 and Figure 9 demonstrates the proposed Overhead Frame Structure and Panel Layout. A truss is an assembly of beams or other elements that creates a rigid structure. In engineering, a truss is a structure that "consists of two-force members only, where the members are organized so that the assemblage as a whole behaves as a single object" [10]. A "two-force member" is a structural component where force is applied to only two points. Although this rigorous definition allows the members to have any shape connected in any stable configuration, trusses typically comprise five or more triangular units constructed with straight members whose ends are connected at joints referred to as nodes.
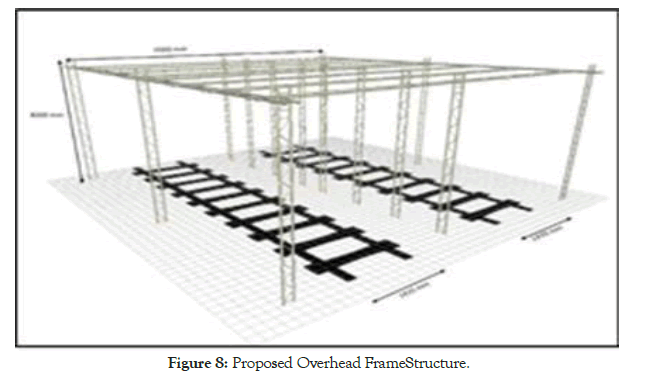
Figure 8: Proposed Overhead FrameStructure.
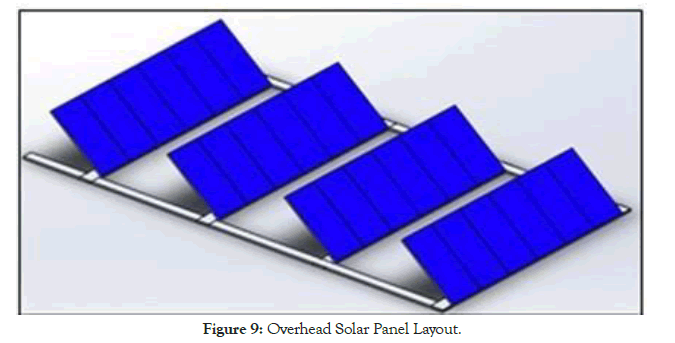
Figure 9: Overhead Solar Panel Layout
These assemblies are extensively used in construction industry but nowadays a more common usage can be found in the truss lighting industry. Lighting truss is aluminium truss used to hold lighting or clamp lighting onto in the illumination industry. It is used to hang and support lighting and moving heads and can also refer to stage lighting and stage lighting truss.
The primary materials most commonly used for stage lighting trusses are Aluminium and Steel. Aluminium, because of its durability, light weight and ease of transport, is the optimum choice as its weight allows for a quick and easy setup and teardown. For installations that are permanent or where high load ratings are required steel truss is the easy choice.
The solar panel module selected for this presentation are 1690 mm long, 1046 mm wide and 40 mm thick in size. The technical data sheet is presented in the Table 3. Considering the width of the frame, there can only be 6 panels installed side by side with 362 mm wide space on both sides for maintenance, wiring and connection purposes.
Table 3: Solar Module Specifications.
| Name | SPR-MAX3-400 |
|---|---|
| Nominal Power (Pnom) | 400 W |
| Power Tolerance | +5/0% |
| Panel Efficiency | 22.6% |
| Rated Voltage (Vmpp) | 65.8 V |
| Rated Current (Impp) | 6.08 A |
| Max. System Voltage | 1000 V IEC |
The number of solar panels that may be installed on a straight length depends on the tilt angle and module row spacing. Figure 10 Determines the Module Inter-Row Spacing. According to the research done by [11,12] the optimal tilt angle for Berlin (Latitude – 52.5 N, Longitude -13.4 E) is around 30 degrees. Using the Sun path chart program of the Solar Radiation Monitoring Laboratory of the University of Oregon (UO Solar Radiation Monitoring Laboratory), solar elevation angle can be calculated for the month ranges. The worst-case scenario is during the winter solstice (December 21st) between 9 AM and 3 PM. More optimum for Berlin would be planning the system excluding the months of November, December and January where is the winter is as its peak and solar irradiance at the minimum. Following the calculations provided by (Diehl, 2020) and the data from the Sun path chart shown in Figure 11, a row width of roughly 4 metres is calculated. To note is that these calculations are done for a system with fixed axis solar panels. In the global and annual average, 2-axis tracked panels, 1-axis horizontal tracked panels, 1-axis vertical tracked panels, and optimally tilted panels receive ∼1.39, ∼1.35, ∼1.22, and ∼1.19 times the incident solar radiation as do horizontal panels, respectively. As such, on average, 2-axis tracked panels receive 39% more incident solar radiation than horizontal panels do and 17% more than do optimally tilted panels [12].
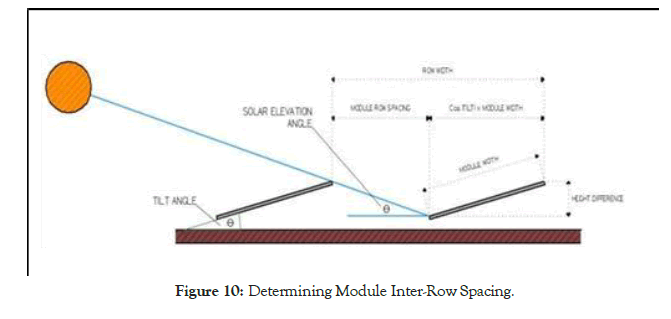
Figure 10: Determining Module Inter-Row Spacing
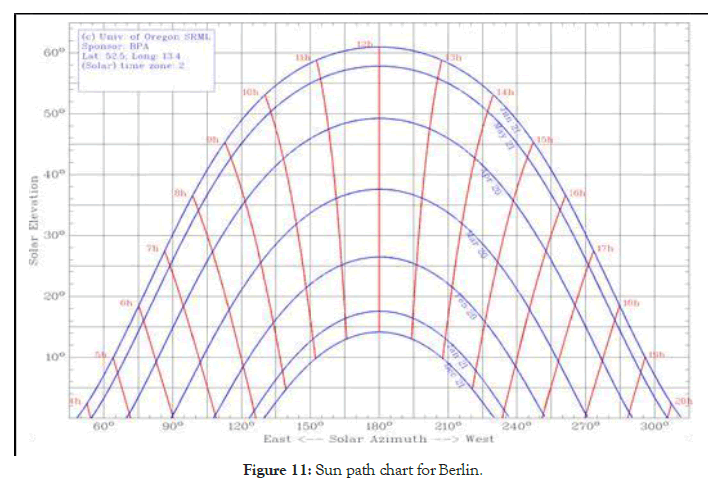
Figure 11: Sun path chart for Berlin.
| Total Track Length | 29700 Metres |
| Assumed Usable Track Length | 20000 Metres |
| Row Width | 4 Metre |
| Total Rows | 5000 |
| No. of Modules per Row | 6 |
| Total Modules | 30000 |
| Power Generation per Panel | 400 W |
| Total Power Generation | 12,000,000 W (12 MW) |
As is mentioned above, the available over ground track length in Berlin is around 29.7 km. Considering just two thirds of this to be usable (covered railway stations, entrances to tunnel and other non-feasible zones) it still gives roughly a stretch of 20 kilometres. Provided there could be 6 PV modules installed every 4 metres, a total of 5000 module rows could be installed. This corresponds to 30,000 PV modules each with a rated power of 400 Watts. The total installed capacity is increased by 12,000,000 kW or 12MW. According to the German Weather Service (German- “Deutscher Wetterdienst”) global radiation in 2019 in Berlin ranged from 1141 annual hours to 1160 annual hours [13]. Since solar radiation is not evenly and entirely reliable due to the uncontrollable weather conditions and other factors, it is safe to assume that the range is reduced to around 765 annual hours to 780 annual hours. This amounts to an estimated total energy of 9,270,000,000 kWh produced annually. This increases the installed capacity of Berlin from roughly 97.5 MW to roughly 109 MW corresponding to an increase of 12% considering a fixed solar panel array.
The difficulty with solar panels is that they are static (i.e., mounted in fixed position) while the sun isn’t. As a result, the sun doesn’t always strike them in such a way as to maximize solar energy capture. This is especially true in the morning or evening, and (to a lesser degree) in winter, when the sun’s angle relative to earth decreases. Ideally, the sun’s rays should be perpendicular to the panels, with sunlight reaching the panels at a 90-degree angle. Solar trackers, which angle the panels as the sun moves across the sky, are an attempt to solve these problems. These trackers can increase solar output by 50 percent in the summer and up to 20 percent in the winter.
Tracking systems come in two basic categories: single-axis trackers move east and west to follow the sun. Dual-axis trackers also incline, or tilt, to accommodate the difference between winter and summer solstice sun angles [14]. According to the study and research done by [12] the estimated increase in the energy generation can be summarized as Table 4 below:
Table 4: Estimated increase in the energy generation.
| Current Output | 12 MW |
|---|---|
| 1 Axis Vertical Tracking (+22%) | 14.64 MW |
| 1 Axis Horizontal Tracking (+35%) | 16.2 MW |
| 2 Axis Tracking (+39%) | 16.68 MW |
Table 5 displays the total length, above ground percentage and the above ground length of the U Bahn rail system in various cities in Germany. This table was created according to the research done by Anna Mayr for the Zeit Magazine in Germany and the data provided by the organizations responsible for handling the day to day operations of the rail network of the respective cities.
Table 5: Above-Ground Track Length in Various Cities.
| City | Total Length | Over ground % | Over ground Length |
|---|---|---|---|
| Hamburg | 106.4 | 58 | 61.7 |
| Hannover | 121.0 | 85 | 102.85 |
| Essen | 19.6 | 50 | 9.80 |
| Dortmund | 75.0 | 83 | 62.25 |
| Düsseldorf | 68.5 | 94 | 89.77 |
| Köln | 198.5 | 79 | 156.82 |
| Bonn | 95.8 | 82 | 78.56 |
| Frankfurt | 64.9 | 62 | 40.24 |
| Stuttgart | 130.0 | 83 | 107.90 |
It could be easily observed that there lies an untapped potential of solar energy generation in Germany and it increases even more as we move towards the south of the country. As a thumb rule, Northern places of Germany are more suitable for Wind Energy and the Southern places are more suited to Solar Energy generation.
Considering the calculations done for Berlin in this paper and applying the same to these other cities over 250 MW of clean, green and renewable energy could be generated.
As is evident from the research and calculations covered in this paper, metropolitan cities can provide a large area for solar power generation which is untapped as of now. As with every project implementation, this comes with its own set of challenges. The permissions from the relevant regulatory bodies is the first challenge if this project needs to be implemented. But even before that, various simulations and studies need to be undertaken by independent organisations to provide with the pros and cons of this project. A project of such magnitude requires infrastructural analysis such as those for the trusses and the foundation of the truss structure. Other mechanical components include panel flooring and panel fitting. On the electrical side there the solar panels themselves, the wiring for the complete setup, transformers, controllers for efficient automation of the network and most importantly the incorporation of this setup in the existing transmission network. Then come the policymakers and policies costs. During the setup employee and labour costs add in the total cost of the project. Once finished, maintenance costs for the network also need to be accounted for. In 2009, the Rothenburg Solar Park was commissioned, and it was completed in 2010 witha cost of around 60 million euros. Adjusted for inflation it amounts to roughly 70 million euros in 2020. Considering the current retail price of each solar panel to be around 400 euros including taxes, the solar panels alone amount to roughly 12 million euros. It is safe to say that considering all the factors this cost may reach up to 80 million euros for Berlin. Depending on the length of the train network this cost may increase or decrease in other German cities. This is where the government needs to step in alongside private investors and make the project feasible. Although completely renewable energy is still a long way to go for humankind, this may be a small contribution to make the planet a bit better by the end of next 50 years.
Citation: Wadhwa A, Vats D, Kumar A (2020) Solar Power Generation Improvement in Metro Cities Using Overhead Panels – A Case Study of Berlin. J Fundam Renewable Energy Appl 10:6. doi: 10.4172/2090-4541.1000278
Received: 22-Jul-2020 Accepted: 14-Oct-2020 Published: 21-Oct-2020 , DOI: 10.35248/2090-4541.20.10.278
Copyright: 2020 Anant Wadhwa. This is an open access article distributed under the term of the Creative Commons Attribution License, which permits unrestricted use, distribution, and reproduction in any medium, provided the original work is properly cited