Journal of Clinical Trials
Open Access
ISSN: 2167-0870
ISSN: 2167-0870
Review Article - (2012) Volume 2, Issue 1
In almost every clinical study missing values represent a problematic aspect of research. The goal of complete data could rarely be achieved and at least single missing values can hardly be prevented. Common statistical procedures that are implemented in most of the statistical standard software products, however, are based on a complete data set which means that for all variables every single value has to be present. In case of a missing value the regarding observation, e.g. a study patient, will be excluded from the analysis population. This approach is called ‘complete case analysis’ (CCA). However, lots of important problems are coming along with CCA which highly challenge their applicability. The omission of whole observations may lead to a drastic reduction of the number of cases, to a change in the variability of the parameters, to a reduced validity of the study and because of the possibly deleted structure equality to biased parameter estimates. Moreover, the CCA method clashes the highly regarded analysis principle of intention to treat (ITT) in clinical studies where all observations has to be analyzed according to the randomisation list and have to be taken into account for the analysis. Observing the stated reasons it is much more astonishing that nevertheless CCA is frequently used [1].
The most meaningful problem with missing values is the potential bias of the results and the consequent decrease of the study’s validity. The bias can refer to the estimated treatment differences, affect the comparability of the study arms and query the representativity of the study population (so called “selection bias”). If, for example, all those patients with a small (or no) therapy success in the placebo group leave the study and only those patients continue who at least partially improve, the actual large treatment difference cannot be detected via the CCA method, since the data for the treatment failure are not considered within the analysis. Missing values especially then lead to incomparable study arms or to an unrepresentative analysis population when the missing values occur systematically. The validity of the results is highly restricted in these situations.
In particular, the use of CCA for the evaluation of large epidemiologic data sets is problematic. The models used in epidemiology usually contain a relatively high amount of covariables to ensure the structural equality of the at-risk groups of primary interest. However, the more variables are included in a model, the greater is the probability that a variable is affected from missing values and thus the whole observation unit is excluded from the evaluation. As a result, with an increased number of covariables the number of cases is reduced according to the example which was stated before and that directly has an effect on the statistical power.
There are obviously many pitfalls regarding the use of the CCA approach. Although Vach et al. [2] showed that this principle provides acceptable results in special missing data situations, its use cannot be recommended in general. The application of the CCA method may act as a part of a sensitivity analysis in the course of a missing data analysis, but to figure the problem of incomplete data sets other policies has been developed.
To tackle the problem of missing values more suitably as in the course of a CCA, several imputation strategies dealing with those missings have been developed in the last decades. At that, the substantial distinction is made between the so called Single Imputation (SI) and Multiple Imputation (MI). Within SI every missing value is replaced by one reasonable value. For this purpose deterministic (mean imputation, hot deck/cold deck/regression imputation) and stochastic methods (estimated value is adjusted by a random error term) are on hand. Within MI every missing value is substituted by several reasonable values which are based on distribution or Markov Chain Monte Carlo (MCMC) methods. Moreover, there are model based strategies to handle missing data which do not replace the missing values explicitly but consider the underlying mechanism of the missings in the data model.
There is no guideline yet that explicitly controls the handling of missing data. In the ICH E 9 guideline “Statistical Principles for Clinical Trials” [3] just a short paragraph is dedicated to the problem of missing values. The topic is considered more detailed in the EMEA guideline “Points to Consider on Missing Data” [4] and the “Guideline on missing data in confirmatory clinical trials” [5] which has recently been published by the EMEA in 2009. But all these cited publications are more or less focused on the prevention of missing data rather than handle them if they are existent.
This article serves as a listing of appropriate software solutions with respecting remarks for the treatment of missing values in real data sets. However, this listing cannot be complete. The authors were not dedicated to present an extensive comparison of the results of the different software tools because of the plainly higher effort which would have exceeded the scope of this publication. Statistical analysis software underlies a permanent development (or improvement) with new versions and/or new methods. The subsequent mentioned programs and related internet addresses display the status of November 2011 and the experiences of the authors with the different solutions. It was not possible to check all the cited information in the quoted sources, so these should be handled with care by the reader. To what extend the programs and routines are validated should be found in the corresponding documentations.
The article is constructed as follows: at the beginning in section 2, an outline for the diagnostics of missing values is given. Furthermore, the authors introduce the main imputation strategies SI and MI. In section 3 several programs for handling and replacement of missing values are presented. In 3.1 two special programs for the handling with missing data are presented: the program NORM and the commercial software SOLAS. Meanwhile there are solutions to deal with missing values within the big and popular statistical software packages. In section 3.2 the solutions for SAS, SPSS, S-Plus/R and STATA are described. More software solutions that may be more practical in certain applications are terminally listed summary in section 3.3. At the end of the paper one can find a short recap of the presented theoretical and practical aspects and several advices for the usage of the software as well as several websites with much information about missing values and overviews about software solutions (under the assumption that these sites are maintained by the respecting authors).
The usage of the most appropriate imputation method to handle missing data is highly dependent on the results of the missing data diagnostic. This diagnostic includes different aspects which describes causes of the missings , dependencies between observed and missing values (e.g. if missings occur increased in men or smokers), the distribution of the missings in the data set and finally the amount of missings, too.
Most important for choosing an adequate imputation method is surely the array of missing values in the data set (i.e. their distribution and the amount), the so called missing data pattern, and the possible causes for the appearance of missing data (i.e. particularly the dependencies between observed and missing values), say missing data mechanism.
At the identification of the pattern one essentially distinguishes between two of them. If the missings fail widespreadly and more or less isolated across the whole data set, the pattern is called arbitrary or nonmonotone. In contrast, one has to deal with a monotone pattern if the data can be arranged as displayed in (Figure 1a). As we will see, specific imputation methods require a monotone pattern, for example, and cannot be used in case of an arbitrary pattern. In Figure 1, the variables V1 to V4 mark either a repeatedly measured outcome variable or a set of incomplete covariables.
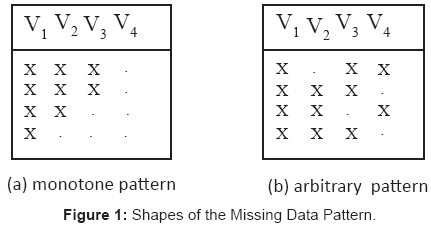
Figure 1: Shapes of the Missing Data Pattern.
The description of the dependencies between observed and missing values is well established and can be traced back mainly to Rubin, Little and Allison [1,6,7]. A distinction is made between three categories: Missing Completely At Random (MCAR), Missing At Random (MAR) and Missing Not At Random (MNAR). At MCAR the likelihood of a drop-out is entirely independent of the outcome or covariables. MAR means that the probability of missing is only dependent on the observed values, where MNAR stands for an additional dependency of the missing probability upon the missing values itself or other, not observed variables. Indeed, it’s almost impossible to identify the underlying mechanism explicitly and to prove it in the real data. Often there is no strict distinction of a certain mechanism, since it’s a matter of compound what makes this aspect of missing data diagnostic so difficult. Some of the established imputation methods only give unbiased results in case of a MCAR mechanism (e.g. CCA), most of the methods are at least able to deal with MAR.
Imputation approaches
Due to the already discussed drawbacks of the CCA method, the missing values of an incomplete data set should be imputed to be able to work with standard procedures of statistical data analysis. For that, there are so called single or multiple imputation methods.
At single imputation (SI) every missing value is replaced by one plausible value so that there is only one generated complete data set. All deterministic imputation procedures perform a single imputation, for example the mean or the median of the observed data, as well as Hot Deck and Cold Deck techniques. There are also regression procedures or stochastic imputation methods [1,8] within the SI framework.
Within the multiple imputation (MI) strategy a missing value is displaced by more (m > 1) plausible values so that m completed data sets are resulting from the imputation process (Figure 2). These data sets are then analyzed separately by the same analysis method with a standard software program that is based on a complete data set. Afterwards the results of these analyses are merged to joint estimators and standard errors. The MI approach is graphically displayed in the following figure and more precisely explained in Little and Rubin [1].
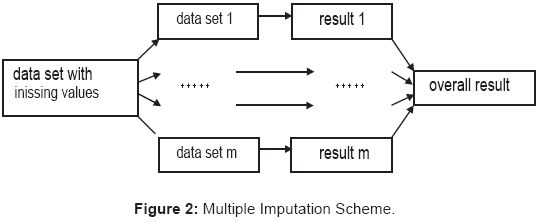
Figure 2: Multiple Imputation Scheme.
The main advantage of the MI strategy in contrast to the methods of SI is the correct consideration of the standard errors. At MI, the imputation itself is considered as an additional source of variance at the estimation of standard errors. Hence the confidence intervals and p-values are computed more accurate as with any SI procedure. The most often used MI approaches involve regression methods and iterative procedures, e.g. based on markov chains (MCMC approach).
In the following, we summarize all imputation approaches into four main classes of imputation methods in order to make clear which classes of imputation methods can be applied within the presented software packages: standard single imputation (SI), regression imputation (RI), multiple imputation (MI), and (e.g . for repeated measure data sets) modelling approaches (MA) (Table 1). It has to be noticed that this classification scheme is individually chosen by the authors and can not necessarily be viewed as a “gold standard”. The wide range of different imputation methods aggravates the classification because some of them have been constructed for very special data situations.
| Imputation class | Included methods |
| SI | mean imputation, median imputation, Hot Deck/Cold Deck approaches, Last Observation Carried Forward (for longitudinal studies) |
| RI | regression imputation, logistic regression imputation, propensity score imputation, stochastic regression imputation (all in case of a monotone pattern only) |
| MI | MCMC, Expectation Maximisation Algorithm, discriminant function analysis |
| MA | mixed models, full maximum likelihood estimation, pattern mixture models, selection models |
Table 1: Classes of imputation methods.
No detailed description of the methods is given since the main objective of this review is to present the various options of software packages that are able to deal with missing values.
Within this section we will give an extensive overview of the currently existing software for the imputation of missing values in clinical data sets. Initially, our focus lies on special software products that have been created for the explicit handling of missing data. In section 3.2 we will then present useful relevant modules for the application in case of missing data within standard software packages for statistical analyses. In the last section 3.3 we will look at further software solutions that can handle the problem of missing data with some specialized features.
Specialized software for handling missing data
There are some specialized software solutions for the handling and imputation of missing values, especially for MI. These software packages basically conduct the imputation of missing values and give back the completed data sets for additional evaluations. The actual analysis can be performed with the accustomed statistical software of the data analyst. Beside the data transfer (data entry and data output) to the imputation program one has to care after the analysis of the m imputed data sets in the course of a MI for the appropriate combination of the m single results, especially the combination of the variance components is of importance [1]. In this chapter we initially describe the application of Schafer’s developed public domain software NORM. The following section 3.1.2 presents references for the commercial software SOLAS which has also been developed particularly for the diagnostic and imputation of missing values. In Deal’s article [9] these two products are compared with each other and Deal concludes that his “limited investigation has not identified a clear winner between SOLAS 3.2 and NORM 2.03”.
NORM: NORM was developed by Schafer and is based on multivariate normally distributed models that are described in his book [10]. With NORM a multiple imputation can be implemented. The user can apply the Expectation Maximisation (EM) algorithm and/ or the Data Augmentation algorithm (MCMC) as imputation method. The EM algorithm is a likelihood-based approach for the estimation in case of incomplete data sets [11]. Fast ad hoc imputation methods (SI class) are not implemented, but these are anyway rarely eligible imputation methods.
A substantial advantage of NORM is that it can be downloaded for free at http://www.stat.psu.edu/~jls/misoftwa.html. It is easy to learn and easy to use. However, cumbersome data preparation is necessary to import the data into NORM.
The actual version NORM 2.03 is stand-alone for Windows. The file that should be adapted has to be imported in NORM, since the program cannot be incorporated into another software. On this one creates an ASCII file containing all the values of the variables. Every data set has to stand in one row and the values of the variables have to be separated by blanks or tabs. Missing values must get an appropriate numerical coding. This file must not have variable names and has to be saved as dat-file. For the assignment of the values to their corresponding variable names an eponymous file in the nam-format has to be set up. The variable names have to be written row per row one below the other and this file has to be saved in the same folder (Figure 3).
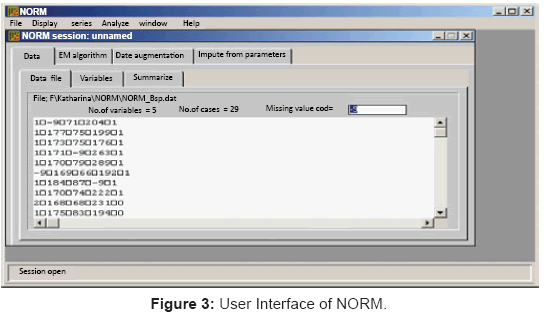
Figure 3: User Interface of NORM.
The results of NORM are completed files without variable names in the ASCII format. These files have to be imported in any statistical program to perform the data analysis.
Concluding, the NORM program exclusively performs an imputation of the basis of methods of the MI class. Thus, an adequate imputation of missing values is possible in case of an arbitrary missing data pattern and when the missings are MCAR or MAR.
SOLAS: SOLAS (version 4.0) is a commercial software product for the treatment and the imputation of missing values. The program is distributed by the Statistical Solutions Company which also provides lots of other statistical software packages [12]. SOLAS was developed in cooperation with Rubin, the “innovator” of multiple imputation and has surely the biggest scope of performance in the field of diagnostic and imputation of missing values.
SOLAS 4.0 can perform SI and MI methods for arbitrary and monotone patterns when the missings are at least MAR (Figure 4).
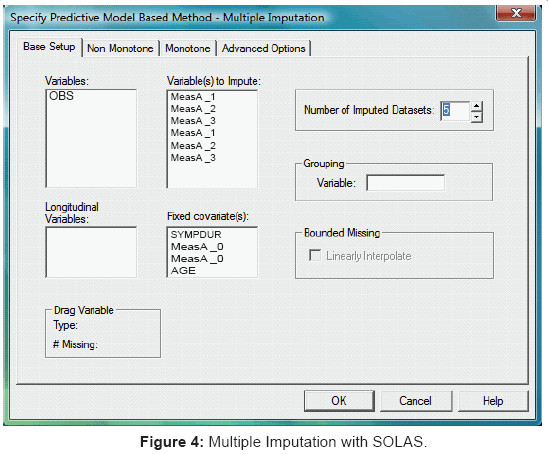
Figure 4: Multiple Imputation with SOLAS.
A trial version and comprehensive information material regarding methodology, features, statistics and data management are available on the cited web page. In contrast to NORM, import or export of data is possible from SAS, SPSS, S-Plus, SYSTAT, Stata, BMDP, Excel and ASCII [cite web page]. A licence for the academic sector is 650 EUR (860 US $), for the commercial use it is 895 EUR (1185 US $, effective September 2011). According to the information of the Statistical Solutions Company, SOLAS is validated. A few documents concerning the validation are provided on the web page. SOLAS runs on Windows since version 95.
Standard statistical software packages and their handling of missing values
Analysing data is usually done by popular and large statistical software packages. There are lots of these packages and it is not possible to check all of them for the opportunity to handle and impute missing values. So we assembled here those packages with their respective features which are mostly used in research (SAS, SPSS, S-Plus/R and Stata). However, we did not find any essential applications for the treatment of missing values in other packages in the course of our extensive investigations.
SAS: SAS (version 9.2) [13] is brand leader within software packages for statistical analysis and is often used in clinical research at universities and the pharmaceutical industry. To exploit the full capacity regarding the imputation of missing values, the wide SAS syntax language has to be deployed. Via the existing mouse and menu controlled surfaces the imputation methods are not available. SAS offers the possibility to program so called ‘macros’ which serve as subprograms that conduct additional and individual analysis routines. SAS users often apply these subprograms so that beside the official procedures for the treatment of missing data many of these macros are published and available. The most important ones are presented here after the internal SAS methods.
PROC MI & PROC MIANALYZE: PROC MI (actually in 9.2) is able to output the missing data pattern and to impute missing values by the methods EM algorithm, MCMC algorithm (data augmentation), multiple regression, logistic regression, predictive mean matching and discriminant function (RI and MI classes). The work of Allison [7,15,16], Rubin [6] and Schafer [10] is very important therefore. The methods ‘logistic regression’ and ‘discriminant function’ are especially designed for the imputation of missing categorical variables [8]. For the description of the methods, look at the online documentation of SAS at http://support.sas.com/documentation/cdl/en/statug/63347/HTML/ default/viewer.htm#/documentation/cdl/en/statug/63347/HTML/ default/mi_toc.htm.
Yuan [14] describes the potential of PROC MI [17] intensively but this refers still to SAS 9.0.
In addition to PROC MI, SAS offers the procedure PROC MIANALYZE which suitably combines the results of a multiple imputation, e.g. for regression analyses, that was conducted with PROC MI. Simple imputation methods like mean imputation (SI class) have been able to be performed much earlier in SAS. Imputation methods are typically available within the procedures PROC STANDARD / PROC STDIZE (Base SAS), PROC PRINQUAL (SAS/STAT) and PROC EXPAND (SAS/ETS).
In general, the available methods of PROC MI are applicable in situations where the patter is arbitrary or monotone and the missing data mechanism in not MNAR.
SAS macros for treating missing data: Below, the own developments of the authors and most cited SAS macros for the treatment of missing values are presented and described briefly.
SAS macros of Allison: As one of the most important authors regarding the methodology and the application of missing data handling, Allison [7,15,16] has created SAS macros for multiple imputation. These macros originate from the time before PROC MI and have been, among others, the basis of the development of the procedure. The following macros can be downloaded at http://www. ssc.upenn.edu/~allison/#Macros
MISS (version 1.05) uses the EM algorithm to estimate the parameters of a multivariate normal distribution when data are missing, and optionally generates multiple imputed data sets using the methods of Schafer. (MI class)
COMBINE (version 1.03) takes estimates based on multiple imputed data sets and combines them into a single set of estimates and associated statistics. (MI class)
COMBCHI (version 1.0) takes chi-square statistics from multiple imputed data sets and produces a single p-value.
SAS macro of Raghunathan et al: IVEWARE [18]: IVEWARE (Imputation and Variance Estimation) is a SAS-based software package [19]. With IVEWARE a multiple imputation can be performed (SI, MI, RI classes) like in MICE (see 3.2.3 S-Plus). The macro is able to perform single or multiple imputations using a sequential regression method and to perform a variety of descriptive and model bases analyses accounting for complex designs as clustering, stratification and weighting (a respecting User’s Guide can also be found on the cited web page).
SAS Macros of Hohl and Muche: %MISSDESCRIPTION and %MISSING: Hohl and Muche have developed two macros for the diagnostic and the imputation of missing values based on PROC MI: %MISSDESCRIPTION and %MISSING [20,21]. The macros for SAS version 9 can be downloaded on http://www.uni-ulm.de/med/medbiometrie/ forschung/sas-makros-fuer-missing-values.html
The macro %MISSDESCRIPTION can be used for the description of a data set regarding missing values. With the macro %MISSING single and multiple imputation (SI, MI, RI classes) can be performed. For SI, in case of continuous variables, the SAS procedure PROC STDIZE is used. Missings can be imputed through the median or the mean of the available observations. In case of categorical variables, an additional generation of an own missing category is possible [20]. The specification of %MISSING concerning the suitable imputation methods is given within Figure 5.
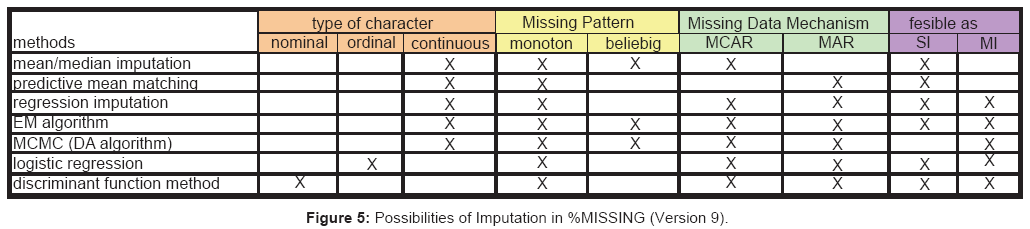
Figure 5: Possibilities of Imputation in %MISSING (Version 9).
SAS macro of van Buuren: MISTRESS : MSITRESS is a method for the imputation of categorical data [17]. The SAS-IML macro MISTRESS, Version 1.17, is actually available on http://www. stefvanbuuren.nl/mistress/index.html (SI class).
SAS macro of Gregorich: EM_COVAR: Steve Gregorich provides on http://lib.stat.cmu.edu/general/em_covar.sas the SAS program EM_COVAR. This macro estimates, based on the EM algorithm, a maximum likelihood covariance matrix and a corresponding mean vector (MI class).
SPSS: SPSS [22] is a software package which is often used in social science and psychology. With a mouse and menu controlled user interface , the use of this package is easy to learn. In the basic package of the software only few possibilities for the handling of missing data (MI class) are implemented. Mainly, the relevant methods are provided within respective additional packages. The following modules are applicable for the diagnostic and the imputation of missing values:
SPSS Data Validation: The module “Data Validation” is provided since version 14 and can be used for diagnostic aspects of missing data analysis [23], e.g. pattern recognition, summary of variable distributions and outlier detection.
SPSS Missing Value Analysis (MVA): The module MVA is the main product of SPSS for the diagnostic and imputation of missing values [24]. However, earlier versions of SPSS gave hints that the use of this module is not accurate within the imputation of missing data. So von Hippel [25] wrote that with the implemented EM algorithm only a single imputation can be done (SI class). Similar experiences with the SPSS module MVA (11.0) are also described by Voelkner [26] in his diploma thesis where he states that “the implementation of the EM algorithm in SPSS in insufficient…since the calculated standard deviations are too small”.
Since version 17.0 SPSS provides the possibility to perform a multiple imputation for categorical and continuous variables within the MVA module. One can choose a MCMC method or a so called monotone method for the MI procedure. What is meant by the ‘monotone method’ could unfortunately not be figured out based on the information provided by SPSS.
Amos 6.0: An alternative to MVA in SPSS (since version 14.0) is the usage of AMOS [27]. It is actually a module to perform structural equation models in SPSS, but also serves methods for imputing missing data. Regression or Baysian approaches for the imputation (RI, MI and MA classes) are possible (see “features and benefits” on the cited web page). These options are not included in the basic SPSS features and have to be purchased additionally. With the Amos package it’s possible to tackle the missing data problem even in MNAR cases since the structural equation models can be used to model a missing mechanism explicitly.
S-PLUS / R: S-Plus [28] is a commercial statistical package that is based on the “statistics language” S. The open source software package R (version 2.13.2), which is available on http://www.r-project.org, is also based on S. Both software products are very similar, so they are presented here together. However, different versions of S-Plus and R are necessary for applications.
S-Plus includes a few methods to perform a multiple imputation (RI and MI classes) since version 6. It is possible to conduct imputations by use of the EM or MCMC algorithm in case of both discrete and continuous variables [29]. For both S-Plus and R, user-written packages for the most important imputation methods are available. The major contributors were Schafer (NORM) and van Buuren (MICE).
S-Plus programs of schafer: NORM, CAT, MIX and PAN: Currently Schafer provides four different MI packages (including NORM) for S-Plus (version since 3.3) on http://www.stat.psu.edu/~jls/ misoftwa.html#top.
NORM: Multiple imputation of multivariate continuous data under a normal model.
CAT: Multiple imputation of multivariate categorical data under loglinear models.
MIX: Multiple imputation of mixed continuous and categorical data under the general location model.
PAN: Multiple imputation of panel data or clustered data under a multivariate linear mixed-effects model.
S-PLUS Program of van Buuren: MICE: Another important pack age for performing a multiple imputation (MI class) is MICE, a program of van Buuren’s team from Leiden/Netherlands [30]. This program implements a MI method based on chained equations. MICE is available for S-Plus (since version 4.5), R (since version 1.8) and Stata on http://web.inter.nl.net/users/S.van.Buuren/mi/hmtl/mice.htm. MICE is for arbitrary patterns of missing data.
The package for Windows and UNIX can be downloaded on the above-mentioned website or on http://www.cran.r-project.org/.
S-PLUS/R package of Harrell: HMISC: The S-Plus and R package HMISC of Harrell [31] contains several functions for the imputation of missing values (SI, RI and MI class) in combination with routines for analyzing and combining the data [32]. The most recent version is executable for S-Plus from version 6.0 and/or R version 2.0 and is . Some functions from HMISC are listed in the following.
AregImpute: Multiple imputation based on additive regression, bootstrapping and predictive mean matching (RI, MI, SI)
Impute: Impute missing data (generic method) (SI).
Naclus: function for examining similarities in patterns of missing values across variables
Other R packages : Moreover, there are several packages in R (current version 2.13.2) for the handling of missing data. The following packages can all be downloaded from http://cran.r-project.org/web/ packages. We give just a short description for every package, together with the author and the release date, to give the reader an impression about the actuality (Table 2).
| Name | Information |
| arrayImpute | This package was developed by Lee, Yoon and Park in 2007. It has been created for the imputation of missing values in micro array data |
| mi | This one was designed by Gelman, Hill, Yajima, Su and Pittau. It is available since 2009 and works for the imputation of missing values and for model tests |
| mitools | Implemented are tools for multiple imputation (Lumley (2008)) (MI class) |
| monomvn | Within that package it is possible to estimate in a multivariate normally distributed data situation with monotone pattern of the missing values (Gramacy (2008)) (RI, MI classes) |
| mvnmle | A package of Gross (2008) for the maximum likelihood estimation of multivariate normally distributed data with missing values (MI and MA classes) |
| norm | Novo (2002) has created a package for the analysis of multivariate normally distributed data with missings. The work of Schafer serves as a basis for that (MI class) |
| vim | With this package of Templ and Alfons (2009) it is possible to visualize and impute missing values (SI, RI and MI classes) |
Table 2: R packages.
| Software | Module | MDD | SI | MI | MA | RI |
| NORM (2.3) | x | x | ||||
| SOLAS (4.0) | x | x | x | |||
| SAS (9.2) | PROC MI | x | x | x | x | |
| %MISSDESCRIPTION | x | |||||
| %MISSING | x | x | x | |||
| of Allison | x | |||||
| Macros | EM_COVAR | x | ||||
| MISTRESS | x | |||||
| IVEWARE | x | x | ||||
| SPSS (19.0) | x | x | ||||
| Data Validation | x | |||||
| Modules | MVA | x | x | |||
| Amos | x | x | x | |||
| S-PLUS (8.2) / R (2.13.2) | x | x | ||||
| CAT | x | |||||
| MIX | x | |||||
| PAN | x | |||||
| Packages | MICE | x | ||||
| HMISC | x | x | ||||
| arrayImpute | x | |||||
| mi | x | |||||
| mitools | x | |||||
| VIM | x | x | x | x | ||
| Stata (12.0) | x | x | ||||
| MICE | x | |||||
| Modules | HOTDECK | x | ||||
| LISTMISS | x | |||||
| AMELIA | x | |||||
| EMCOV | x | |||||
| MPLUS | x | |||||
| PreScreen | x | |||||
| XMISS | x | |||||
| WINMICE | x | x |
Table 3: Missing Data Software and their Possibilities (MDD=Missing Data Diagnostic, SI=Standard Single Imputation, MI=Multiple Imputation, MA=Modelling Approaches, RI=Regression Imputation available).
Stata: Stata (version 12) is an extensive statistical package which is frequently used in epidemiologic research [33]. In the current software package there is the ‘impute’ command which performs single imputation. Other missing value modules are presented in the following.
Stata module of millar: LISTMISS: For a missing value diagnostic, the Stata module LISTMISS can be used which was developed by Millar [34].
Stata module of cox: NMISSING: A bit more extensive is the module NMISSING which can be used to count the number of missing values in the variables and/or the observations in the data set [35].
• General stata modules: Special stata modules (so called “ados”) can be searched and additionally installed within Stata by the “webseek” command. Modules in the field of missing data are for example the following (SI, MI and RI classes): “meanscor” (for missing values in logistic regression)
• “pattern” or “mvpatt” (missing data pattern analysis)
• “pcamv” (a PCA with ML estimation of the covariance matirx in case of missing values with the opportunity to impute)
• “regmsng” (imputation with a regression alternative)
• “whotdeck” (a weighted alternative of hot deck imputation)
• “misum“ (descriptive statistics of estimations based on multiple imputation)
• “miest“ (combination of results across multiple data sets and estimation based on multiple imputation)
Stata module of Royston/van Buuren: MICE: An important module within Stata is the software package MICE of van Buuren (see 3.2.3) which was implemented by Royston [36]. It is possible to perform a multiple imputation (MI class) with the commands “mvis” (imputation step) and “micombine” (combining of results). A presentation of Royston at the Stata Conference 2005 regarding the applications and backgrounds is provided at http://www.stata.com/ meeting/11uk/royston.ppt.
Stata module of mander and clayton: HOTDECK : The HOTDECK module has been written by Mander and Clayton and enables to do a hot deck imputation (SI class). At http://ideas.repec. org/c/boc/bocode/s366901.html the procedure is described more precisely.
Some more software solutions for the treatment of missing data
During our research for software products to handle the problem of missing data we found more information about special software (see 3.1) and statistical software packages (see 3.2) as presented up to now. These are rendered with their corresponding web pages (retrieved November 2011) in the actual section without bigger annotation because they may give valuable hints to some of the readers. The authors have no experience with these products and can therefore not make evaluative judgements. The software products are listed in alphabetical order.
AMELIA: AMELIA II [37] is a Windows program for multiple imputation [38] (MI class) and was developed by the team around Gary King. The program utilizes a fast EM algorithm which is deduced by NORM and exists already in second version 1.2-0. The Windows version needs only the operating system Windows is stand-alone and menu-controlled. Besides the Windows version there is a procedure for the software R. For both versions a PDF and online documentation is available at http://r.iq.harvard.edu/docs/amelia/amelia.pdf
EMCOV: EMCOV (Estimation of Means and Covariances) is a software package of Graham and Hofer [39] for the imputation of missing values via the EM algorithm (MI class) and is based on the methods of Schafer [10]. It works within DOS and UNIX [40].
LISREL / PRELIS: LISREL (version 8.8) is by the own admission of the distributor SSI the leading statistical software for structural equation models [41]. Within the last Windows version of the software there are several applications , including LISREL for structural equation modelling and PRELIS for data manipulations and basic statistical analyses. The program part PRELIS especially contains modules for the imputation by matching and multiple imputation (MI class). At the company’s web page there is a User’s Guide for PRELIS with the corresponding descriptions of these modules.
MPLUS: MPLUS (Version 5.2) is a statistical package for latent class analyses. At http://www.ats.ucla.edu/stat/mplus/seminars/ IntroMplus/default.htm, there can be found the main information about MPLUS. The program can be used for different analysis situations and for the investigation of the data structure regarding missing values.
PreScreen: PreScreen (version 2.1) is written in MATLAB 5 . The main applications and especially the feature of missing value detection are described on http://www.cpact.com/about_us/software/prescreen.
XMISS: Another important feature within the statistical software package LogXact by Cyrus Mehta is the XMISS command. It handles missing covariables within a general linear model (GLM) [42].
WinMICE: WinMICE of Jacobusse is a Windows application of the S-Plus program MICE (van Buuren, see 3.2.3, MI class) and can be downloaded for free on the web page http://web.inter.nl.net/users/S. van.Buuren/mi/docs/WinMICEsetup.exe.
This article gives an overview about the available software possibilities for handling missing data in research data sets. The initial presentation of the most important theoretical aspects is followed by an extensive compilation of different software tools for the imputation of missing data is given. Due to the variety of programs which were presented, we outline in this summary the most relevant packages with their functionalities in Table 3. It is stated which imputation strategies the regarding program allocate and which special modules are required therefore.
However, it is not possible to point out special programs explicitly and recommend them for specific data analysis situations. The decision which program should be used to face the problem of missing values depends on the analysis plan on the one hand and especially on the previous knowledge of the actual analyst on the other hand. In our opinion, the analysts with previous knowledge in one of the commonly used standard software packages like SAS, SPSS or R/S-Plus should use them, too, for the handling of missing data with the respecting modules. Researchers without knowledge of a certain software are advised to use the open source software NORM of Schafer to impute the missing values and process the completed data further with established statistical software. NORM is conceived relatively user-friendly and the amount of adjustable program features is held assessable so that the first results can be achieved really fast. Moreover, NORM especially implements the MCMC approach of the MI strategy which can be seen most likely as a uniform approach for various missing data situations.
The main focus of the article was to give the reader a summary of available software packages that are able to deal with missing data, but additionally she should basically be informed about the most preferable imputation methods as well. To give the reader a consistent terminology through the paper, four classes of imputation methods have been defined within section 2. In general, the methods of the MI classes should be the methods of choice. Their main advantage over all SI methods is the more valid estimation of imputed values due to the explicit consideration of the imputation itself as an additional source of variance. But one has to know that even the MI methods are only applicable in situations where the underlying missing data mechanism is MCAR or MAR. In case of a MNAR mechanism, which is very difficult to handle, only the methods of the MA class lead to eligible imputed values if the missing data mechanism is correctly taken into account. The final decision which method of the appropriate imputation class should be used depends then on the underlying missing data pattern which has to be identified in advance in the course of a comprehensive missing data diagnostic. All the methods of the defined RI class, for example, are only applicable in case of a monotone pattern. A more general imputation method is the MCMC approach of the MI strategy which can be applied for arbitrary missing data patterns.
Information on eligible software solutions can be largely found in methodological journals or on the internet. Articles in journals stand out due to the fact that they describe and comment the treatment of missing values under special aspects of statistical analyses. In this way the principle approach for the own analyses can be adapted, but the related software hints should always be checked for their actuality. As an example one may look at the article of Horton and Lipsitz [29] which was published in The American Statistician with the title „Multiple Imputation in Practice: Comparison of Software Packages for Regression Models with Missing Variables“. This article restricts oneself to the description and the comparison of software tools for multiple imputation in the exclusive context of regression methods. Imputation software without statistical analysis methods, e.g. NORM or SOLAS, is left out in this comparison. However, the authors give advices to such packages so that the article could anyway serve as a starting point for own retrieval. Another example is the article of Hox [43] with the title “A Review of Current Software for Handling Missing Data” where the programs SPSS, SOLAS and NORM are used.
The newest information on software solutions for the treatment of missing data usually can be obtained more up to date on the internet because journal articles often become obsolete quickly. Since application software is frequently modified, the actuality of information is essential. Within the investigations for this article we took notice of several web pages that can act as a starting point for an own summary on the subject of missing data. The site http://www.missingdata.org. uk of Carpenter and Kenward (London School of Hygiene & Tropical Medicine) offers a wide overview on missing values with lots of examples and basics [44]. The department of Sheldon Ekland-Olson, University of Texas, gives general statements to special questions in the field of missing data at http://ssc.utexas.edu/software/faqs. Last but not least, one gets at http://www.multiple-imputation.com to the web page of van Buuren [45], leader of the TNO in Leiden, Department of Statistics, with extensive information about MI and the respecting software.
Above that, there only remains the advice to use search engines for scientific articles of the concerning methodology in journals. The research of imputation theory is a field which still contains much development potential, especially if the actual level of guidelines is regarded. The existing methods are improved continuously and offer starting points for refinement. At that, the cited web sites display a snapshot of the actual state of research and serve currently as a state of the art of developmental stage.
The overall conclusion regarding the topic of missing value imputation is that a multiple imputation is always preferable to a single imputation because MI includes the variability due to the imputation itself much better than SI. Hence a software package which offers MI methods is highly recommended.