Poultry, Fisheries & Wildlife Sciences
Open Access
ISSN: 2375-446X
ISSN: 2375-446X
Research - (2025)Volume 13, Issue 1
Survey study on production and marketing of small ruminant, constraints and opportunities in Hadero Tunto Zuriya district of Kembata Tembaro Zone SNNPR have been carried out using structured questionnaire with the objective to generate base line information on small ruminant production, marketing, constraints and opportunities for production and marketing. Study sites were selected purposively by considering the agro ecological set ups and small ruminant population. All kebeles in the study district were identified with respective number of small ruminants and four kebeles were selected having the largest small ruminant (sheep and goat) populations. Households that have small ruminants and a minimum of one year experience in small ruminant production and/or fattening were identified and listed in each kebele and 30 households per kebele were randomly selected. A total of 120 households were selected from the district for this study. Respondents reported that grazing on communal land, private pastures and stubble, crop residue, weeds and roadside are major feedstuffs of sheep and goats. All small ruminants are housed for protection from adverse weather conditions and predators. The average age at weaning, puberty and first parturition (in months) of sheep were found to be: 4.9, 6.93 and 14.46, respectively. The corresponding values for goats were 4.01, 6.73 and 13.27 respectively.
Small ruminants are widely reared in a crop-livestock farming systems and are distributed across different agro-ecological zones of Ethiopia. Sheep and goats production is an important activity for smallholders, particularly for resource poor farmers in many parts of the country. They provide a vast range of products and services such as immediate cash income, meat, milk, skin, manure, risk spreading/management and social functions. They are also sources of foreign currency. Sheep and goats, with their higher reproductive capacity and growth rates, are ideally suited to production by resource-poor smallholders.
Improvement in small ruminants’ productivity can be achieved through identification of production constraints and introduction of new technologies or by refining existing practices in the system. In Ethiopia, the small ruminant production system in different agro-ecological zones is not studied fully and farmers’ needs and production constraints have not been identified. Assessment of the small ruminants’ production system and identification and prioritization of the constraints of production is a prerequisite to bring improvement in small ruminants ‘productivity in the country. Prioritization of the production constraints is essential as it helps to use the scarce resources efficiently. Understanding the production system helps to design appropriate technologies, which are compatible with the system. Therefore, this study was initiated with the following objectives [1].
Objectives of the study
General objectives: To characterize small ruminant production and marketing systems in the study area.
Specific objectives
• To assess the traditional management and performances of small ruminants.
• To identify challenges of and opportunities for small ruminant production and marketing.
Description of study areas
The study was conducted in Hadero Tunto Zuriya district, Kembata Tembaro zone of Southern nations nationalities and peoples regional state of Ethiopia. Hadero is bordered on the South by the Wolayita zone, on the west by Tembaro woreda, on the North by the Hadiya zone and on the East by Kacha Bira district and the total area of the district is 17,169 km2. Hadero Tunto Zuriya district is located between 37°35’-37°40’ E longitude and 7°10’-7°15’N latitude with altitude ranging from 1501 to 2500 m.a.s.l (District report, 2017). Its mean annual maximum and minimum temperatures are 22.5°C and 17.6°C, respectively, whereas the mean annual rainfall of the district varies from 1201 to 1400 mm. It receives a bimodal rainfall, namely the main rainy season and short rainy season. The main rainy season extends from the beginning of July to mid of September while the short rainy season starts at the end of December and lasts up to the end of February. The district has three agro ecology namely ‘Dega’ (33%) (>2300 m.a.s.l), Moist ‘Weyina dega’ (53%) (1800-2100 m.a.s.l), Dry ‘Weyina Dega’ (13%) (<1700 m.a.s.l) (District report). Gelebe, Hachecho, Lalo and Ajora kebeles were the targeted study site within the district. The first one represents ‘Dega’ the second two kebeles represent Moist ‘Weyina Dega’ and finally the last one represented Dry ‘Weyina Dega’ [2].
Sampling methods and data collection
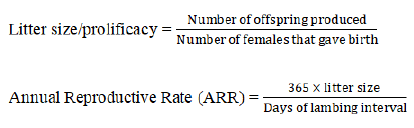
Prior to the main sampling attempt, discussions were made with districts livestock experts to make clear the purpose of the study and collaborations needed during the study. All kebeles in the study districts were identified and ranked based on the number of sheep and goats and selected by considering agro ecology and access to infrastructure. From the total 15 rural kebeles (8, moist midlands, 5 highlands and 2 dry midland), 4 representative kebeles were selected based on the secondary data and participation of district livestock and crop experts [3]. The selected kebeles were Gelbe (High land), Hachecho (Moist mid altitude), Lalo (Moist mid altitude) and Ajora (Dry mid altitude). Households that have small ruminants and a minimum of one year experience in small ruminant production and/or fattening were identified and listed in each kebele and 30 households per kebele were randomly selected. Accordingly, 120 rural households were interviewed. Litter size and annual reproductive rate was estimated according to the following formula:
Statistical data analysis
Data collected through questionnaire were analyzed by descriptive statistics using Statistical Package for Social Sciences (SPSS 20). Chi-square was employed when required to test the independence of categories or to assess the statistical significance. Indices were calculated to provide ranking of the reasons of keeping sheep and goat, production constraint, selection criteria and contribution of different farming activity to the family food and income etc.
Demographic characteristics of the households
Sex, family size and education background of the respondents in study area are presented in Table 1. The male headed households were greater than female headed ones. Majority of the household were in the active productive age (15-55 years old) and about 64 % having attended different levels of education [4].
| Descriptor | Highland kebele (n1=30) | Moist midland kebeles (n2=60) | Dry midland kebele (n3=30) | Over all (N=120) | X2 | P-value |
|---|---|---|---|---|---|---|
| Household sex (N/%) | ||||||
| Male | 27 (90) | 58 (96.7) | 24 (80) | 109 (90.8) | 6.7 | 0.035 |
| Female | 3 (10) | 2 (3.3) | 6 (10) | 11 (9.2) | ||
| Educational status (N/%) | ||||||
| Illiterate | 10 (33.3) | 22 (36.7) | 11 (36.7) | 43 (35.8) | 2.5 | 0.862 |
| Grade (1-5) | 9 (30) | 17 (28.3) | 6 (20) | 32 (26.7) | ||
| Grade (6-10) | 8 (26.7) | 14 (23.3) | 11 (36.7) | 33 (27.5) | ||
| Grade (>10) | 3 (10) | 7 (11.7) | 2 (6.7) | 12 (10) | ||
| Household family size (Mean/SE) | P-value | |||||
| Family size | 7.4 (0.45) | 6.3 (0.23) | 7.4 (0.27) | 6.87 (0.18) | 0.008 | |
| Active worker (15-55 yr) | 5.6 (0.64) | 3.6 (0.28) | 4.9 (0.45) | 4.45 (0.25) | 0.002 | |
| Note: *Highland kebele=Gelbe; Moist midland kebeles=Hachecho and Lalo; Dry mid land kebele=Ajora; SE=Standard Error; Ãç2=Chi-Square | ||||||
Table 1: Age, sex educational level and family size of the household.
Household occupation and landholding
The household occupation and land holding is presented in Table 2. Major occupation in the district was farming followed by both farming and non-farming activity. There was significant variation (P<0.05) in total land holding among agro ecology, where the land holding for highland kebele was the highest.
| Major occupation (N/%) | Highland kebele | Moist midland kebeles | Dry midland kebele | Overall | X2 | P-value |
|---|---|---|---|---|---|---|
| Farming activity | 22 (73.3) | 37 (61.7) | 20 (66.7) | 79 (65.8) | 1.22 | 0.543 |
| Both farming and non-farming activity | 8 (26.7) | 23 (38.3) | 10 (33.3) | 41 (34.2) | ||
| Land holding (ha, Mean/SE) | P-value | |||||
| Total land | 1.36 (0.09) | 1.09 (0.07) | 0.45 (0.59) | 1.0 (0.05) | 0.000 | |
| Crop land | 1.26 (0.09) | 0.98 (0.07) | 0.33 (0.04) | 0.89 (0.05) | 0.000 | |
| Grazing land | 0.1 (0.008) | 0.097 (0.006) | 0.06 (0.017) | 0.09 (0.005) | 0.047 | |
Table 2: Major occupation and land holding.
Livestock holding and composition
The farmers in the study kebeles rear different types of livestock. Cattle, sheep, goat, horse, donkey, mule and chicken rearing are common in the area. Farmers also keep bee colonies. There was significant (P<0.05) difference in number of sheep and equine among the study kebeles. Goat accounts for major small ruminant holding [5].
Cattle being the most important animal constituted 81% of the total TLU while sheep, goats, equines and chicken constitute 5.48%, 10%, 2.88% and 0.51%, respectively (Table 3).
| Livestock species (Mean/SE) | Highland kebeles | Moist midland kebeles | Dry midland kebele | Over all | P-value |
|---|---|---|---|---|---|
| Cattle | 4.85 (0.58) | 3.96 (0.32) | 3.03 (0.31) | 3.95 (0.24) | 0.026 |
| Sheep | 3.76 (0.52) | 1.86 (0.24) | 0.063 (0.23) | 2.03 (0.21) | 0 |
| Goats | 4.9 (0.63) | 3.21 (0.32) | 3.96 (0.66) | 3.82 (0.28) | 0.05 |
| Equines | 0.53 (0.14) | 0.06 (0.32) | 0.16 (0.07) | 0.20 (0.045) | 0 |
| Chicken | 3.85 (0.79) | 5.18 (0.50) | 3.37 (0.46) | 4.68 (0.38) | 0.156 |
| TLU (Mean/SE) | |||||
| Cattle | 3.97 (0.39) | 2.89 (0.23) | 2.23 (0.26) | 3.0 (0.17) | |
| Sheep | 0.37 (0.05) | 0.18 (0.02) | 0.06 (0.02) | 0.2 (0.02) | |
| Goats | 0.49 (0.06) | 0.32 (0.03) | 0.39 (0.06) | 0.38 (0.028) | |
| Equines | 0.27 (0.07) | 0.033 (0.016) | 0.083 (0.034) | 0.10 (0.023) | |
| Chicken | 0.009 (0.003) | 0.028 (0.004) | 0.009 (0.003) | 0.18 (0.002) | |
| Total | 5.1 (0.57) | 3.45 (0.3) | 2.8 (0.38) | 3.86 (0.24) | |
Table 3: Livestock holding per individual household in the study area.
Purpose of keeping sheep and goat
The primary reason for keeping small ruminant was as a source of income generations through the sale of live animals (Table 4).
| Purpose | Rank | Index | |||
|---|---|---|---|---|---|
| 1 | 2 | 3 | 4 | ||
| Income | 70 | 27 | 16 | 6 | 0.387 |
| Meat | 13 | 62 | 22 | 10 | 0.283 |
| Saving | 18 | 11 | 29 | 48 | 0.205 |
| Distribute benefits/risks with other animals | 9 | 7 | 20 | 31 | 0.124 |
Table 4: Purposes of keeping sheep and goats.
Feed resources, seasonal availability and utilization
The common feed resources in the study area are given in Table 5. There was significant (P<0.05) difference among the study site or agro ecology in availability of feed resources. Enset and banana leaf were the major feed resource in the highland kebele followed by weed and private grazing.
| Descriptor | Highland kebele | Moist midland kebeles | Dry mid land kebele | |||||||||
|---|---|---|---|---|---|---|---|---|---|---|---|---|
| Rank | Rank | Rank | ||||||||||
| Feed resource | 1 | 2 | 3 | Index | 1 | 2 | 3 | Index | 1 | 2 | 3 | Index |
| Communal grazing | 2 | 3 | 2 | 0.078 | 3 | 7 | 9 | 0.089 | 3 | 6 | 6 | 0.15 |
| Road sides grazing | 4 | 4 | 3 | 0.128 | 8 | 12 | 10 | 0.161 | 4 | 4 | 3 | 0.128 |
| Grazing stubble | 2 | 5 | 3 | 0.106 | 9 | 3 | 5 | 0.106 | 5 | 3 | 5 | 0.144 |
| Private grazing | 6 | 3 | 1 | 0.139 | 9 | 4 | 7 | 0.117 | 3 | 0 | 2 | 0.061 |
| Crop residues | 0 | 1 | 4 | 0.033 | 4 | 5 | 7 | 0.081 | 1 | 5 | 4 | 0.094 |
| Browse species | 0 | 3 | 2 | 0.044 | 5 | 5 | 8 | 0.092 | 3 | 4 | 4 | 0.117 |
| Improved forages | 0 | 9 | 5 | 0.128 | 3 | 4 | 5 | 0.061 | 9 | 0 | 0 | 0.15 |
| Enset and banana | 11 | 0 | 3 | 0.2 | 7 | 2 | 0 | 0.069 | 0 | 3 | 3 | 0.05 |
| Weeds | 5 | 2 | 7 | 0.144 | 12 | 18 | 9 | 0.225 | 2 | 5 | 3 | 0.106 |
Table 5: Major feed resource available in the study area.
The main feed types supplemented for sheep and goat for fattening purpose were all parts of Enset from pseudo stem to tip part of leaves, banana leaves and stem from green fodder followed by grains and concentrates and salt/bole and household food leftovers and attela [6].
Sheep and goat breeding management
Productive and reproductive performances of sheep and goat: Productive and reproductive performance of sheep and goat flocks are given in Table 6.
| Parameter | Sheep | Goat | ||
|---|---|---|---|---|
| Male | Female | Male | Female | |
| Mean (SE) | Mean (SE) | Mean (SE) | Mean (SE) | |
| Weaning age (month) | 4.9 (0.174) | 4.01 (0.123) | ||
| Age at puberty (month) | 6.78 (0.11) | 7.08 (0.09) | 6.56 (0.12) | 6.90 (0.11) |
| Slaughter age (month) | 8.8 (0.28) | 8.17 (0.29) | 8.46 (0.29) | 7.66 (0.17) |
| Age at first parturition (month) | 14.46 (0.18) | 13.27 (0.17) | ||
| Parturition interval (month) | 7.93 (0.14) | 6.85 (0.11) | ||
| Litter size | 1.44 (0.13) | 1.77 (0.21) | ||
| Annual reproductive rate | 0.93 (0.17) | 1.57 (0.28) | ||
Table 6: Productive and reproductive parameters of sheep and goat flocks.
Flock management practices: The majority of the respondents (66.7%) castrate their male animals (Table 7). About 11.8% of the households uses modern methods of castration (using Burdizzo) at kebeles animal clinic. The majority (81.6%) of the households use traditional methods (using stick, stone to crash vas deference of the testes) of castration.
| Particulars | N (%) |
|---|---|
| Castrate sheep and goat | 80 (66.7) |
| Traditional method | 62 (81.6) |
| Modern method | 9 (11.8) |
| Both (traditional and modern) | 5 (6.6) |
| Provide special management for fattening animal | 107 (89.2) |
| Practice culling of sheep and goat | 89 (74.2) |
| Dock/cut tail of female sheep | 54 (45) |
| Mean (SE) | |
| Age at tail dock of female sheep (days) | 7.52 (0.48) |
Table 7: Management practice of the flock.
The selection criterion for small ruminant in the study area is given in Table 8. The results indicate that the primary selection criteria for sheep (42.5%) and goat (44.1%) were based on conformation while physical trait was the second criteria for the sheep (34.5%) and goat (36%).
| Characteristics | Sheep | Goat |
|---|---|---|
| Conformation | 37 (42.5) | 49 (44.1) |
| Known local ecotype | 16 (18.4) | 18 (16.2) |
| Physical trait | 30 (34.5) | 40 (36) |
| Age | 4 (4.6) | 5 (4.5) |
Table 8: Selection criteria of sheep and goat flock (N/%).
Housing of sheep and goats
Different types of houses, housing materials and the common housing systems are shown in Table 9. The majority of the respondent (48.3%) house sheep and goat in the adjoining house together with cattle. About 30.8% of the respondent house sheep and goat in the main house together with the family. Separate sheep and goat housing was also reported by 20.8% of households.
| Housing and construction | Highland kebele | Moist midland kebeles | Dry midland kebele | Overall |
|---|---|---|---|---|
| Main house | 12 (40) | 17 (28.3) | 8 (26.6) | 37 (30.8) |
| Adjoin house | 14 (46.6) | 27 (45) | 17 (56.6) | 58 (48.3) |
| Separate house | 4 (13.3) | 16 (26.6) | 5 (16.6) | 25 (20.8) |
| Material used to build pen | ||||
| Grass thatched | 21 (70) | 22 (36.6) | 5 (16.6) | 48 (40) |
| Wood | 9 (30) | 38 (63.3) | 25 (83.3) | 72 (60) |
| Total | 30 (100) | 60 (100) | 30 (100) | 120 (100) |
Table 9: Housing of sheep and goats in the study area (N%).
Household division of labor for management of sheep and goats
In general, all activities regarding management of sheep and goat were similar and done by the family labor (Table 10). Although all household members were involved in sheep and goat management activities to a varied degree, respondents reported specific responsibilities of the different household members. Purchasing and selling of sheep and goats was the major responsibility of husband (mostly household heads) followed by wife, boys and girls. About 90.8% husbands possess more power in deciding the use of incomes generated from sale of animals and skins.
| Tasks | Responsibility | |||
|---|---|---|---|---|
| Men (%) | Women (%) | Boys (%) | Girls (%) | |
| Flock herding | 30.5 | 15.8 | 44.2 | 7.5 |
| Cut-and-carry feeding | 29.2 | 31.7 | 20 | 19.2 |
| Watering flock | 10.8 | 48.3 | 15 | 25.8 |
| Clean flock barn | 1.7 | 55.8 | 1.2 | 41.3 |
| Care for young flock | 2.5 | 33.3 | 19.2 | 45 |
| Fattening managements | 66.7 | 31.7 | 1.7 | - |
| Treat sick flock | 60 | 37.5 | 0.8 | 1.7 |
| Sale sheep and goats at markets | 64.2 | 20 | 12.5 | 3.3 |
| Decides on use of proceeds | 90.8 | 9.2 | - | - |
| Owner of the flocks | 64.2 | 12.5 | 15 | 8.3 |
Table 10: Labor allocation in sheep and goat management.
Sheep and goat marketing
Household marketing: Sheep and goat are sold to fulfill immediate cash requirements. About 12.9% and 11.4% of the household’s reported that selling sheep and goats to generate incomes for purchasing family food items and farm inputs during cropping seasons.
Sheep and goats production and marketing constraints
Sheep and goat production constraints: The problem of diseases and parasites, inadequate quantity and poor quality of feed were similar across the sites (Table 11).
| Constraints | Highland kebele | Moist midland kebeles | Dry mid land kebele | |||||||||
|---|---|---|---|---|---|---|---|---|---|---|---|---|
| Rank | Rank | Rank | ||||||||||
| 1 | 2 | 3 | Index | 1 | 2 | 3 | Index | 1 | 2 | 3 | Index | |
| Diseases and parasites | 7 | 0 | 5 | 0.21 | 17 | 12 | 10 | 0.32 | 14 | 5 | 12 | 0.4 |
| Feeds and nutrition | 3 | 8 | 2 | 0.21 | 14 | 21 | 12 | 0.36 | 6 | 22 | 8 | 0.4 |
| Lack of technologies | 3 | 8 | 6 | 0.25 | 4 | 8 | 7 | 0.13 | 1 | 0 | 4 | 0 |
| Lack of extension support | 7 | 0 | 3 | 0.19 | 9 | 2 | 3 | 0.13 | 3 | 3 | 4 | 0.1 |
| Lack of input | 3 | 4 | 1 | 0.14 | 5 | 2 | 0 | 0.07 | 1 | 0 | 0 | 0 |
Table 11: Major constraints of sheep and goat production according to the respondent.
Marketing constraints of sheep and goats: About 25.8% of the households reported taxation as a primary marketing problem, particularly charges imposed in cases where animals are not sold in one or more market days. About 25% of the household responded that sheep and goats marketing are highly abused by brokers. About 11.7% of the total respondents reported that they hold less power to determine sale prices. About 14.2% stated lack of access to incentive for export and domestic markets.
Household and farming characteristics
The family size reported in the present study was higher than the average family sizes (5.9) of the country. The presence of large family size might be attributed to labor demand for agricultural activities in the area and lack of awareness about proper family planning methods. The ages of the majority of the respondents were between 15-55 years which is in agreement with the report by Tassew and Seifu from Bahir Dar Zuria and Mecha districts [7]. The presence of large proportion active working force (between 15-55 years old) can be an opportunity to undertake different agricultural activities effectively. The result of this study shows that majorities of the respondents were literate, which could help farmers to adopt new technologies and innovations in the communities.
Household occupation and land holding: The average land holding in the present study was consistent with the 1.3 ha reported for Burie district. Landholdings range from 1.01 to 2.00 ha for about 30.8% of farmers in the SNNPR and for 33.3% of farmers at the national level. The average land holdings per household in Hadero Tunto Zuriya districts was lower than that was reported (1.93 ha) by Belete for Gomma district of Jimma zone [8]. However, land holding found in this study is higher than the regional (0.73 ha) and comparable with the national (1.22 ha) holdings. The average crop land holding in the present study was consistent with 0.94 ha reported for Gamo gofa zone. On the other hand, the mean grazing land holding per household observed in the present study was lower than 0.24 ha/HH reported by Fsahatsion, et al. [9]. The size of landholding is an important factor that determines availability of feed for livestock.
Livestock holding and composition: The overall mean cattle holding in current study was consistent with the values (3.75 and 3.9) reported for Bensa district of Sidama zone and Bati area of Amhara Region, respectively. However, the overall mean cattle holding of the households in the current study were lower than the value (10.4) reported by Hulunim for Borena area of Oromia Region [10]. The overall mean goat holdings in the current study were similar with the figure reported for Kochere district Gedio Zone, SNNPRS. Keeping small number of animals is related to the availability of feed resources. The higher number of cattle could be attribute to the high demand of cultivation activities, cash sources and animal source foods. The small number of small ruminant holding could due to shortage and poor productivity of grazing land.
The higher proportion of goat and cattle as compared to sheep might be due to the fact that goat can thrive well under adverse and hot climatic conditions (disease and drought), respectively, while sheep are considered more sensitive to hot environment.
Sheep and goat production and management
Feed resources, seasonal availability and utilization: Weeds, grazing stubble and road side grazing were common feed sources in the study area. Tesfaye indicated that natural pasture was the main source of feed for livestock in Ethiopia [11]. Alemayehu estimated that natural pasture provides from 80%-90% and crop residues 10%-15% of the total livestock feed intake in Ethiopia [12]. Although there are differences in the utilization across months of the years, communal grazing lands are utilized throughout the year. The availability and quality of forages are not favorable and uniform in all year round. As a result, indigenous browses are other sources of feed in the study area especially for goats which are mostly found in dry mid land kebele compared to moist mid and high land kebeles. Belete reported that indigenous browses are sources of feed other than natural pasture in Goma District of Jimma Zone. Yeshitila also reported the utilization of indigenous browses as feed resources in Alaba district of SNNPR [13].
Productive and reproductive performances of sheep and goat: The mean weaning age for kids and lambs in this study is earlier than 5.9 and 6.6 months reported in Kochere district and 4.8 and 5.3 months, in Wolaita area, respectively, for kids and but comparable with 4 and 4.6 month respectively for kid and lamb in Alaba area. This could be attributed to the relative better feed supply compared to the densely populated Kochore and Wolaita areas. The mean age at puberty for sheep observed in this study is comparable to 6.7 month for male and 6.9 month for female sheep in Alaba area SNNPRS. The mean age at puberty reported for goats is also comparable with observation of Tsedeke who reported 6.6 months for male and 7 month for female goat.
Slaughter ages observed in this study are earlier than the findings of Adugna who reported 10.8 months for both male and female kids and 13.5 months for female and 13.8 months for male lambs.
FAO reported age at first lambing ranging between 16.2 and 16.9 months and that at first kidding from 13.5 to 17.5 months in mixed farming systems of sub-Sahara African countries. Early age at first parturition observed in this study agree with finding of Wilson reported management decisions concerning the age at which females should be mated for the first time may be based on a minimum age, on a minimum weight or on a combination of both criteria [14]. The same investigator found that under uncontrolled breeding systems in Ethiopia, about 95% of ewes conceived for the first time before the age of 15 months. Lambing interval for ewes found in this study confirms earlier report of Wilson ranging between 230-437 days. Yilkal also reported a comparable lambing interval of 8.1 month in Chencha district Gamo Gofa zone [15]. Kidding interval observed in this study is earlier than 9 to 12 months for flocks in Awassa Zuria woreda. Similar with the present finding Tsedeke and Yilkal reported kidding interval of 6.9 and 6.8 months in Alaba district and Mirab abaya district of Gamo Gofa zone, respectively. According to Tsedeke report shorter kidding interval could attribute to the uncontrolled breeding systems.
According to the response of the respondent, the average litter size or prolificacy observed in this study are comparable to observations in African flocks ranging between 1.08 and 1.75 for does and 1.02 and 1.43 for ewes. Endeshaw also reported litter size of 2.07 for goats in drier parts of Dale district [16]. Foote reported litter size between 1.01-1.60 for tropical sheep. Selamawit and Matiwos also reported average litter size 1.78 for sheep and 1.7 for goat in Gedio zone of SNNPRS [17].
The reproductive performance of the breeding female is possibly the single most important factor influencing flock productivity and there is evident potential of high reproductive efficiency in African indigenous small ruminants. Traditional breeders appear to exploit this potential relatively well, especially concerning age at first parturition and the intervals between successive births.
Flock management practices: Castrating of ram and bucks is common practice in the study area. Most of the respondent use traditional method of castration, which is consistent with the previous reports from Bati, Borena and Siti area of Amhara, Oromia and Somali regions, respectively. The average age of castration reported for sheep and goats in the present study area was higher than other reports. Generally almost all household practice castration to fetch more money from the sale of fattened sheep and goats. Facilitating easy mating was the main reason of the respondent to dock their female sheep.
Besides to the dynamics of flocks through major exit routes, the study identified that body conformation (height and length) and physical characteristics (coat color, horn, tail) are the major criteria that household consider to select sheep and goats for castration and fattening. This agrees to the findings of Jainter, et al. who reported that growth (conformation and growth rates), color, horns and breeds are important traits of owners in the Gambian [18].
Housing of sheep and goats: Housing sheep and goats is common practice in the study area. The respondent confines all sex and age group together including lamb and kids. Small ruminant are sheltered for protection in most rural communities such as southern part of Ethiopia; in central rift valley; and in Metama district of Amhara region. However, places of sheltering and type of house vary. The major reason for housing flocks is to minimize attack by predators and to avoid theft. Predators rarely destroy barns and main houses and causes complete loss of flocks. The results conform to the ones reported by Geoff and Trevor that most smallholder farmers keep their livestock in buildings and pens made from local materials such as wood or sun dried bricks, thatch from local grasses and bush poles [19].
Sheep and goat marketing and marketing constraints
The result from the study indicated that sheep and goat are sold coinciding with several factors, the most important being the need of immediate cash to meet up some sudden and unforeseen family needs besides selling the animals when there are incidences of diseases in the area. Sometimes sheep and goat are also sold when there are shortage of food and feed in the area; during these times the farmers keep only a few animals (to serve as replacement stock and other are sold off). In these household sheep and goats are considered as the major farmbuffering assets. Similarly, Tsedeke reported that rural households do not sale large animals and other farm resources for urgent needs because acquiring back them is not easy. Therefore, sheep and goat are always at disposal to buffer disaster of the farm households.
Marketing constraints of sheep and goats: Marketing of sheep and goat generate significant incomes to the rural households. However, they face various marketing constraints. Households selling sheep and goat are often interfered by excessive tax and seasonality of markets, access to incentive and brokers. The results of the group discussion revealed that producers were not market oriented; they did not consider when to produce sheep and goats, even the preferable time of sales was not considered by a majority of the farmers. And also the absence of market information exposes small holder producers for exploitation by brokers. Similar to the current study lack of market information was one of the constraints of small ruminant marketing in Burie district and other parts of the country [20].
Sheep and goats production constraints
Small ruminant production in area prioritized the major constraints as diseases and parasite, feed and nutrition deficiency and lack of extension support. In contrast, respondent in the current study condemned that the current extension system is providing them little support to enable them to expand their flock production. It is anticipated that the extension service system could impartially support the farming activities that uphold the livelihood of the smallholder farmers.
Sheep and goats are providing an evident contribution through income, food, manure, saving and social and cultural functions. However, the current extension system in the district is undergoing insignificant intervention towards addressing the identified bottlenecks. Lack of input to build flock holding and purchase production inputs (largely health and feeding) is among limiting factor for respondents.
[Crossref] [Google Scholar] [PubMed]
[Crossref] [Google Scholar] [PubMed]
Citation: Bedru M (2025) Small Ruminant Production and Marketing: Constraints and Opportunities in Hadero Tunto Zuriya District, Kembata Tembaro Zone, Southern Ethiopia. Poult Fish Wildl Sci. 13:291.
Received: 04-Dec-2023, Manuscript No. PFW-23-28325; Editor assigned: 06-Dec-2023, Pre QC No. PFW-23-28325 (PQ); Reviewed: 20-Dec-2023, QC No. PFW-23-28325; Revised: 09-Jan-2025, Manuscript No. PFW-23-28325 (R); Published: 16-Jan-2025 , DOI: 10.35248/2375-446X.25.13.291
Copyright: © 2025 Bedru M. This is an open-access article distributed under the terms of the Creative Commons Attribution License, which permits unrestricted use, distribution, and reproduction in any medium, provided the original author and source are credited.