
Journal of Clinical Trials
Open Access
ISSN: 2167-0870

ISSN: 2167-0870
Research Article - (2021)Volume 11, Issue 3
Mutations on Epidermal Growth Factor Receptor (EGFR) cause a variety of cancers including breast and lung cancers. The single mutation T790M on the tyrosine kinase domain of EGFR signifies the response to the cancer drugs gefitinib, which leads to the development of resistance to such a drug. Detecting the mutation thus provides effective therapeutic options for patients who are in need of cancer drug treatments. We sought to develop a facile, rapid detection method for the T790M mutation using Bridged Nucleic Acids (BNA), which has been known to enhance the hybridization affinity of oligonucleotides. Oligonucleotides containing BNA bases, called BNA-clamp and designed to block PCR reaction against wild-type genes were used to discriminate the presence of mutant genes mixed with a large number of wild-type genes. Real-time PCR in conjugation with BNA-clamping allows us to observe different degrees of PCR amplification depending on the ratio of wild-type and mutant genes. In an effort to explore the possibility, several 13-mer oligonucleotide clamps were prepared with various numbers of BNA bases. Tm value analysis suggests that the clamps containing 9 BNA bases (BNA-clamp-9) would be most effective in distinguishing the mutant from wild-type genes, and sensitivity tests using BNA-clamp-9 revealed that the clamp had the ability to detect 0.1% or lower levels of the T790M mutation among wild-type genes. Furthermore, binding structures were analyzed via Molecular Dynamics (MD) simulations, revealing that BNA-clamp-9 distorts the originally constructed BDNA structure. Additionally through umbrella sampling, binding free energies with -60 kJ/mol for the wild-type and -40 kJ/mol for the mutant gene were obtained. This BNA-clamping and real time PCR technology may offer a promising avenue to detect clinically important mutations in the future
The Epidermal Growth Factor Receptor (EGFR), a receptor tyrosine kinase, initiates various signaling pathways including cell proliferation, migration and metastasis, evasion of apoptosis and angiogenesis [1-3]. Mutations on the EGFR lead to overexpression of the receptor associated with a number of cancers such as lung cancer [4,5], anal cancers [6] and gliobalstoma multiforme [7]. As gefitinib has been known to be highly effective in treating cancers arising from EGFR mutations, it has become a common treatment option [4,5,8]. However, the T790M mutation of EGFR nullifies the effectiveness of gefitinib, which makes the T790M important to detect prior to or during administration of getfitinib [9].
The most promising and currently growing method is Polymerase Chain Reaction (PCR) clamp technology, which has been employed as a rapid, sensitive method for the detection of gene mutations [10-12]. The clamp for detecting the T790M mutation was designed with combinations of Peptide Nucleic Acid (PNA) and Locked Nucleic Acid (LNA) because of the enhanced hybridization affinity and resistance to nuclease activity of PNA and LNA [10,11].
The clamp technique revealed a strong ability to detect the mutation in the presence of a background of 100 or 1000 wildtype genes [11,13]. The detection sensitivity of the T790M mutant appears to further improve with extra treatments to the PNA-LNA clamp technology [12]. A caveat, however, is that the synthesis of PNA-LNA chimeric oligonucleotides requires multiple steps; hence, the price of the product is quite expensive compared to DNA-LNA chimeric oligonucleotides.
LNA is the 1st generation Bridged Nucleic Acids (BNA) with 2′- O,4′-C-methylene-β-D-ribofuranosyl monomers [14,15]. However, the 3rd generation bridged nucleic acid, BNANC(NMe), has been developed with 2′-O,4′-aminoethylene- β-D-ribofuranosyl monomers (Figure 1). This BNANC(NMe) has extensively been characterized and used in new promising oligonucleotides in the field of antisense, aptamer, etc [16-22]. Recently, Shivarov et al. has reported that BNANC(NMe) probes using a bead-based suspension assay have a much better ability to detect a mutation in DNA methyltransferase gene than LNA probes do [23]. This prompted us to incorporate BNANC(NMe) in clamping technology to detect the T790M mutation of EGFR.
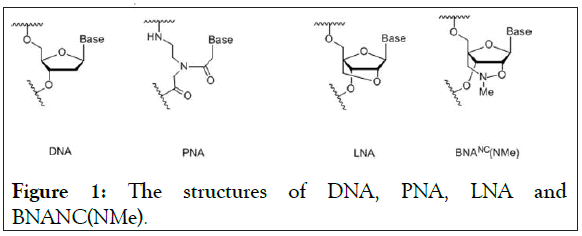
Figure 1: The structures of DNA, PNA, LNA and BNANC(NMe).
In an effort to detect human mutations, we have developed a facile, cost-effective, and rapid method to detect the single point mutation T790M using BNA clamp real-time qPCR technique. A series of BNA-clamps were designed to explore the possibility of discriminating the mutant gene in a large quantity of wildtype genes by qPCR amplifications and Tm value measurements. Additionally, we analyzed the interactions between the BNA-clamps and complementary strands through Molecular Dynamics (MD) and umbrella sampling.
Power SYBR Green PCR Master Mix and MicroAmp Fast 96- well reaction plate were purchased from Life Technologies, NY, USA. Other chemicals were purchased from Sigma (St. Louis, USA) or other companies providing high quality chemicals.
Preparation of genomic DNA and plasmids containing exon-20 of EGFR
The human genomic DNA:Male (Promega, WI, USA) was purchased for human genomic DNA (gDNA). The wild-type fragment that contains exon 20 of EGFR was amplified by PCR from the human gDNA. The primers used for amplification were 5’-CAGGAAGCCTACGTGATG-3’ as the forward primer and 5’-CTTTGTGTTCCCGGACATAG-3’ as the reverse primer. The PCR product was then inserted into the cloning vector pCR2.1-TOPO with a length of 3930 bp. The plasmid containing T790M mutant gene was synthetically generated. To that end, two long lengths of nucleotides were synthesized using an ABI 3900 DNA Synthesizer: 5’- CAGGAAGCCTACGTGATGGCCATCGTGGACAACCCCC ACGTGTGCCGCCTGCTGGGCATC TGCCTCACCTCCACCGTGC-3’ and 5’- CTTTGTGTTCCCGGACATAGTCCAGGAGGCAGCCG AAGGGCATGAGCTGCATGATGAGCTGCACGGTGGAG GTGAGGCAG-3’, where the bold, underlined character A represents the mutation site. Using the two long nucleotides as templates, PCR was performed with two primers that we used to produce the plasmid containing the wild-type gene. The PCR products were then purified from a 2% agarose gel and inserted into pCR2.1-TOPO. The inserted sequences for wild-type exon 20 and the mutant T790M of exon 20 were confirmed by DNA sequencing.
BNA-clamp real-time PCR
Real-Time qPCR assay was performed on an Applied Biosystems StepOnePlus Real-Time PCR System (Life Technologies, NY, USA). The 10 μL PCR amplification reaction mixtures contained 5 μL of 2 × Power SYBR Green PCR Mater Mix, primers. PCR primers (200 nmol/L each) were added at a final concentration of 200 nmol/L each. BNA-clamp concentration varied.
PCR cycling was as follows: A single cycle of DNA polymerase activation for a 10 min hold at 95°C followed by 55 cycles of 95°C for 15 s and 60°C for 1 min for annealing temp. The SYBR green channel (excitation at 470 nm, detection at 585 nm) was chosen to acquire the amplification data. The fluorescent reporter signal was normalized with the internal reference dye ROX, and the threshold limit was set in automatic mode unless manual adjustment was needed. All data were obtained from three independent trials.
Tm value determination
For the Tm value determination, the sequence 5’- CATCACGCAGCTC-3’ was used as the wild-type strand whereas the sequence 5’-CATCATGCAGCTC-3’ was used as the mutant strand. UV melting experiments were also carried out using a Beckman DU640 UV-Vis spectrophotometer equipped with a water circulator and a thermostable cuvette holder. The two single-stranded oligonucleotides tested were dissolved in 10 mM sodium phosphate buffer (pH 7.5) containing 100 mM NaCl, resulting in a final strand concentration of 4.0 μM. In order to avoid evaporation, we added a drop of mineral oil on top of the sample. The sample was heated up to 95° C and then slowly cooled down to 35° C. The melting profile was collected at 260 nm at a scan rate of 0.5°C/min. Tm values were obtained from the maxima of the first derivatives of the melting curves. All data were obtained and analyzed from three independent trials.
MD simulation
The 13-bp DNA molecule with the sequence 5’- GAGCTGCGTGATG-3’ was used as the template for wild-type and mutant base paring. The sequences 5’- CATCACGCAGCTC-3’ and 5’-CATCATGCAGCTC-3’ were used for wild-type and mutant strands, respectively. Standard BDNA structures were generated using the software SCFBio DNA Sequence to structure. Then, the structures were subjected to necessary modifications to incorporate BNA bases using the software Avogadro [1]. Subsequently, Merch Molecular Force Field 94 (MMFF94) incorporated in Avogadro was used to optimize the geometry. MD simulations were performed using GROMACS 5.1.1 package with the force field AMBER99 [24]. The topology file for the clamp was generated using ACPYPE [25]. Ionization states were set to the neutral pH. Solvation in a cubic box was applied to structures and the TIP3P water model was used to generate the aqueous environment [26,27]. The systems used were neutralized by adding Na+ counterions by replacing water molecules and were added with 0.10 M NaCl. The energy of the structures using the steepest decent approach was minimized with a tolerance of 1000 kJ/mol, and thus high energy interactions and steric clashes were able to be avoided. In an equilibrium run, the energy minimized system was treated for 100 ps, and 1000 ps MD simulations were carried out with a time-step of 2 fs at the NPT canonical ensemble and the periodic boundary conditions were used in all three dimensions. The MD simulations were run in a temperature bath at 300 K with a constant pressure of 1 bar using the V-rescale method for temperature and the Parrinello-Rahman method for pressure [28,29]. For long-range electrostatics, the Particle Mesh Ewald (PME) method was employed [30,31], and periodic boundary conditions were applied in all directions. A 1.4 Å cutoff for van der Waals interactions and for Coulomb interaction with updates every 10 steps was used, and the LINCS algorithm for covalent bond constrains were used [32].
GROMACS 5.1.1 was used for calculating Root Mean Square Deviation (RMSD) values and employed for subsequent analysis. For the umbrella sampling [33,34], water molecules, Na+, and Cl-ions were present in a 9.0 nm × 9.0 nm × 11.0 nm box for simulations. The direction option was used for pulling with the z-component set to a value of 1, applying a harmonic force with a force constant of 1,000 kJ/(mol•nm2 ). Twenty to twenty four windows were chosen from the pulling simulation with the Center-Of-Mass (COM) spacings of 0.2 nm. A 1000 ps simulation was executed for each window. If the resulting histogram graph revealed deficiencies in sampling, more windows were chosen to fill the gaps. The pulling was achieved by applying a harmonic force with a force constant of 1,000 kJ/ (mol•nm2 ), and the amount of sampling in every window was 500 ns. Free energy was calculated for each configuration using (WHAM) [35].
Detection limit of real-time PCR using SYBR green
Two plasmids were prepared with wild-type exon-20 (pCR-WTexon20) and the mutant T790M containing exon-20 of EGFR (pCR-T790M). The detection limit of the real-time PCR with these plasmids were determined, the range of the copy numbers used was between 1 × 10⁹ copies/reaction and 1 × 101 copies/ reaction, where the volume of the reaction (i.e. one PCR reaction) was 10 μL (Figure 2). The results for the wild-type gene showed an excellent linear correlation between the cycle number and the copy number from 1 × 10⁹ copies to 1 × 10³ copies (Figure 2A) as did the results for the mutant gene (S1 Figure). As shown in Figure 2B, however, the data deviates from the line of best fit below 1 × 10³ copies/reaction. Thus, no linear correlation exists if the copy number is lower than 1 × 10³ copies. In addition, the detection limit of the real-time PCR with human gDNA was determined. Because of the large molecular weight of gDNA, the test for the linear correlation was restricted to concentrations of 1 × 10⁴ copies/reaction and below. A good linear correlation was observed down to 1 × 10² copies (S2 Figure).
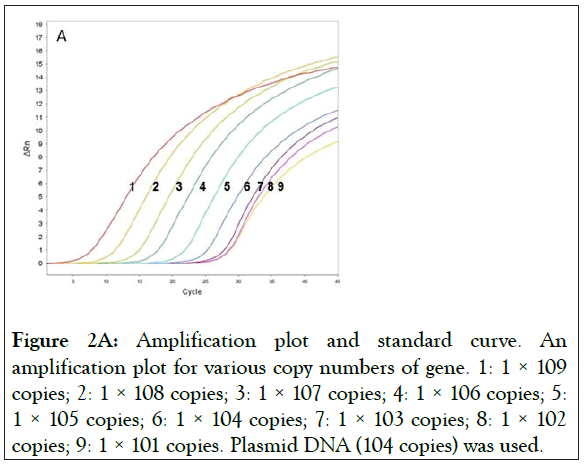
Figure 2A: Amplification plot and standard curve. An amplification plot for various copy numbers of gene. 1: 1 × 10⁹ copies; 2: 1 × 10⁸ copies; 3: 1 × 10⁷ copies; 4: 1 × 10⁶ copies; 5: 1 × 10⁵ copies; 6: 1 × 10⁴ copies; 7: 1 × 10³ copies; 8: 1 × 10² copies; 9: 1 × 101 copies. Plasmid DNA (104 copies) was used.
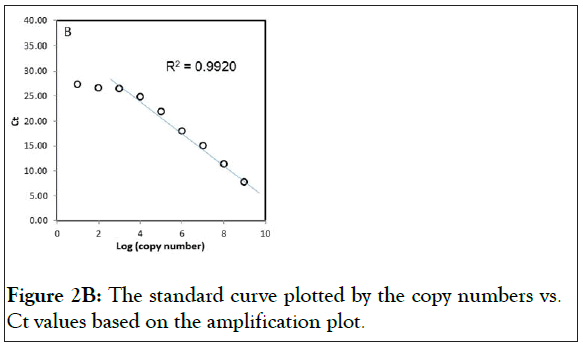
Figure 2B: The standard curve plotted by the copy numbers vs. Ct values based on the amplification plot.
Designing a BNA-clamp and effect of its BNAclamp
In general, modified nucleic acid clamps are designed with lengths of 13 to 18-mer. For our experiements, the shortest length, 13-mer, was chosen. The BNA-clamp containing 9 BNANC(NMe) bases, referred to as BNA-clamp-9, was designed to obtain an optimal Tm value between 65°C and 75 ° C with the mutation site located around the middle of the clamp.
With BNA-clamp-9, we tested whether the BNA clamp would effectively suppress PCR amplification. We used various concentrations of the clamp with the fixed concentrations of template (104 copies of wild-type/reaction) and primers (200 nM/reaction). The result showed that there was a complete suppression at a clamp concentration of 2.24 μM and that lowering the concentration of the clamp increased the amount of the amplicon (Figure 3A).
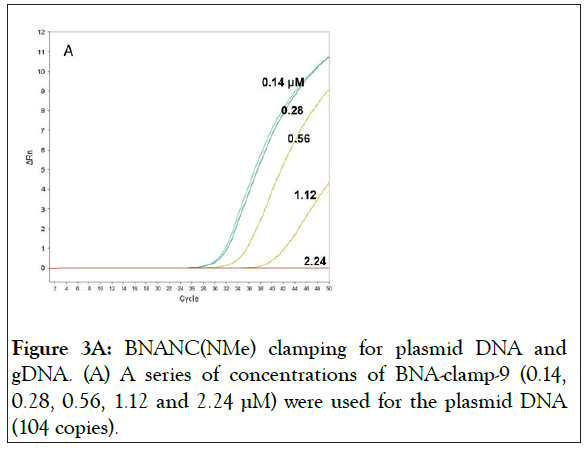
Figure 3A: BNANC(NMe) clamping for plasmid DNA and gDNA. (A) A series of concentrations of BNA-clamp-9 (0.14, 0.28, 0.56, 1.12 and 2.24 μM) were used for the plasmid DNA (104 copies).
We also tested the suppression of gDNA under the same condition. The results showed almost similar amplification curves to those of wild-type plasmid DNA (Figure 3B), suggesting that there is no significant difference in the use for testing the clamping between wild-type plasmid DNA and gDNA.
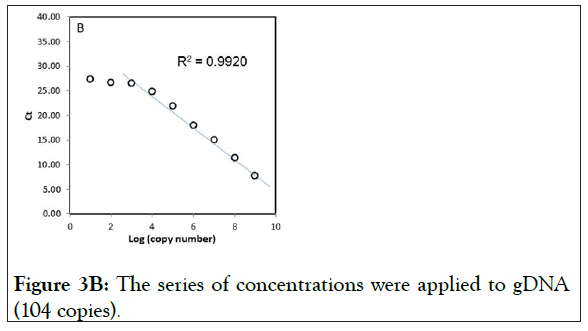
Figure 3B: The series of concentrations were applied to gDNA (104 copies).
Examination of a series of BNA clamps
A series of BNA clamps were designed to test the possibility of their ability to discriminate the mutant in the background of wild-type genes (Table 1). As we tested the effect of BNAclamp- 9, we used various concentrations of the clamps with the fixed concentrations of the template and primers used for testing BNA-clamp-9. To understand the effect of the number of BNA nucleotides on amplification suppression, BNA clamps with different numbers of nucleotides were designed, for example, BNA-clamp-5 and -7 contained 5 and 7 BNA nucleotides. Under these clamps, no clamping effects were indicated (data not shown). In contrast, when we used BNAclamp- 11 and -13, we noted strong ability to suppress the wildtype gene as well as mutant gene. Thus, the ability to discriminate the mutant gene out of wild-type genes by BNAclamp- 11 and -13 substantially decreased.
| BNA-clamping oligonucleotide sequences | Tm | |||
|---|---|---|---|---|
| WT | T790M | ΔTm | ||
| BNA-clamp-5 | 5’-GAGCTGCGTGATG-Ph-3’ | 70.5 ± 0.3 | 64.7 ± 0.2 | 5.8 |
| BNA-clamp-7 | 5’-GAGCTGCGTGATG-Ph-3’ | 75.1 ± 0.2 | 68.6 ± 0.4 | 6.5 |
| BNA-clamp-9 | 5’-GAGCTGCGTGATG-Ph-3’ | 82.1 ± 0.3 | 72.1 ± 0.3 | 10 |
| BNA-clamp-11 | 5’-GAGCTGCGTGATG-Ph-3’ | 86.3 ± 0.5 | 80.2 ± 0.4 | 6.1 |
| BNA-clamp-13 | 5’-GAGCTGCGTGATG-Ph-3’ | N.D. | N.D. | - |
| DNA-clamp | 5’-GAGCTGCGTGATG-Ph-3’ | 53.1 ± 0.2 | 42.8 ± 0.3 | 10.3 |
| LNA-clamp-5 | 5’-GAGCTGCGTGATG-Ph-3’ | 69.2 ± 0.2 | 63.3 ± 0.2 | 5.9 |
| LNA-clamp-7 | 5’-GAGCTGCGTGATG-Ph-3’ | 75.3 ± 0.3 | 68.4 ± 0.2 | 6.9 |
| LNA-clamp-9 | 5’-GAGCTGCGTGATG-Ph-3’ | 81.1 ± 0.3 | 73.4 ± 0.4 | 7.7 |
| LNA-clamp-11 | 5’-GAGCTGCGTGATG-Ph-3’ | 84.3 ± 0.5 | 78.3 ± 0.6 | 6 |
| LNA-clamp-13 | 5’-GAGCTGCGTGATG-Ph-3’ | N.D. | N.D. | - |
Note: Bold and underlined character indicates the following nucleotide is a BNA or LNA nucleotide; Ph denotes phosphate, which was attached to prevent the elongation from the clamps. N.D. represents that the Tm value cannot be determined because the temperature is out of range.
Table 1: The sequences of the BNA-clamping oligonucleotides tested and Tm values obtained by calculations and experiments.
Tm value determination
Tm assay was attempted to determine the Tm values of the series of BNA clamps using a UV-Vis spectrometer at 260 nm in the medium-salt buffer. In the case of BNA-clamp-9, the difference in Tm values between the wild-type and mutant genes was 10 °C, which is the largest difference among other clamps listed in Table 1. It should be mentioned that from the determination of Tm value difference of PNA-DNA hybrid probes for a single mismatch, large Tm differences between matched and mismatched hybrids offered better PNA probes for point mutations [36,37]. This observation strongly supports the notion that the larger Tm difference is able to discriminate a single mismatch among matches. It should also be noted that the PNA-mediated clamp used for experimentation had a Tm difference of 9°C [38], which is very similar to that of our BNA mediated clamp. Thus, we envision that BNA-clamp-9 could sensitively discriminate single base mismatch.
Comparison of BNA with other oligonucleotides– DNA and LNA
To compare the BNA clamping abilities with other oligonucleotides, we tested DNA and LNA with the same sequence (Table 1). Tm value between DNA-clamp and the wild type template was determined to be 53.1 ± 0.2 C, and the value between DNA-clamp and the mutant template was 42.8 ±0.3° As expected, the Tm values were much lower than those of other BNA-clamps, thus supporting that BNA binding to DNA is tighter than DNA binding to DNA. Also, note that the difference in Tm between wild-type and mutant of the DNAclamp is similar to that of BNA-clamp-9, and thus one might argue that the DNA-clamp could be used for the EGFR T790M detection. However, the DNA-clamp is susceptible to hydrolysis by Taq DNA polymerase exonuclease activity. This was proven by real-time PCR analysis with and without the DNA-clamp, in which both cases showed almost identical amplification plots (data not shown). In addition to the DNA-clamp, LNAcontaining clamps were synthesized and tested. The designs of the LNA and BNA clamps were identical for comparison purposes. The trend in Tm difference for the LNA-clamps was very similar to that of BNA-clamps, and yet the largest Tm difference by LNA-clamp-9 was 7.7 ° C, which is significantly lower than BNA-clamp-9.
It has been known that BNA has a great ability to hybridize with DNA [18]. As listed in Table 1, the Tm value determination generally shows that the Tm values of the BNA-clamps for wildtype and mutant templates are slightly higher than those of LNA-clamps. Although this observation is in good agreement with the previous studies [18], one might wonder why BNA clamps exhibit higher Tm values than LNA-clamps. An explanation could be the difference in structure, where the torsion angle (δ) and the maximum torsion angle out of plane pucker (νmax) are 79.0 ° and 48.6 ° for BNANC(NMe) and 66.2° and 56.6° for LNA. This slight structural difference may significantly affect the hybridization between BNANC(NMe) and LNA.
Sensitivity of BNA-clamp real-time PCR for detecting EGFR T790M mutation
In an attempt to determine the sensitivity of BNA-clamp-9, a fixed concentration of wild-type DNA (0.56 μM) was used with the different proportions of mutant DNAs (100%, 10%, 1%, 0.1%, 0.01%, and 0%, respectively) by real-time qPCR. Figure 4 shows the results of the amplification plot of sensitivity tests, where the amplification curves of 100%, 10% and 1% were clearly separated from the amplification curve of 0% (the 0% amplification curve means 100% wild-type). The Ct values of each amplification curve are listed in Table 2. The difference in Ct value between 1% and 0% is 0.94, and the difference between 0.1% and 0% is 0.86, which is still discernible. In the case of 0.01%, the difference is not robustly discernible. Thus, it suffices to say that BNA-clamp-9 can be used for the discrimination of 0.1% of the mutant EGFR T790M.
| Ratio of M/(M+WT) | Average Ct value 100% |
|---|---|
| 100% | 28.67 ± 0.07 |
| 10% | 32.38 ± 0.06 |
| 1% | 34.68 ± 0.09 |
| 0.10% | 34.76 ± 0.10 |
| 0.01% | 34.96 ± 0.15 |
| 0% | 35.62 ± 0.11 |
Table 2: The sequences of the BNA-clamping oligonucleotides tested and Tm values obtained by calculations and experiments.
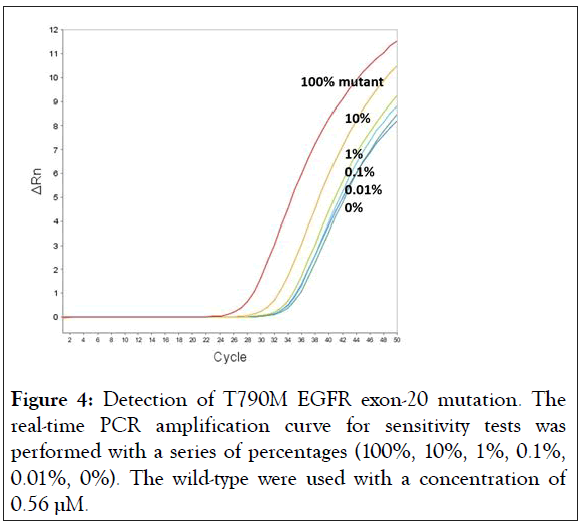
Figure 4: Detection of T790M EGFR exon-20 mutation. The real-time PCR amplification curve for sensitivity tests was performed with a series of percentages (100%, 10%, 1%, 0.1%, 0.01%, 0%). The wild-type were used with a concentration of 0.56 μM.
Since the detection of the EGFR T790M mutation has become increasingly important, several methods have been developed. A common, straightforward method is direct sequencing method using dideoxy sequencing, but this method involves a relatively complicated procedure and provides lower sensitivity compared to others. The detection limit of mutant signal using the direct sequencing method has been shown to be 25%-30% [39]. As the next straightforward and higher sensitivity method, pyrosequencing can be used for detecting genetic mutations [40]. The procedure to run samples, however, is still complicated, and the critical limitation is that the reading length of nucleotides is relatively short (only up to 40-50 bp). Aside from sequencing methods, different strategies include mutantenriched PCR [41,42], Amplification Refractory Mutation System (ARMS) [43,44], Peptide Nucleic Acid (PNA)-clamping PCR [11,12,38,45,46], and combining scorpion ARMS with genome amplification [9], combining co-amplification at lower denaturation temperature-PCR with TaqMan method [47], molecular beacon-based qPCR [48], the beads, emulsion, amplification and magnetics (BEAMing) assay [49] and mass spectrometry [50]. The detection limits from each of these methods have improved ranging from 1% to 0.01%. These limits lie in our detection limit using BNA-clamping technique. Considering our facile, rapid method, BNA-clamping technique is quite useful for clinical use because the aforementioned methods feature their own disadvantages in practical situations; for example, special instruments, expensive reagents, or complicated procedures are required. Thus, the BNA-clamping real-time PCR is the most suitable for facile, rapid, sensitive, and cost-effective detection of the EGFR T790M mutation.
MD simulations
MD simulations were performed to probe the conformational variations of the binding within a hydrated environment, and the Root-Mean-Square Deviation (RMSD) of the atomic positions was then analyzed. The 3D structure of BNA-clamp-9 was constructed by the software Avogadro after the standard BDNA type was made. The clamp structure then underwent energy minimization (see Materials and Methods). The RMSD for the backbone of the complex between the wild-type template and BNA-clamp-9 was achieved as a function of the 1 ns simulation time.
As shown in Figure 5A, the RMSD values rose to about 0.60 Å and decreased slightly and became stable after 0.8 ns. In addition, the RMSD for the backbone of the complex of the mutant and BNA-clamp-9 was obtained under the same simulation conditions as the case for the wild-type template (Figure 5B). The obtained RMSD value varied around 0.35 Å and became stable after 0.1 ns. Previous RMSD analyses for LNA showed that the range of RMSD was between 1.0 Å and 3.0 Å [51,52], whose values are higher than the case for BNAclamp- 9. An explanation would be that the BNA that has rather bulky structure at the bridge would offer the rigidity of the structural flexibility. In order to view the final structures after MD simulations, snapshots of the duplexes for BNA-clamp-9 and wild-type gene template (13-mer) and for BNA-clamp-9 and mutant gene template were taken as shown in Figure 6.
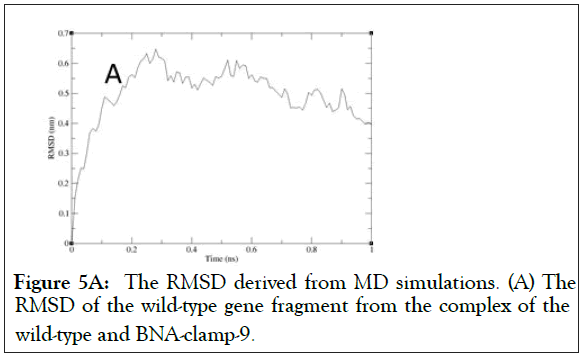
Figure 5A: The RMSD derived from MD simulations. (A) The RMSD of the wild-type gene fragment from the complex of the wild-type and BNA-clamp-9.c
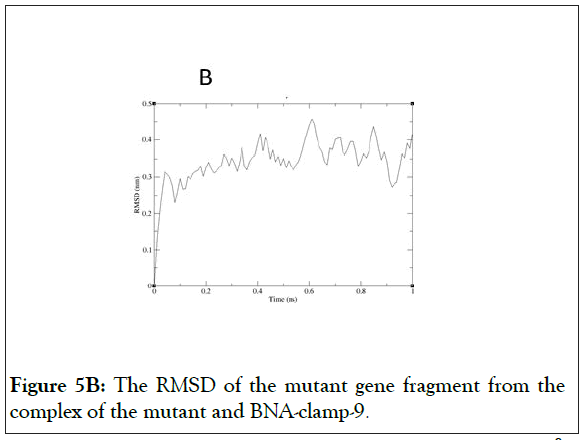
Figure 5B: The RMSD of the mutant gene fragment from the complex of the mutant and BNA-clamp-9.
We have found that the duplexes for the wild-type and mutant genes adopt in general A-type duplex geometries and that the duplex for the wild-type gene exhibits a slight unwinding of the helix, resulting in relatively shallow grooves compared to those of the mutant gene. These structural patterns are similar to the previously reported observations of the duplex of LNA: DNA after MD simulations [52]. As the X-ray structure of BNANC(NMe) revealed a C3’-endo conformation sugar pucker [53], we could envision that the BNA-containing clamp would have C3’-endo sugar pucker. The MD simulations have shown that the BNAs mainly retain C3’-endo sugar puckering whereas the DNAs undergo a change in puckering from C2’-endo to C3’- endo puckering effected by the BNA clamp (Figures 6A and 6B). Umbrella sampling simulations were used to gain the binding energy information on the duplexes of wild-type DNA:BNAclamp- 9 and mutant DNA: BNA-clamp-9. The COM distance between the DNA templates and BNA-clamp-9 was used as the reaction coordinate, with 0.2 nm interval windows summing to 22 windows for wild-type and 20 windows for mutant. The initial structure for umbrella sampling simulations for each window was generated by a pulling simulation, where the distance between the DNAs and BNA-clamp-9 increased gradually with a rate of 1 × 10⁻² nm•ps-1. In every umbrella sampling simulation, a harmonic biasing potential with a force constant of 1000 kcal mol-1 nm-2 was employed, and the sampling duration in every window was 500 ps to increase accuracy. Initially, the convergence of simulations was tested by the overlap of histograms and analysis of the free energy curve, and additional windows were appended to make sure that the histograms completely overlapped throughout the reaction coordinate (S3 Figure) and that the plot of Potential of Mean Force (PMF) for free energies did not show any gaps (Figure 7). The PMF of the wild-type gene fragment with BNA-clamp-9 and the mutant gene fragment with BNA-clamp-9 shows a minimum at 0.15 and -0.28 nm, respectively (Figure 7). The distance between the two fragments and BNA-clamp-9 were near zero, which is corresponding to the structure obtained previously using MMFF94 force field. By the evaluation of free energy diagram, the binding energies for wild-type and mutant are -60 kJ/mol and -40 kJ/mol, respectively. This indicates that the binding interaction between the wild-type DNA and BNAclamp- 9 was stronger than that for the mutant DNA, which is in good agreement with experimental data. Furthermore, this observation suggests that the umbrella sampling simulations could be employed to test the difference in the binding free energy before performing experiments.
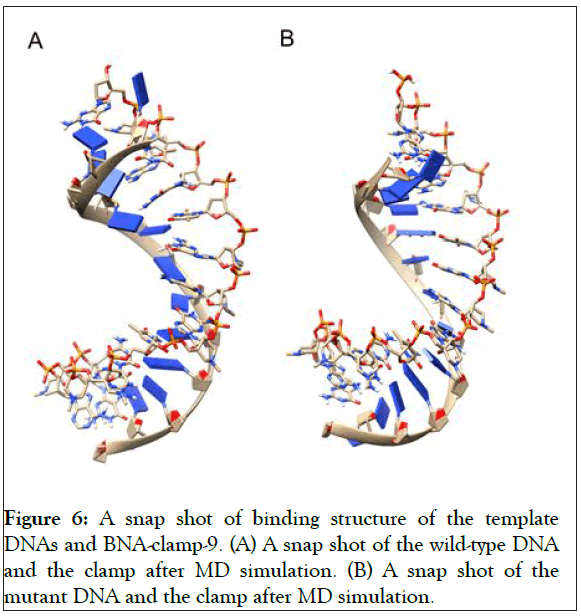
Figure 6: A snap shot of binding structure of the template DNAs and BNA-clamp-9. (A) A snap shot of the wild-type DNA and the clamp after MD simulation. (B) A snap shot of the mutant DNA and the clamp after MD simulation.
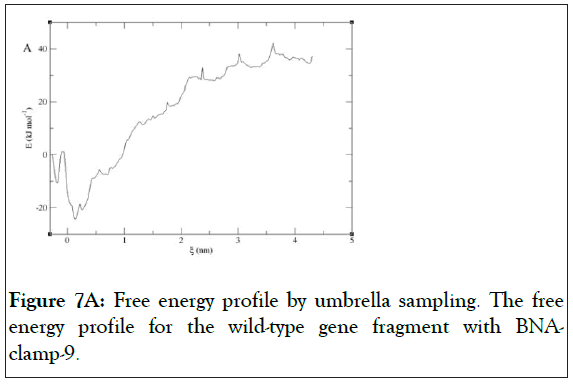
Figure 7A: Free energy profile by umbrella sampling. The free energy profile for the wild-type gene fragment with BNAclamp- 9.
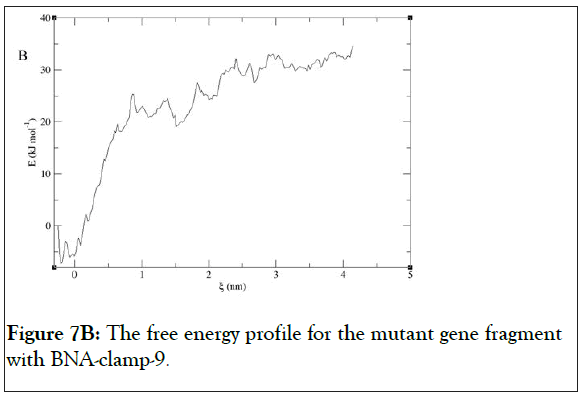
Figure 7B: The free energy profile for the mutant gene fragment with BNA-clamp-9.
A new version of the clamping technique, BNA-clamping is uniquely improved in sensitivity of mutation detection and versatility, involving a facile real-time PCR method and targeted clamp design. For the first time, the updated sugar-ring modified nucleotide (i.e. BNANC(NMe)) was applied in clamping technique to detect the mutant T790M EGFR. For this mutation site, BNA-clamp-9 was found to be the most effective in distinguishing low copy numbers of mutant sample within large wild-type pools through Tm value determination and sensitivity experiments, and the effectiveness was also confirmed through analyzing conformational changes and free energy between wild-type and mutant models through MD simulations. Unlike other detection alternatives that involve complicated procedures and demand expensive costs, this BNA-mediated real-time PCR clamping assay is facile, rapid and sensitive and may be practical for clinical early mutation detection. In addition, umbrella sampling provides a universal, computational method for effective clamp designing targeted at specific mutation sites, decreasing overall experimental cost, and paving way for effective early mutation detection and adaptability.
This research was in part supported by the National Institute of General Medical Sciences of the National Institutes of Health under award number P20GM103447 and by the Faculty Research Committee from Northeastern State University. We would like to express our gratitude to Edward S. Kim for intellectual discussion and helping computational analysis throughout this project.
Citation: Dinkel A, Hoffmeister RA, Huckelby A, Castro AS, Castro MM, Kim SK (2021) Sensitive Detection of Epidermal Growth Factor Receptor T790M using BNA-Clamp Real-Time PCR. J Clin Trials. 11:460.
Received: 10-Mar-2021 Accepted: 24-Mar-2021 Published: 31-Mar-2021 , DOI: 10.35248/2167-0870.21.11.460
Copyright: © 2021 Dinkel A, et al. This is an open access article distributed under the terms of the Creative Commons Attribution License, which permits unrestricted use, distribution, and reproduction in any medium, provided the original author and source are credited.