Journal of Alcoholism & Drug Dependence
Open Access
ISSN: 2329-6488
ISSN: 2329-6488
Research Article - (2021)Volume 9, Issue 4
Aims: Our study investigated ADH3 role in renal pathological changes induced by chronic alcohol consumption (CAC).
Methods: Nine-week-old malewild-type (WT) and ADH3-deficient (Adh3−/−) mice were administered 10% ethanol solution for 1 month. Renal histological and ultrastructural analyses were performed by light microscopy on periodic acid–Schiff (PAS) staining and electron microscopy. The tissue ADH3 localization was examined by immunohistochemistry using a specific antibody against mouse ADH3. Urine and serum biochemical analyses were performed.
Results: The PAS-stained microvilli in the proximal tubules were significantly low in the WT mice after CAC (WT (E)) as compared to the Adh3−/− mice (Adh3−/− (E)). The electron microscopy revealed vacuolization, nuclear apoptosis, mitochondrial decay, loss of microvilli in the proximal tubulesin the WT (E) mice, foot process effacement and epithelial cells apoptosis in the glomeruli. In the Adh3−/− (E) mice, loss of PAS staining in the proximal tubules and significant ultrastructure changes were not observed, except for mitochondrial decay in the proximal tubules. ADH3 was localized in proximal tubules, consistent with the pathomorphological changes characteristic of the site in the WT (E) mice. CAC increased urinary albumin and total protein levels CAC in the WT mice, but not in the Adh3−/− mice. These biochemical data demonstrate increased glomerular permeability in the WT (E) mice, foot process effacement and apoptosis of epithelial cells in the glomeruli.
Conclusions: ADH3 causes renal proximal tubules pathological changes by metabolizing alcohol in this site and increased glomerular permeability during CAC. Thus, ADH3 exacerbates alcoholic kidney disorders.
Alcohol; Alcohol dehydrogenase; Class III alcohol dehydrogenase; Kidney; Renal pathological changes
Alcohol dehydrogenases (ADHs; alcohol: NAD + oxidoreductase, EC 1.1.1.1.) of mammals are classified into six class isozymes (class I–VI), among which class I ADH (ADH1) is well known as a key enzyme for alcohol metabolism. Alcohol metabolism through ADH causes alcoholic liver disease (ALD) by increasing the NADH/NAD ratio [1-3] and acetaldehyde level [2-5]. The microsomal ethanol-oxidizing system (MEOS), which includes cytochrome P450 2E1 as the main component, also has been reported to produce reactive oxygen species (ROS) by participating in alcohol metabolism as a non-ADH pathway during chronic alcohol consumption (CAC) and cause ALD [6,7]. The kidney also contains ADH [8] and MEOS [9], and has been affected by CAC, which induces pathological abnormalities [10,11]. Periodic acid–Schiff (PAS) staining showed the expansion of the mesangial matrix of the glomeruli, intense IgA deposition and foot process effacement with occlusion of proximal convoluted tubules in the alcoholic kidney [9,12]. Furthermore, alcohol induced changes in several biochemical parameters of the kidney in serum and urine, together with renal morphological changes. Patients with alcohol-use disorders are known to be at risk of deficits of phosphate/potassium/ magnesium/calcium/ sodium caused by tubular dysfunction in the kidney due to chronic alcohol exposure [13], not only by nutritional deficiencies or decreased gastrointestinal absorption. The renal abnormalities might be due toalcohol metabolism producing excessive amounts of metabolites such as acetaldehyde, NADH or ROS [9,10], similar to the progression of ALD.
Several papers reported that the ROS production was higher in the kidney than in the liver [14,15], which resulted in renal pathological changes [16] by triggering and drivinginflammation during the pathological process [10,17]. Moreover, the ROS did not affect the glomeruli but affected the proximal tubular epithelial cells; for example, vacuolization, accumulation of intraluminal materials, dysplastic tubular outer membranes and reduced PAS glycoprotein staining of the microvilli were displayed [17]. The ROS production in the kidney during CAC may be due to the participation of MEOS in alcohol metabolism [17,18].
On the other hand, the role of ADH in alcoholic kidney diseases has been reported in a few studies [8,16,19], although ADH is the key enzyme of alcohol metabolism and produces toxic metabolites of acetaldehyde and NADH at pathological levels [3,20]. ADH has been detected in the kidney at a secondary high level, as compared with that in the liver [4,21,22]. Recent reports suggested that blood ethanol upregulated the protein expression or activity of ADH in the kidney [16,19]. However, ADH in the kidney has not been investigated yet at the ADH isozyme level.
We recently reported that high Km class III ADH (ADH3) participated in alcohol metabolism dose dependently [23] and contributed to the enhancement of the metabolism during CAC by increasing its enzyme protein level in the liver [24,25]. Moreover, we suggested that ADH3 contributes to the development of liver steatosis by CAC [26]. The kidney contains not only ADH1 but also ADH3 at a level secondary to that in the liver [4]. These studies suggest that ADH3 might also play a role in alcohol metabolism and contribute to the pathological changes in the kidney by CAC. Therefore, we examined the role of ADH3 in renal disorders induced by CAC by using mice of different ADH genotypes, namely wild-type (WT) and ADH3-deficient (Adh3−/−) mice.
Animals
Mice deficient in ADH3 (Adh3−/−), which is a homozygous null mutant of the ADH3 gene, was obtained from the Burnham Institute in the USA in 1999 [2] and backcrossed with an original deficient mouse with a background strain of C57BL/6N mouse (WT mouse, Sankyo Laboratory, Co., Ltd., Tokyo, Japan) for up to 13 generations. The congenic strains of Adh3−/− mice have been maintained in Nippon Medical School (Tokyo, Japan) since 2013. The mice with two different ADH genotypes (WT and Adh3−/−) were weaned at 4 weeks old and kept in cages with 4–6 mice/cage at 24°C ± 2°C with a 14-hour light/10-hour dark cycle starting at 7:00 am. These mice were fed with a standard mouse diet containing 12.5% fat calories (MF pellets, Oriental Yeast Co., Ltd., Tokyo, Japan) ad libitum in a specific pathogen-free facility [27]. The five mice were used for each experiment (n = 5). All the animal experiments were performed in compliance with the ARRIVE guidelines and the protocol reviewed by the Institutional Committee of Laboratory Animals of Nippon Medical School (Approval No. 28-001) in accordance with the National Institutes of Health guide for the Care and Use of Laboratory Animals (NIH publication No. 8023, revised 1978). This researched mainly performed in Nippon Medical School.
CAC Experiment
The CAC experiments were performed by giving 9-week-old male mice a 10% (w/v) ethanol/water solution ad libitum as a drink instead of water for 1 month in accordance with the method used by Kishimoto et al.[28]. Prior to starting the CAC experiment, the ethanol solution concentration was stepwise increased by 2% per day to reach 10% over the week. The mice in the CAC group (E group) were designated as the WT (E) and Adh3−/− (E) mice, and those in the control group (C group), which were given just water, were designated as the WT (C) and the Adh3−/− (C) mice.
Tissue preparation
After 1 month of ethanol consumption, the WT and Adh3−/− mice were anaesthetized, followed by cervical dislocation, as previously described [27]. For light microscopy, the kidney was fixed in a 10% formalin neutral buffer solution (Wako, Osaka, Japan). Within 2 weeks, fixed kidney tissue was put into the vacuum rotary (Sakura Finetek Japan Co., Ltd., Tokyo, Japan) to dehydrate and embedded in paraffin. The paraffin- embedded tissues were cut at a 2-μm thickness. These sections were stained with PAS for morphological evaluation in accordance with the manufacturer’s protocol (Muto Pure Chemicals Co. Ltd., Tokyo, Japan). Digital micrographs were taken using a light microscope (BZ-9000 All-in-One Microscope, Keyence Corporation, Osaka, Japan).
For electron microscopy, 1-mm tissue sections were fixed in 2.5% glutaraldehyde (TAAB Laboratories Equipment Ltd., Berks, UK) diluted with 0.1-M phosphate buffer solution (Muto Pure Chemicals Co. Ltd.). A small piece of kidney tissue was post-fixed in 1% osmium tetroxide (Heraeus South Africa [Pty] Ltd., Port Elizabeth, South Africa). The tissues were dehydrated in a graded series of ethanol and embedded in OkenEpok 812 (Okenshoji Co., Ltd., Tokyo, Japan). Ultrathin sections (70 nm) were cut using a Leica Ultracut R ultramicrotome (Leica, Wetzlar, Germany) with a diamond knife, stained with uranyl acetate and lead citrate and examined under an electron microscope (JEM-1400 Plus, JEOL Ltd., Tokyo, Japan).
Measurement of the area of brush border relative to the proximal tubules
Alcohol is known to induce the apoptosis on the brush border in the proximal tubules. Therefore, the present study measured the area of brush border in the proximal tubules with or without alcohol. The brush border intensity in the PAS staining was measured using Adobe Photoshop version-21,0,1 20191106,r,47 2019/11/06: 3152b481f18 x64 (Adobe Systems, Inc., San Jose, CA, USA). After converting the entire area of the proximal tubule and brush border (membrane) area to pixels, a graph was created with the area of the proximal tubules as the denominator and the area of the brush border as the numerator, that is, as the ratio of brush border to the proximal tubule.
Immunohistochemistry of ADH3
The localization of ADH3 in the kidney tissue was examined with immunohistochemistry. The paraffin sections of the WT (C) and WT (E) mice were incubated with xylene for deparaffinization. Subsequently, the paraffin sections were incubated with 100% ethanol and 95% ethanol for dehydration. For antigen retrieval, the slides were placed in a staining jar containing 50 ml of 10-mM sodium citrate buffer, pH 6 and boiled in an autoclave apparatus at 120°C for 20 min. The slides were washed three times with 300- ml phosphate-buffered saline (PBS) and incubated in a hydrogen peroxide blocking solution containing 3% H2O2 with methanol at room temperature for 20 min to remove any peroxidase activity. After a further wash with PBS, the slides were incubated overnight at 4°C with a rabbit polyclonal anti-class III ADH antibody (ADH3; dilution, 1:750). The primary anti-ADH3 antibody was as described in a previous study [29]. The slides were washed three times with PBS and incubated with horseradish peroxidase-labelled secondary anti-rabbit IgG polyclonal antibody containing Histofine Simple Stain MAX-PO (R) kit (Nichirei Biosciences Inc., Tokyo, Japan; 4 μg/ml) for 30 min at room temperature. The slides were washed three times with PBS and incubated with DAB solution containing Histofine Simple Stain MAX-PO (R) kit (415171, Nichirei Biosciences Inc.) for each slide from 1 to 3 min at room temperature. The slides were washed with pure water and incubated with Mayer’s haematoxylin (Muto Pure Chemicals Co., Ltd.) for nuclear staining and viewed under a BZ-9000 All-in-One Microscope (Keyence Corporation).
Measurement of biochemical parameters in serum and urine
After CAC experiment, blood sample was collected and centrifuged at 3,000 g for 15 minutes to obtain serum. Twenty-four- hour urine sample was collected using a mouse metabolic gauge (Shinano manufacturing Co. Ltd., Tokyo, Japan) 1 month after the start of ethanol consumption. Urine was collected twice from 10:00 am to 6:00 pm and from 6:00 pm to 12:00 noon. The serum urea nitrogen (BUN) concentration was measured with a BUN Colorimetric Detection Kit (Arbor Assays, MI, USA). The serum creatinine concentration was measured using a Lab Assay Creatinine kit (Wako Pure Chemical Industries, Ltd., Tokyo, Japan). The urinary albumin concentration was measured with a LBIS Mouse Albumin ELISA Kit (AKRAL-121, FUJIFILM Wako Shibayagi, Gunma, Japan). The urinary total protein concentration was measured with a DC Protein assay kit (Bio-Rad Laboratories, Inc., CA, USA). Each absorbance was determined using Spectra Max TM i3x (Molecular Devices Japan, Tokyo, Japan) according to the manufacture’s protocols. Furthermore, urinary osmotic pressure and electrolyte concentrations (K and Cl) were analysed by SRL, Inc. (Tokyo, Japan).
Statistical analysis
All values are presented as mean ± standard deviation. To compare the differences between the control and ethanol groups, using the measurements made with the tissue samples from the WT and Adh3−/− mice, one-way analysis of variance was performed with the Tukey honest significant difference as a post hoc test. The statistically significant difference was indicated in each figure. Analyses were performed using the JMP version 14 software (SAS Institute Inc., NY, USA).
ADH3 localization in the kidneys of WT mice
Localization of ADH3 in the kidneys was observed in the WT mice (Figure 1). ADH3 localized in the proximal and distal tubules. No significant difference was observed in the localization of ADH3 between the WT (C) and WT (E) mice (Figure 1a and 1b). On the other hand, ADH1 was observed in the distal tubules, but not in the proximal tubules and nuclear, as shown in the supplementary Figure 1.
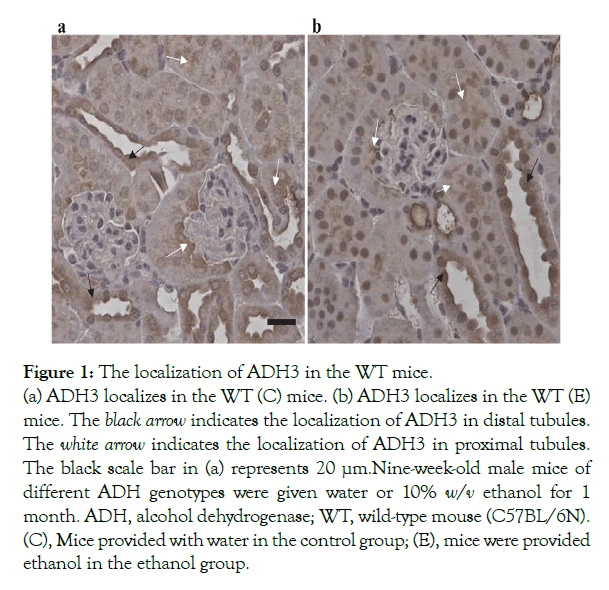
Figure 1: The localization of ADH3 in the WT mice.
(a) ADH3 localizes in the WT (C) mice. (b) ADH3 localizes in the WT (E) mice. The black arrow indicates the localization of ADH3 in distal tubules. The white arrow indicates the localization of ADH3 in proximal tubules.The black scale bar in (a) represents 20 µm. Nine-week-old male mice of different ADH genotypes were given water or 10% w/v ethanol for 1 month. ADH, alcohol dehydrogenase; WT, wild-type mouse (C57BL/6N). (C), Mice provided with water in the control group; (E), mice were provided ethanol in the ethanol group.
Microscopic observation
The PAS staining for each group is shown in Figure 2. In the WT (E) mice, accumulation of intralumenal material and loss of PAS staining of the microvilli in proximal tubules (Figure 2b) were observed, without remarkable pathological changes in the WT (C) and Adh3−/− (C) mice(Figure 2a and 2c). The PAS staining of the microvilli in the proximal tubules was significantly lower in the WT (E) mice than in the WT (C) mice, as shown by the rate of brush border area/proximal tubules area (Figure 2e). On the other hand, the Adh3−/− (E) mice showed smaller pathological changes than the WT (E) mice, except that the proximal tubular epithelium cells were expanded and the cytoplasm around nuclei had disappeared (Figure 2d). The PAS staining of the microvilli in the proximal tubules also showed no significant difference between (C) and (E) in the Adh3−/− mice, which differs from that in the WT mice (Figure 2e).
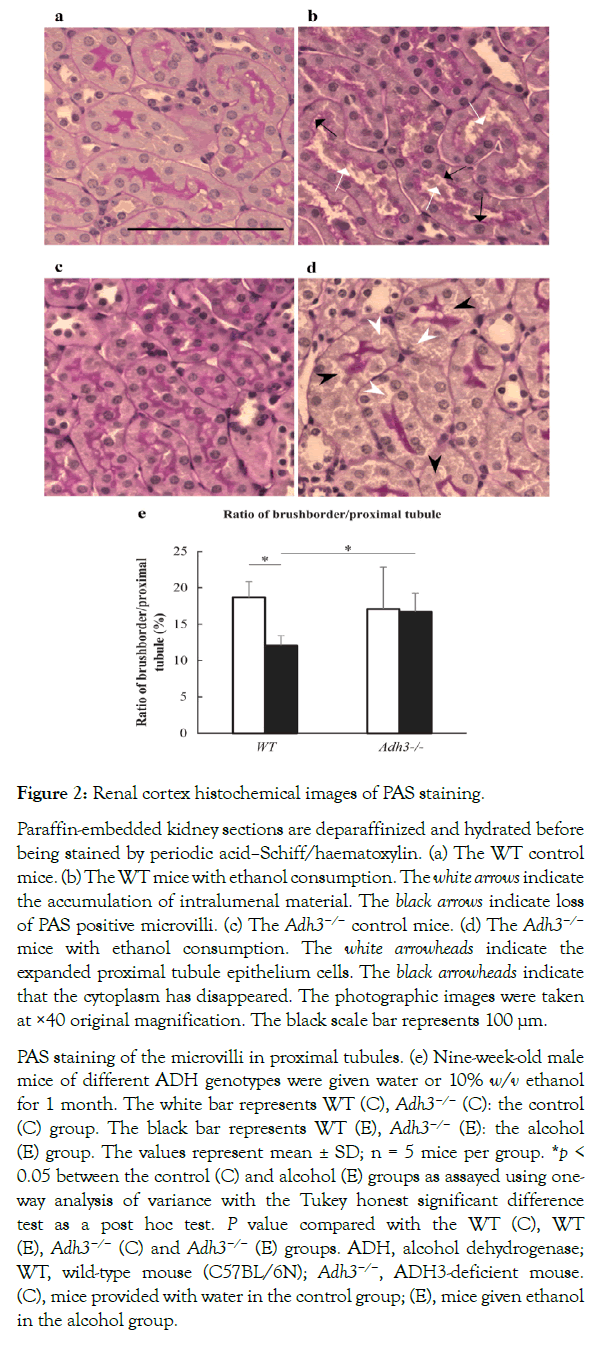
Figure 2: Renal cortex histochemical images of PAS staining.
Paraffin-embedded kidney sections are deparaffinized and hydrated before being stained by periodic acid–Schiff/haematoxylin. (a) The WT control mice. (b) The WT mice with ethanol consumption. The white arrows indicate the accumulation of intralumenal material. The black arrows indicate loss of PAS positive microvilli. (c) The Adh3−/− control mice. (d) The Adh3−/− mice with ethanol consumption. The white arrowheads indicate the expanded proximal tubule epithelium cells. The black arrowheads indicate that the cytoplasm has disappeared. The photographic images were taken at ×40 original magnification. The black scale bar represents 100 µm.
PAS staining of the microvilli in proximal tubules. (e) Nine-week-old male mice of different ADH genotypes were given water or 10% w/v ethanol for 1 month. The white bar represents WT (C), Adh3−/− (C): the control (C) group. The black bar represents WT (E), Adh3−/− (E): the alcohol (E) group. The values represent mean ± SD; n = 5 mice per group. *p < 0.05 between the control (C) and alcohol (E) groups as assayed using one-way analysis of variance with the Tukey honest significant difference test as a post hoc test. P value compared with the WT (C), WT (E), Adh3−/− (C) and Adh3−/− (E) groups. ADH, alcohol dehydrogenase; WT, wild-type mouse (C57BL/6N); Adh3−/−, ADH3-deficient mouse. (C), mice provided with water in the control group; (E), mice given ethanol in the alcohol group.
Electron microscopic observation
The renal morphological changes in the proximal tubule and glomeruli were also observed in the WT (E) mice on electron microscopy (Figure 3). Although the WT (C) mice showed no remarkable pathological abnormalities in the proximal tubules and glomeruli (Figure 3a), the WT(E) miceshowed mitochondrial decay in the proximal tubules (Figure 3b and 3c), necrosis of the proximal tubule epithelium cells (Figure 3b), vacuolization, accumulation of intralumenal material, and loss of microvilli (Figure 3c) in the proximal tubules. Furthermore, focal foot process effacement and apoptosis of podocyte epithelium cells were observed in glomeruli (Figure 3d). On the other hand, the Adh3−/− (E) mice showed no distinct change except for mitochondrial decay in the proximal tubules (Figure 3f). The Adh3−/− (C) mice showed no remarkable difference from the WT (C) mice (Figure 3e).
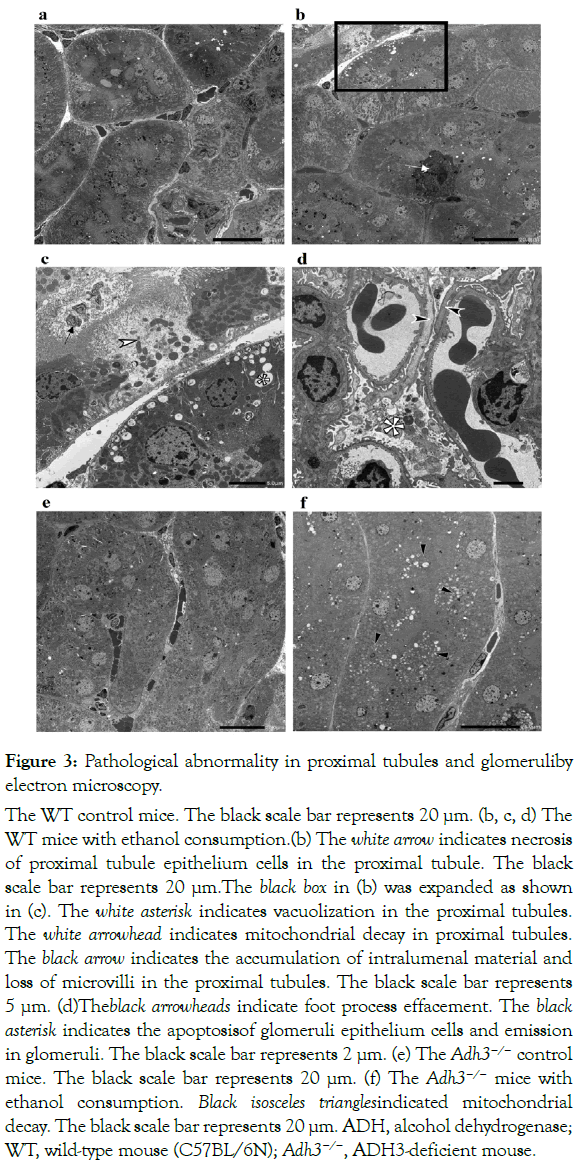
Figure 3: Pathological abnormality in proximal tubules and glomeruliby electron microscopy.
(a) The WT control mice. The black scale bar represents 20 µm. (b, c, d) The WT mice with ethanol consumption.(b) The white arrow indicates necrosis of proximal tubule epithelium cells in the proximal tubule. The black scale bar represents 20 µm.The black box in (b) was expanded as shown in (c). The white asterisk indicates vacuolization in the proximal tubules. The white arrowhead indicates mitochondrial decay in proximal tubules. The black arrow indicates the accumulation of intralumenal material and loss of microvilli in the proximal tubules. The black scale bar represents 5 µm. (d)Theblack arrowheads indicate foot process effacement. The black asterisk indicates the apoptosisof glomeruli epithelium cells and emission in glomeruli. The black scale bar represents 2 µm. (e) The Adh3−/− control mice. The black scale bar represents 20 µm. (f) The Adh3−/− mice with ethanol consumption. Black isosceles trianglesindicated mitochondrial decay. The black scale bar represents 20 µm. ADH, alcohol dehydrogenase; WT, wild-type mouse (C57BL/6N); Adh3−/−, ADH3-deficient mouse.
Biochemical parameters in serum and urine
The results of biochemical studies are shown in Figure 4. Between the genotypes for body weight, no significant difference was observed in the both the control and alcohol consumption groups (Figure 4a). Both blood urea nitrogen (BUN) and serum creatinine levels showed no significant differences between the WT and Adh3−/− mice by CAC (Figure 4b and 4c). On the other hand, both albumin and total protein were significantly leaked in urine in the WT mice by CAC, but not in the Adh3−/− mice (Figure 4d and 4e).
The urinary potassium level showed no significant difference after CAC in the WT andAdh3−/− mice (Figure 4f), and between the genotypes, no significant difference was observed in the control or CAC mice. The urinary chloride level showed no significant difference after CAC in the WT and Adh3−/− mice (Figure 4g). We also found no significant difference between the WT and Adh3−/− mice in the control groups; however, the urinary chloride in the WT (E) mice was higher than that in the Adh3−/− (E) mice (Figure 4g). The urinary osmotic pressure showed a similar pattern as the urinary chloride level (Figure 4h).
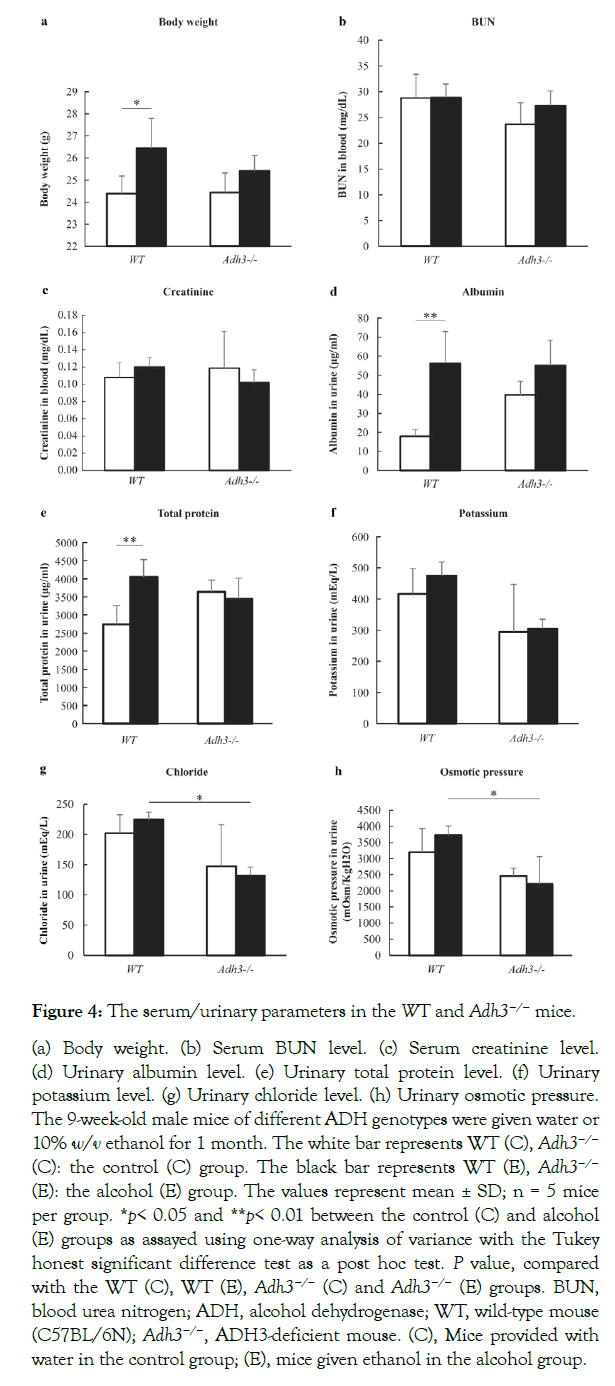
Figure 4: The serum/urinary parameters in the WT and Adh3−/− mice.
(a) Body weight. (b) Serum BUN level. (c) Serum creatinine level. (d) Urinary albumin level. (e) Urinary total protein level. (f) Urinary potassium level. (g) Urinary chloride level. (h) Urinary osmotic pressure. The 9-week-old male mice of different ADH genotypes were given water or 10% w/v ethanol for 1 month. The white bar represents WT (C), Adh3−/− (C): the control (C) group. The black bar represents WT (E), Adh3−/− (E): the alcohol (E) group. The values represent mean ± SD; n = 5 mice per group. *p< 0.05 and **p< 0.01 between the control (C) and alcohol (E) groups as assayed using one-way analysis of variance with the Tukey honest significant difference test as a post hoc test. P value, compared with the WT (C), WT (E), Adh3−/− (C) and Adh3−/− (E) groups. BUN, blood urea nitrogen; ADH, alcohol dehydrogenase; WT, wild-type mouse (C57BL/6N); Adh3−/−, ADH3-deficient mouse. (C), Mice provided with water in the control group; (E), mice given ethanol in the alcohol group.
Several studies have reported that alcohol consumption affects renal morphological changes. Smith et al. (1990) reported that in rats, high alcoholconcentration induced IgA nephropathy, including mild mesangial expansion, intense IgA deposition and foot process effacement. Van et al.(1977)demonstrated that a liquid diet containing 5% ethanol caused rat renal disorders such as swelling of cytoplasm and loss of the brush border in the proximal tubules. Latchoumycandane et al. (2015) also suggested that the histology of PAS-stained kidney sections showed the expansion of the mesangial matrix of glomeruli with occlusion of proximal tubules after 6.4% ethanol-liquid diet feeding for 1 week. Furthermore, Latchoumycandane et al. (2014) also suggested that alcohol caused damages to the proximal tubules, vacuolization, accumulation of intraluminal material, dysplastic tubular outer membranes and reduced PAS glycoprotein staining of the microvilli, which were caused by ROS due to CYP2E1 [17,18]. In our study, pathological changes have been detected by CAC using 10% ethanol intake after 1 month in the WT mice. The loss of PAS glycoprotein staining of the microvilli was observed in the proximal tubules on light microscopy. Furthermore, mild vacuolization, nuclear apoptosis, mitochondria decay or loss of the microvilli were observed in the proximal tubules by electron microscopy. In addition, foot process effacement or apoptosis of epithelial cells were also observed in the glomeruli. These results were consistent with the results of the previous studies, indicating that these effects in the kidney were also caused by the current mild condition of CAC.
The role of ADH in the kidney has been demonstrated in few studies, except that Dinu et al. (2005) demonstrated that 2-g/kg ethanol consumption resulted in an increased ADH activity in the kidney. Furthermore, the localization of ADH in the kidney has not been investigated yet. We observed that ADH1 localizes in the distal tubules, but not in the proximal tubules, of the kidney in both the WT (C) and WT (E) mice (Supplementary Figure 1). On the other hand, ADH3 localizes in both the proximal and distal tubules. In general, proximal tubules are affected more sensitively by toxin than distal tubules [30]. In the present study, ADH3 was localized in the proximal tubules, where renal pathologies such as vacuolization, nuclear apoptosis and loss of microvilli were observed in the WT (E) mice. These pathologies may be induced by the participation of ADH3 in alcohol metabolism in vulnerable sites. Although not only ADH3 but also ADH1 localizes in distal tubules, where alcohol is metabolized by these ADHs, the distal tubules were not damaged under our CAC condition, probably because the areas are not so vulnerable to alcohol metabolism as compared with the proximal tubules. Focal foot process effacement and apoptosis of podocyte epithelium cells in glomeruli were also observed in the WT (E) mice, but not in the Adh3−/− (E) mice. These pathological changes may be also due to ADH3, although the localization of ADH3 was not apparent in the glomeruli. On the other hand, mitochondrial decay was observed in the proximal tubules in both the WT (E) and Adh3−/− (E) mice. The mitochondrial decay by CAC might be induced by the participation of ADH1, but not ADH3, in alcohol metabolism. The role of MEOS in this renal pathomorphological change may be negative because the liver CYP2E1 protein level was not increased by the same CAC condition in both the WT and Adh3−/− mice [25]. Overall, the pathological renal changes in the Adh3−/− (E) mice were not sosevere as compared with those in the WT (E) mice, which suggests that ADH3 contributes to the pathological changes in renal tissues induced by CAC.
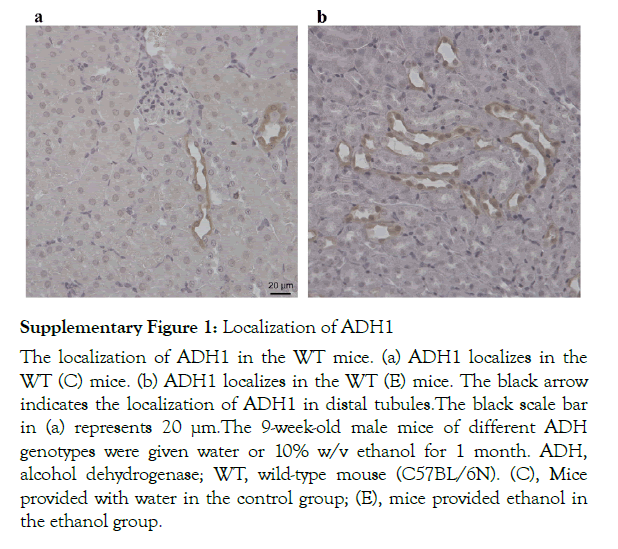
Supplementary Figure 1: Localization of ADH1
The localization of ADH1 in the WT mice. (a) ADH1 localizes in the WT (C) mice. (b) ADH1 localizes in the WT (E) mice. The black arrow indicates the localization of ADH1 in distal tubules.The black scale bar in (a) represents 20 µm.The 9-week-old male mice of different ADH genotypes were given water or 10% w/v ethanol for 1 month. ADH, alcohol dehydrogenase; WT, wild-type mouse (C57BL/6N). (C), Mice provided with water in the control group; (E), mice provided ethanol in the ethanol group.
Alcohol consumption could leak albumin and protein into urine and increase the BUN and serum creatinine levels in blood [17]. In our study, albumin and protein were significantly leaked into urine after CAC in the WT (E) mice, which was consistent with the results of the previous study. The leakages of albumin and protein into urine may be due to an increase in glomerular permeability, which might lead to albuminuria and proteinuria during alcohol consumption and trigger the foot process effacement in glomeruli, as observed in the WT (E). On the other hand, the BUN and serum creatinine levels were not remarkably changed by CAC in both the WT and Adh3−/− mice. As the electrolyte balance and osmotic pressure were generally stable, the reabsorption function might be normal in the proximal tubule. These results suggest that CAC increased the glomerular permeability and exacerbated the alcohol urinary abnormalities in the WT mice during CAC by the participation of ADH3 in alcohol metabolism.
Our results suggest that ADH3 may induce renal pathological changes in proximal tubules by metabolizing alcohol in this site and increased the glomerular permeability during CAC. Thus, ADH3 may contribute to renal pathological changes induced by CAC and exacerbate alcoholic kidney disorders.
This work was supported by JSPS KAKENHI Grant Number JP18K17421.
We greatly thank Ms Miyuki Takatori and Ms Kiyomi Kikukawa for their help with techniques; Prof Hironobu Katsuyama for the advice on statistical analysis and Dr Vitalii Katsuyama for proofreading this article.
All authors declare no conflict of interest related to this study.
Citation: Katsuyama M, Okuda T, Sasaki Y, Ishizaki M, Wada K, et al. (2021) Role of Class III Alcohol Dehydrogenase (ADH3) in Renal Pathological Changes Induced by Chronic Alcohol Consumption in Mice. J Alcohol Drug Depend 9: 340.
Received: 26-Mar-2021 Accepted: 15-Apr-2021 Published: 22-Apr-2021 , DOI: 10.35248/2329-6488.21.9.340
Copyright: © 2021 Katsuyama M, et al. This is an open-access article distributed under the terms of the Creative Commons Attribution License, which permits unrestricted use, distribution, and reproduction in any medium, provided the original author and source are credited.