Journal of Agricultural Science and Food Research
Open Access
ISSN: 2593-9173
ISSN: 2593-9173
Research Article - (2025)Volume 16, Issue 1
In Ethiopia, bread wheat (Triticum aestivum L.) is an important source of food and income for smallholder farmers. However, its productivity is very low, which is attributed to poor agronomic and soil fertility management practices. Therefore, a field experiment was conducted in Damot Gale district during 2021 main cropping season in order to identify the effect of blended (NPSB) fertilizer rates on growth, yield and yield components of bread wheat genotypes as well as to determine the optimum and economically feasible fertilizer rate for bread wheat production. The experiment consisted of four levels of NPSB (0, 75, 150, 225 kg ha-1) and three bread wheat genotypes G-226930, G-238133 and G-238871 and with one standard check (Alidoro) variety combined factorial and laid out in randomized complete block design with three replications and analyzed by using. Data on crop phenology, growth, yield and components were collected and analyzed procedurally from all treatment combination units. The results revealed that, majority of agronomic traits were affected by the main effects of NPSB fertilizer rates and genotypes. Number of total tiller, number of productive tiller and spike length were significantly (p<0.05) affected by interaction factors. Maximum value obtained from the application of 225 kgha-1 NPSB fertilizer rate and minimum value recorded from control for all agronomic parameters. The partial budget analysis revealed that the highest net benefit (benefit 150,357.24 Birrha-1) with MRR 280.51%) % was obtained from G-238871 with application of 225 kgha-1 NPSB and all genotypes including check responded to 225 kgha-1 NPSB rate for high yield production and economically beneficial. Based on the result of this study, genotype G-238871 that received 225 kgha-1 NPSB fertilizers was appropriate in the study area but for further realities, the experiment would have to be replicated over the year and location to get a conclusive result and optimum fertilizer recommendation for the specific area in order to ascertain the finding of the current study.
Effective tiller; Grain yield; Main effect; Significant; Partial budget
Wheat (Triticum aestivum L.) is a significant staple crop in the world. Because of its involvement in global trade and the regular food shortages it experiences, its significance has increased even further. Among cereal crops, wheat is the most important, making up 30% of all cereal food consumed globally and a key source of nutrition for more than one third of the world's population. It is one of the most important cereals cultivated in Ethiopia. In 2019, 1.69 million ha of land was covered with production of 4.5 million tons. It ranks fourth after teff, maize and sorghum in area coverage and total production; the area coverage in the same year was 2.8, 2.1 and 1.9 million hectares respectively and with total production of 47.5, 72.2 and 46.3 million quintals respectively. The national average yield of wheat in the country is 2600 kg ha-1. The crop is produced almost in all highland parts of the country with major wheat belt areas of Arsi and Bale areas of Oromia; the other major areas of wheat production include the Shoa, Gojam and Gonder areas of the country; with minor production found almost in all parts of the highlands. Wheat is one of the important cereal crops in the world and it has the widest distribution among cereal crops [1].
It is the most significant cereal crop in Ethiopia, which is grown for food and profit. After tef, maize and sorghum, it is the fourth most extensively produced crop. In Ethiopia, wheat is primarily grown between 1500 and 3000 meters above sea level, where the required cooling temperature is met. With an annual wheat production of 3.8 million tons, Ethiopia ranks second in Sub-Saharan Africa (SSA) behind South Africa. However, the amount of wheat produced is insufficient due to several factors to meet the domestic needs, which is compelling the country to import about 25% to 35% of the annual wheat grain required for consumption. The removal of crop residues from farmlands, the frequent application of inorganic fertilizers without fallowing and the minimal or insufficient application of manure have all contributed to the recent emergence of another noteworthy factor that has caused many smallholder farms to experience a depletion of vital micronutrient components in their soil [2].
According to the national soil database of Ethiopia, in the main crop-producing regions of the nation, ongoing wheat farming has led to the depletion of macronutrients as well as micronutrients including zinc (Zn), boron (B) and copper (Cu). On other hand, depletion of nutrients including continuous cropping and inadequate replacement of nutrients removed in crop harvest or lost through erosion and leaching has been the major causes of soil fertility decline in the Wolaita area. This data indicated that productivity of wheat was less in Wolaita as compared with national and regional average yield level. According to CSA, the average productivity of wheat at the national, regional and Wolaita zone levels is 3046, 2940 and 2897 kg ha-1, respectively. Thus, to boost yield productivity and to address the critical nutrient shortages of blended NPSB fertilizer rate and plus or minus potash fertilizer are needed in the tested soils in Ethiopia. To address the bottleneck of yield reduction, boost production and productivity that could result in high grain yield in terms of disease resistance and determine the most effective and financially feasible application of blended NPSB fertilizer rate, it is necessary to evaluate genotypes for their response to different rates of blended (NPSB) fertilizer level for yield performance. The genotypes used in this study, have never been tested for their specific amount of fertilizer requirement. Therefore the objective of the study was to determine the optimum and economically feasible NPSB fertilizer rate for the best performed bread wheat genotype [3].
A field experiment was conducted during 2021 cropping season at Damot Gale district of (Ade Koyisha sub-district) Wolaita zone, Southern Ethiopia. Damot Gale is a district in Southern Ethiopia regional state and part of the Wolayita zone. It is bordered on the southwest by Sodo Zuria, on the northwest by Boloso Sore and Damot Pulasa, on the north by the Hadiya zone, on the east by Diguna Fango and on the southeast by Damot Weyde. It is located 375 km South of Addis Ababa, with specific geographic coordinates of Adekoyisha was 36°59'30"N–7°00'30"N latitude and 37°52'30''E–37°54'30"E Longitude and elevated at 2800 m.a.s.l. The mean annual rainfall of the site is between 1200 mm–1300 mm and its maximum and minimum temperature is 26°C and 13.4°C respectively. Major annual crops grown in the area like haricot bean (Phaseolus vulgaris L.), maize (Zea mays L.), sweet potato (Ipomoea batatas) and teff (Eragrostis teff), field pea etc (my own field observation). Soil type was clay [4].
Experimental materials
Plant materials: Three genotypes were selected from 48 second trial materials which were tested in preliminary yield trials at Deberzit and Wolaita zone during 2019 and 2020 cropping time respectively in different agro ecologies. Those were promoted based on the yield and other agronomic performances including diseases reactions in the previous season. The listed three genotypes, G-226930, G-238133 and G-238871 are originally obtained from Ethiopian Institute of Biodiversity (EIB) and one standard check (Alidoro) which is well adapted cultivar (in Wolaita zone specifically study area) was used as planting materials [5].
Fertilizer materials: Blended NPSB fertilizer (18.9 N%, 37.7% P2O5%, 6.95% S and 0.1% B) and urea (46% N) were used as fertilizer sources. The fertilizer treatments are the different application rates of NPSB that were composed of nitrogen, phosphorus, sulfur, boron, respectively whereas urea was applied uniformly to all plot.
Treatments and experimental design: The experiment had 16 treatments in factorial combination of three promising lines of bread wheat genotypes (G-226930, G-238133, G-238871 and one standard cultivar) and four rates of blended NPSB fertilizers with four levels (0, 75, 150 and 225 kg ha-1) and 100 kg ha-1 urea was used as supplementary treatment. The treatments were arranged in a Randomized Complete Block Design (RCBD) with three replications with net plot area 2.56 m2 (1.6 m × 1.6 m). Planting was carried out in the 2nd week of July, following planting practice of the farmers in the area. The full doses of fertilizers were applied at the time of planting through drilling along the rows at 20 cm intervals with the seed rate of 125 kg ha-1 [6].
Experimental procedures and field management: The experimental field was ploughed, pulverized and leveled in order to get smooth seed bed. It was ploughed with oxen to a fine tilth four times and the plots were leveled manually. Then, a field layout was made and each treatment was assigned randomly to the experimental units within a block. Bread wheat seed was sown at the recommended seed rate of 125 kg ha-1 in rows of 20 cm spacing manually by drilling. The whole amount of blended (NPSB) fertilizer and 1/2 of nitrogen was applied at the time of sowing and the remained half dose of nitrogen was applied by top dressed method at the time of tillering. Weeding was done four times and harvesting and threshing was done manually [7].
Soil sampling and analysis: The physical and chemical characteristics of the soil in the experimental field were examined prior to planting. During field preparation, soil samples were taken from 0 to 20 cm deep in a random zigzag pattern. One kilogram of the soil from the experimental field was collected as a working sample after the samples were composited. The composite sample was submitted to Areka Agricultural Research Center soil testing laboratory to analyze the soil's texture, pH, total nitrogen content, available phosphorus, cation exchange capacity, organic carbon content, available sulphur and boron [8].
Data collection and measurements
Days to 50% heading: Days to spike heading was determined as the number of days taken from the date of sowing to the date of 50% heading of the plants from each plot by visual observation.
Days to 90% physiological maturity: Days to physiological maturity was determined as the number of days from sowing to the date of when 90% of the panicles turned to yellow straw color. It was recorded when no green color remained on glumes and panicles of the plants, i.e., when grains are difficult to break with thumbnail.
Plant height: Plant height was measured from the soil surface to the tip of the spike (awns excluded) of 10 randomly tagged plants from the net plot area at physiological maturity.
Number of total tillers: Number of total tillers were determined from (0.5 m × 0.5 m (0.25 m2)) length of three rows from the net plot and converted to per meter square of net plot at physiological maturity by counting the number of tillers.
Number of productive tillers: Number of productive tillers were determined at maturity by counting all kernel-bearing spikes from 0.5 m × 0.5 m (0.25 m2) length of three rows from the net plot and converted to per meter square of net plot at physiological maturity.
Spike length (cm): It was measured from the bottom of the spike to the tip of the spike excluding the awns from 10 randomly tagged plants from the net plot.
Number of kernels per spike: The amount of kernels per spike was carefully counted before the mean was determined and ten main tiller plants were chosen at random from each plot's net plot area.
Thousand seed weight: It was measured by counting a thousand seeds with a seed counter sensitive balance and weighing it.
Aboveground dry biomass: Plants taken from the net plot area were sun dried to measure consistent weight and translated to ton per hectare to calculate the aboveground dry biomass.
Grain yield: Grain yield was taken by harvesting and threshing the grain yield from net plot area. The grain yield was adjusted to 12.5% moisture content as:
Adjusted grain yield = Grain yield obtained (kg ha-1) × (100 - %MC)/(100 - 12.5) where MC is the actual moisture content of bread wheat grains at the time of measurement and 12.5 is the standard moisture content of bread wheat in percent. Finally, yield per plot was converted to kg ha-1.
Straw yield: Straw yield was obtained by subtracting grain yield from the total aboveground dry biomass yield for the respective treatment and expressed in kg ha-1.
Harvest index: Harvest index was calculated as the ratio of grain yield per plot to total aboveground dry biomass yield per plot expressed as ratio.
HI = Economic yield / Total aboveground biomass
Statistical analysis
All data collected were subjected to Analysis of Variance (ANOVA) procedure using Gen Stat 22th edition software. Comparisons among treatment means with significant difference for measured characters were done by using Fisher’s protected Least Significant Difference (LSD) test at 5% level of significance.
Partial budget analysis
The partial budget was analyzed following a partial budget procedure of International Maize and Wheat Improvement Center based on the existing cost of production. The concepts used in the partial budget analysis were the mean grain yield of each treatment, the gross benefit (GB) ha-1 (the mean yield for each treatment) and the field price of fertilizers (the costs of NPSB and urea and the application costs). The benefit of straw yield was included in the calculation of the benefit since the farmers of the study area use it. Marginal rate of return, which refers to net income obtained by incurring a unit cost of fertilizer and its application, was calculated by dividing the net increase in yield of bread wheat due to the application of each fertilizers rate. The Net Benefit (NB) was calculated as the difference between the gross field benefit and the Total Variable Cost (TVC) using the formula: NB = GFB - TVC Where GFB = Gross Field Benefit, TVC = Total Variable Cost. Actual yield was adjusted downward by 10% to reflect the difference between the experimental yield and the yield farmers could expect from the same size field. The dominance analysis procedure as described in CIMMYT was used to select potentially profitable treatments from the range that was tested. Any treatment that has higher TVC but net benefits that are less than or equal to the preceding treatment (with lower TVC but higher net benefits) is dominated treatment (marked as “D”). The dominance analysis illustrates that to improve farmers' income, it is important to pay attention to net benefits rather than yields, because higher yields do not necessarily mean high net benefits. The discarded and selected treatments using this technique were referred to as dominated and undominated treatments, respectively. For each pair of ranked treatments, % Marginal Rate of Return (MRR) was calculated using the formula:
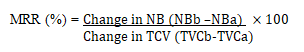
Where:
NBa = NB with the immediate lower TVC,
NBb = NB with the next higher TVC,
TVCa = The immediate lower TVC and
TVCb = The next highest TVC.
The %MRR between any pair of undominated treatments was the return per unit of investment in fertilizer. To obtain an estimate of these returns, the %MRR was calculated as changes in NB (raised benefit) divided by changes in cost (raised cost). Thus, a MRR of 100% implied a return of one Birr on every Birr spent on the given variable input. The fertilizer cost was calculated for the cost of each fertilizer of NPSB (Birr 18 kg-1) and N/UREA (Birr 11 kg-1) during sowing time. The cost of straw (Birr 1 kg-1) as well as the cost of NPSB at sowing and urea top dressing at tillering including transportation and labor cost was considered. The average open price of bread wheat at Bodit market was Birr 25.00 kg-1 in December 2021 during harvesting time [9].
Soil physico-chemical properties of the experimental site
The analytic results indicated that the experimental soil of Adekoyish sub-district was clay. Mean time the location having Organic Carbon content (OC). Soil OC was considered low according to the rating of Tekalign, who rated soils having OC value in the range of 0.86% to 2.59% as low, indicating low potential of the soil to supply nitrogen to plants through mineralization of organic carbon. The soil pH of the experimental field showed that the field has a pH of 5.83. It was rated as moderately acidic for experimental site (Ethio SIS, 2013). The CEC of the soil was 22.4 cmol kg-1 which, could be considered as high according to Landon classification, top soils having CEC greater than 40 cmol (+) kg-1 are rated as very high and 25-40 cmol kg-1 as high and 15-25, 5-15 and <5 cmol kg-1 of soil are classified as medium, low and very low, respectively. The available total nitrogen value was 0.12. According to EthioSIS TN content<0.1, 0.1-0.15, 0.15-0.3, 0.3-0 and>0.5 was very low, low, medium, high and very high respectively and available P of the soil was 12.2 mg kg-1. According to Hazelton and Murphy, the range of phosphorus in BrayII method is <7, 8-19, 20-39, 40-58 and >59 was very low, low, medium, high and very high respectively. Available sulfur value of the study area was 16.3 mg kg-1. Based on Ethio SIS soil classification for S values lies on low range. The classification is <9 very low, 10-20 low, 20-80 optimum and >80 mg kg-1 high. The available boron value of the study area was also 0.79 mg kg-1. According to Benton report, the critical levels of boron value for most Ethiopian soils is 1.1 mg kg-1-2.0 mg kg-1, whereas soil containing below this range was indicated as boron deficient soil. All information’s discussed blew referred under Table 1 [10].
| Adekoyisha | ||
|---|---|---|
| Physical properties parameters | Value | Rating |
| Soil particle size distribution | ||
| Sand% | 32 | |
| Silt% | 23 | |
| Clay% | 43 | |
| Texture class | Clay | |
| Chemical properties parameters | ||
| pH (1:2.5 soil to water ratio) | 5.83 | |
| Organic carbon (%) | 1.36 | |
| CEC (cmol(+)kg | 22.4 | medium |
| Total nitrogen (%) | 0.12 | low |
| Available phosphorus (mg/kg) | 12.2 | low |
| S (mg/kg) | 16.3 | low |
| B (mg/kg) | 0.79 | low |
| Note: OC: Organic Carbon; OM: Organic Matter; TN: Total Nitrogen; AP: Available Phosphorous; AB: Available Boron; AS: Available Sulfur; CEC: Cation Exchange Capacity | ||
Table 1: Selected physico-chemical properties of the soil of the experimental sit.
Crop phenology
Days to heading: The analysis of variance for days to 50% heading was significantly (p<0.05) affected by blended fertilizer and genotypes but did not affected their interaction factor. The longest number (78.67) of days was recorded from the 225 kg-1 NPSB fertilized treatments, while the shortest (62.60) days to 50% heading was recorded from control treatment (Table 2). This finding showed that the level of fertilizer increase from 0 to higher level rate, the date of heading increase due to synergetic effect of N, P, S, B fertilizer elements. The increment application of NPSB rate delays bread wheat to heading. Moreover N and P are major nutrients, which are important to enhance vegetative growth and delays heading of crops. This finding is consistent with Abebaw and Hirpa, who found that application of blended fertilizer (macro and micro) and urea, prolongs the vegetative growth stage of wheat. Similarly Diriba et al. suggested that blended fertilizer has a substantial effect on days to heading and maturity, accordingly at 300 kg of NPSZnB application with additional urea, the longest days to heading (71.7) and physiological maturity (113.0) were observed whereas the earliest dates to heading or flower and physiological maturity (61.3) and (106.2) recorded at control treatments respectively. On the other hand, (Mesfin and Kassa reported that with the increase in blended fertilizer rates of S, B, Zn, the number of days required for flowering, maturity and grain filling period increased. In contrast with Bekalu and Mamo who reported that fertilizer applied at a rate of 92 kgha-1 minimized the date of heading by eight days compared with the control treatment. In the current study genotype reached days to 50% heading relatively prolonged which received higher rate of fertilizer than low rate fertilized treatments unfertilized treatments (Table 2). Among genotypes, all genotypes had showed significance variation on days to heading comparing each other. G-238871 headed early header than others hence maximum (77.4) mean value recorded from G-238133 and minimum (64.167) mean value recorded from genotype G-238871 (Table 2). This might be difference in days to 50% heading attributed to the genetic factor among genotypes [11].
| Treatments | DH of 50% | DM (90%) | pH (cm) |
|---|---|---|---|
| Genotypes | |||
| G-226930 | 73.7b | 87.33b | 104.58a |
| G-238133 | 77.4a | 102.17a | 103.22ab |
| G-238871 | 64.2d | 74.42c | 94.78bc |
| Alidoro | 67.5c | 80.33c | 90.19c |
| LSD (0.05) | 2.73 | 9.19 | 11 |
| Blended NPSB fertilizer rate (kgha-1) | |||
| 0 | 62.583d | 63.00c | 77.52c |
| 75 | 68.250c | 83.92b | 91.56b |
| 150 | 73.250b | 93.00b | 109.13a |
| 225 | 78.667a | 104.33a | 114.57a |
| LSD(0.05) | 2.73 | 9.193 | |
| CV% | 4.65 | 12.81 | 10.82 |
| Note: LSD (0.05): Least Significant Difference at 5% level; CV: Coefficient of Variation; NS: Non-Significant. Means in columns followed by the same letter are not significantly different at 5% level of significance | |||
Table 2: Main effect of genotype and blended NPSB fertilizer rate on days to 50% heading, date of 90% maturity, plant height.
Days to physiological maturity: Days to 90% physiological maturity was significantly (P<0.05) affected by the main effect of blended fertilizer and genotypes whereas interaction factor had not significantly affected. The number of days required to achieve 90% physiological maturity ranged between 74.42 to 102.17 days and the result showed that there was significance variation among genotypes. Plants grown under the fertilized treatment that received the 225 kgha-1 NPSB kgha-1 NPSB rats of the blended fertilizers had enhanced 90% physiological maturity as compared to plants grown at unfertilized treatment. The maximum (104.33) mean value of days to physiological maturity was obtained from 225 kgha-1 NPSB fertilized treatment while the -1 minimum (63.00) mean value of days to physiological maturity was obtained from at 0 kgha-1 NPSB application rate (Table 2). Days to 90% physiological maturity was delayed (104.33 days) at 225 kgha-1 NPSB fertilizer and contrast earlier physiological maturity (63.00 days) was observed at 0 kgha-1 NPSB (Table 3). This result showed that the increment application of NPSB rate delays bread wheat to flower. This is due to the significance role combined effects of N, P and S which might have delay the physiological maturity of the plant. Moreover N and P are major nutrients, which are important to enhance vegetative growth and delays flowering of crops. This finding is consistent with Abebaw and Hirpo, who found that application of blend fertilizer (macro and micro) and urea, prolongs the vegetative growth stage of wheat. Similarly Diriba et al. suggested that blended fertilizer has a substantial effect on days to heading and maturity, accordingly at 300 kg of NPSZnB application with additional urea, the longest days to heading (71.7) and physiological maturity (113.0) were observed whereas the earliest dates to heading or flower and physiological maturity (61.3) and (106.2) recorded at control treatments respectively. On the other hand, reported that with the increase in blended fertilizer rates of S, B, Zn, the number of days required for flowering, maturity and grain filling period increased [12].
| Spike length (cm) Blended NPSB kgha-1 fertilizer rate | ||||
|---|---|---|---|---|
| Genotypes | 0 | 75 | 150 | 225 |
| G-226930 | 6.26f | 7.13def | 7.86bcd | 8.40bc |
| G-238133 | 6.33f | 7.03def | 7.80bcd | 8.43bc |
| G-238871 | 7.46de | 7.60cd | 8.63ab | 9.36a |
| Alidoro | 6.33f | 7.33de | 7.13def | 6.60ef |
| LSD (0.05) | 0.91 | |||
| CV% | 7.3 | |||
Table 3: Interaction effects of bread wheat genotypes by blended fertilizer on spike length.
Growth parameters
Plant height (cm): The result showed that, the main effect of genotypes and fertilizer had significantly (p<0.05) affected the mean plant height. However the interaction effect was not significant. Comparing tested genotypes with standard check the maximum average plant height was recorded from G-226930, whereas, minimum mean value recorded from Alidoro variety while among genotypes (Table 2). This result clearly indicated the existence of sufficient genetic variability among the genotypes, G-226930, G-238133 and G-238871 didn’t showed significance variation comparing each other, since most of the modern wheat cultivars are usually shorter than landraces and wild genotypes of wheat. Such views have been corroborated with the introduction of semi-dwarfing genes in to modern wheat and rice cultivars during the era of green revolution by CIMMYT scientists to reduce lodging and cost of production of the crops making them suitable for mechanized farming. In case of fertilizer rates, the plant height was reduced at the lowest fertilized treatments whereas the highest average plant height was recorded from higher NPSB ha-1 fertilizer rate (Table 2). This could be due to genetic variation among varieties with respect to plant height with response to applied blended fertilizer. Since the variation at control treatments observed due to absence of fertilizer especially adequate supply nitrogen, phosphorus and sulfur nutrients, which helped, in high vegetative growth and development of wheat crops. The result is in agreement with the finding of Melkamu et al., who reported that macro and micro nutrients (nitrogen, phosphorous with sulfur and born) fertilizers application can increase plant height with increasing doses and combination. Similarly, Melkamu et al., who indicated that increasing the rate of urea 150-350 kg ha-1 and 150-250 kgha-1 of NPSB blended fertilizer improved plant height. The pooled mean result reveals that the control plant had the shortest (60.4 cm) plant height and the longest (94.3 cm) plant height recorded from maximum blended fertilizer rate. Similar to this, Tolera et al. Reported that the application of 350/300 kg urea/NPSB ha fertilizer rates resulted in significantly higher mean plant heights of 90 and 102 cm in 2018, 98 cm in 2019 and were obtained, while the lower 66 and 73 cm in 2018, 83 cm in 2019 and 74 cm combined over years were recorded from the control. Also, Bekalu and Arega (2016) the average plant height of bread wheat increased when the nitrogen content was raised from 0 to 60 kgha-1 [13].
Yield and yield components
Spike length (cm): Spike length was significantly (p<0.05) influenced by the main effect of genotypes, fertilizer rate and their interaction. The fertilizer level increased from 0 kgha-1 to 225 kgha-1 level, the average value of spike length increase. The minimum (6.26) mean value recorded from control treatment with genotype G-226930 and the maximum (9.36) mean value recorded from 225 kgha-1 NPSB fertilizer received treatment with G-238871 (Table 3). The increase in spike length at the 225 kg NPSB ha-1 rate with genotype G-238871 could be due to improved root growth and increased uptake of nutrients and better growth as a result of synergetic effect of the nutrients and genetic varietal response. The result also indicated that macro nutrients (N, P) and micro nutrients (S and B) increased spike length of plant, even though recommended N (100 kgha-1) was equally applied to all plots except of control treatment. This is in agreement with Debnath et al., who reported that spike length of wheat significantly increased as a result of applying Zn and B blended with macronutrients based on the responses of varieties. Similarly, Bekalu and Mamo also reported that optimum amount of fertilizer application has significant effect on the growth of spike length [14].
Number of total tillers (m-2): The analysis of variance showed that the main effect of genotypes, blended NPSB fertilizer rate and their interaction were significantly (P<0.05) affected on the total numbers of tillers per meter square. The highest number of total tillers (491.33 m-2) was obtained from rate level 225 kg NPSB ha-1 with genotype G-226930, which was statistically at par with G3-238133 which treated with rate level 225 kg NPSB ha-1 (387.33). However, the lowest total number of tillers per m-2 (255.67) was also recorded from G-226930 without NPSB fertilizer application (control treatment) due to lack of growth initiating nutrients (Table 3). The possible reason for increment in number of total tiller might be due to the effect of balanced fertilization in which readily soluble minerals help to the vegetative growth of the crop. In line with the present studies, significant differences among genotypes/varieties and their response to NPSB fertilizer rate for number of effective tillers were reported by other researchers [15].
Number of productive tillers (m-2): The number of productive tillers m-2 was significantly (P<0.05) influenced by the main effects of genotypes and blended fertilizer rates and their interaction. The highest mean number of productive tillers (488) was recorded from genotype G-226930 with applied fertilizer level of 225 kg NPSB ha-1 (Table 4). Whereas, the lowest mean number of effective tillers (251.33) was recorded from control (unfertilized) plot with same genotype, which was statistically par with control treatment with G-238133 and G-238871. The increment of effective tillers was depended on genetic variability of genotypes and the increasing rate of the blended fertilizer rates. The increased in productive tillers on plots treated with blended fertilizer than in the unfertilized plot might be due to the profound effect of balanced nutrition for root development. This result is in agreement with that of Haftam and Yamoah who reported that application of blended fertilizer NPSZnB brought significant increase in productive tillers. Similarly, Fenta also reported that increase in the number of productive tillers produced due to blended fertilizers may be attributed to the synergic roles in enhancing productive tillers production by the plant. On other hand, applications of blended fertilizers (NPS+ZnB) were on parity with the blanket recommendation of DAP and urea fertilizers and gave significantly higher number of total and effective tillers of wheat [16].
Number of kernels per spike: The analysis of variance showed that number of kernels per spike was significantly (P<0.05) affected by the main effects of genotypes and blended fertilizer rates, but their interactions was not significantly influenced. Higher number of seeds per spike (51.6) was recorded from G-238871 genotype as compared to G-238133 (45.0) and lower (44.27) number of seeds per spike was recorded in control plot as well as higher (52.57) number of seed obtained from 225 kgha-1 NPSB treated plot (Table 4). Number of seeds per spike becomes significantly increased as the rate of NPSB application increased from 0 to 225 kgha-1. This might be due to the addition of blended fertilizer application rates in the experimental site there was increased appearance of seeds in their spikes. The results were in conformity with that of Tayebeh et al., who stated that increasing N rates up to optimum level significantly increased number of seed spike-1. This is in agreement with Nasser and Debnath et al., who reported that the spike length of wheat significantly increased as a result of applying Zn and B blended with macronutrient [17].
| Genotypes | Number of total tillers m-2 NPSB fertilizer rate kgha-1 |
Number of productive tiller m-2 NPSB fertilizer rate kgha-1 |
||||||
|---|---|---|---|---|---|---|---|---|
| 0 | 75 | 150 | 225 | 0 | 75 | 150 | 225 | |
| G-226930 | 255.67i | 317.00fgh | 414.00bc | 491.33a | 251.33j | 313.67ghi | 410.00bc | 488.00a |
| G-238133 | 344.67defg | 329.00efg | 383.00bcde | 387.33bcde | 333.00defgh | 319.00fgh | 376.33bcde | 376.00bcde |
| G-238871 | 395.00bcd | 379.33bcde | 414.33bc | 437.67ab | 384.00bcd | 370.00bcdef | 404.67bc | 425.33b |
| Alidoro | 265.33hi | 309.00ghi | 340.00defg | 369.00cdef | 260.00ij | 299.33hij | 325.33efgh | 360.67cdefg |
| LSD (0.05) | 29.31 | 55.61 | ||||||
| CV% | 9.65 | 9.3 | ||||||
Table 4: Interaction effects of bread wheat genotypes by NPSB fertilizer rate on total number of tillers and productive tiller.
Thousand kernel weight: The analysis of variance showed that the main effect of genotypes and blended fertilizer rates significantly (p<0.05) affected Thousand Kernel Weight (TKW), but there was no interaction effect. The highest mean value (45.87gm) was recorded from G-238871 than the other genotypes in TKW. The highest TKW (44.91) was produced by the application of 225 kg ha-1 NPSB while the lowest (36.78) value obtained from control treatment (Table 5). The application of increasing blended fertilizer rates in the experimental area increased the seeds size and the amount of powder of bread wheat varieties. Because of that TKW of each treatment were different. Tayebeh et al., who reported number seeds spike-1 and 1000 grain weight, were significantly enhanced by increasing nitrogen levels [18].
| Treatments | Number of kernels per spike | Thousand seed weight (g) |
|---|---|---|
| Genotypes | ||
| G-226930 | 45.87b | 38.40b |
| G-238133 | 45.00b | 37.80b |
| G-238871 | 51.60a | 45.87a |
| Alidoro | 50.23a | 43.983a |
| LSD (0.05) | 1.5 | 3.28 |
| Blended NPSB Fertilizer rate (kgha-1) | ||
| 0 | 44.27d | 36.78b |
| 75 | 47.07d | 40.05b |
| 150 | 48.78b | 44.30a |
| 225 | 52.57a | 44.91a |
| LSD (0.05) | 1.5 | 3.28 |
| CV% | 3.74 | 9.49 |
Table 5: Main effect of blended genotype and NPSB fertilizer rate on number of kernels per spike and thousand seed weight (g).
Aboveground biomass yield: Analysis of variance showed that the main effects of genotype and blended fertilizer rate were significantly (p<0.05) affected aboveground dry biomass yield but interaction factor was not significantly affected. Among genotypes there were significance variation contrasting genotypes each other. The maximum (12778) mean value obtained from G-238871 but the minimum (11299) mean value obtained from genotype G-238133 as well as the maximum (13373) mean value recorded from 225 kgha-1 NPSB fertilizer rate treated plot and the minimum (11077) mean value recorded from control treatment (Table 5). This might be due to better crop nutrition through applied blended micronutrient (B) with macronutrients (N, P and S), which may result in improved vegetative growth of crops. The increase in aboveground dry biomass at the highest rates of NPSB might have resulted from improved root growth and increased uptake of nutrients favoring better growth and delayed senescence of leaves of the crop due to synergetic effect of the nutrients. The result also indicated that even in the absence of K, the blend of fertilizer contributed to enhance the aboveground dry biomass yield of wheat plants grow in field experiment. This result agrees with that of Dawit et al., who reported that increasing N from 0 to 184 kg ha-1 and P from 0 to 138 kg ha-1 increased the aboveground dry biomass yield of wheat by about 70.1% and 40.6%, respectively. Similarly, Bekalu and Mamo also reported that increasing N rates from 23 to 69 kgha-1 increased aboveground dry biomass of wheat by about 22.6%. Likewise, Wakene et al., stated that supply of P2O5 at rate of 69 kg ha-1 in wheat found to be adequate to produce maximum aboveground dry biomass [19].
Straw yield: The result showed highly significant (P<0.05) difference among the genotypes and NPSB fertilizer of wheat on straw yield while the interaction between the two factors were not-significant. Variety Alidoro had the highest straw yield (7148 kg ha-1) whereas genotype G-226930 had the lowest straw yield (6572.1 kgha-1) (Table 5). This might be due to varying response of varieties to fertilizer application or differences in genetic make-up of the varieties. This result supported the findings of Ghaarif et al., and Gul et al., who reported that substantial difference in wheat straw production between genotypes. The result showed that an increase in straw yield when fertilizer rate increased from the lowest to the highest rate. The highest straw yield of 7011.4 kgha-1 was obtained at the highest NPSB rate of 225 kgha-1 whereas the lowest straw yields of 6565.8 kgha-1 was obtained from the control (Table 5). The significant increase in straw yield in response to the highest rate of blended NPSB might be attributed to the synergistic roles of the nutrients that enhanced growth and development of the crop. The result is consistent with that of Nasser and Gizawy, who reported increased straw yield of wheat with increase in NP fertilizers rates up to 90/45 kgha-1. Bereket et al. also reported that the highest straw yield was recorded at the highest nitrogen rate of 69 kg N ha-1. Similarly, Gul et al., reported that higher nitrogen application (160 kgha-1) has more contribution in higher straw yield production (9098.65 kgha-1) as compared to control treatment (5302.97 kgha-1) [20].
Grain yield: The ultimate goal in crop production is to maximize economic yield, which is a complex function of individual yield components in response to the genetic potential of the cultivars and inputs used. In a broad sense, growth in cereals is directly related to grain yield. Grain yield is the product of the number of grains per unit area and the weight of individual grains. The analysis of variance showed that both main effects of genotype and blended NPSB fertilizer were significantly (P<0.05) affected on the grain yield of bread wheat but the interaction effect was not affected. The highest (5940.2 kg ha-1) mean grain yield was obtained from G3-238871 which didn’t showed yield increment than Alidoro variety and lowest (4637.2) mean value obtained from genotype G-238133 (Table 5). The grain yield difference observed among genotypes might be due to differences in genetic make-up of the genotypes. The highest (6361.2 kgha-1) grain yield was obtained at the highest rates of NPSB ha-1 and the lowest (4511.9 kgha-1) grain yield was recorded from unfertilized plot (Table 5). The increase in grain yield at NP rate might have resulted from improved root growth and increased uptake of nutrients and better growth favored due to the synergetic effects of both nutrients which enhanced yield components and yield. In agreement with this result, Haile et al., found that increasing N rate from 0 to 120 kg N ha-1 increased grain yield of bread wheat. Bereket et al. also reported that increasing P rate from 46 to 69 kg P2O5 ha-1 increased grain yield of bread wheat by about 6.8%. Similarly, Mulugeta et al., reported that application of nutrients like K, S, Zn, Mg and B used in experiments significantly increased grain yield and yield component of bread wheat as compare to the control (no fertilizer) [21-24].
Harvest index: The ability of varieties to partition the dry matter into economic (grain) yield is indicated by its harvest index, which was significantly ((p<0.05) varied among genotype and fertilizer rate but not their interaction. Among genotypes the maximum (0.46) mean value obtained from genotype G-238871 and the minimum (0.40) mean value obtained from genotype G-238133 (Table 6). This might be due to inherent differences between the genotypes in the yield components like the number of tillers per plant, number of grains per spike and 1000 grain weight. The maximum (0.470) mean value obtained from the treat which received 225 kgha-1 NPSB Fertilizer rate and the minimum (0.405) mean value recorded from control treatment. This variation could be genetic variability of bread wheat genotypes in response to different level of blended fertilizer rate. According to Jemal et al., significant varietal differences on harvest index in bread wheat varieties were reported. A mean harvest index of about 50% with a positive trend due to increasing N rate was previously reported in Ethiopia Taye et al., Generally the harvest index of a wheat increases with increase in fertilizer rate up to a certain level for all varieties. The result of the study agree with the findings of Sharer et al., who reported higher harvest index under higher level of nitrogen and phosphorus than application of lower levels of the fertilizers in maize plant [25].
| Treatments | Above ground biomass yield | Straw yield | Grain yield | Harvest index |
|---|---|---|---|---|
| Genotypes | ||||
| G-226930 | 11357b | 6572.1c | 4784.5b | 0.415c |
| G-238133 | 11299b | 6662.3bc | 4637.2b | 0.401c |
| G-238871 | 12778a | 6837.7b | 5940.2a | 0.462a |
| Alidoro | 12675a | 7148.0a | 5668.0a | 0.440b |
| LSD(0.05) | 522.89 | 263.69 | 405.41 | 0.019 |
| Blended NPSB fertilizer rate (kgha-1) | ||||
| 0 | 11077c | 6565.8c | 4511.9c | 0.4050c |
| 75 | 11404c | 6702.8bc | 4841.3c | 0.4178bc |
| 150 | 12256b | 6940.2ab | 5315.5b | 0.4275b |
| 225 | 13373a | 7011.4a | 6361.2a | 0.4700a |
| LSD(0.05) | 522.89 | 263.69 | 405.41 | 0.019 |
| CV% | 5.21 | 4.65 | 9.25 | 5.54 |
Table 6: Main effects of genotype and blended fertilizer rate on aboveground biomass yield straw yield, grain yield and harvest index (%).
Partial budget analysis
Partial budget analysis is important to identify experimental treatments with an optimum return to the farmer’s investment and to develop recommendation for the agronomic data. Experimental yields are often higher than the yields that farmers could expect using the same treatments; hence in economic calculations, yields of farmers are adjusted by 10% less than that of the research results. As indicated in Table 6, the partial budget analysis showed that highest net benefit of (150,357.24) Birr ha-1 was obtained for genotype G-238871 that received 225 kg NPSB ha-1. However, the lowest net benefits of (102,109.67) Birr ha-1 were obtained from the genotype G-238133 which received 150 kgha-1 NPSB fertilized treatment with marginal rate return (441%). In this study, genotype gave G-238871 economic benefit of 150,357.24 birrha-1) with marginal rate of return (280.51%) at 225 kg NPSB ha-1 fertilizer rate with supplementary urea as well as genotype G-238133 which received 225 kgha-1 resulted highest net benefit of 138,174.84 birrha-1 with marginal rate of return 1,329.59% (Table 7). According to CIMMYT suggestion, the minimum acceptable marginal rate of return should be more than 100%. Therefore, genotype G-238871 at 225 kg NPSB ha-1 and for G-238133 at 225 kg NPSB ha-1 were economical and recommended for production of bread wheat in the study area and other areas with similar agro ecological condition [26, 27].
| Treatments | AGY (kg ha-1) | ASY (kg ha-1) | Income (ETB ha-1) |
GFB (Etb ha-1) | TVC (Etbha-1) | NB (Etbha-1) | MRR (%) | ||
|---|---|---|---|---|---|---|---|---|---|
| Genotypes | NPSB (kgha-1) | Grain | Straw | ||||||
| G-226930 | 0 | 3,594.51 | 5,825.43 | 89,862.75 | 5,825.43 | 95,688.18 | - | 95,688.18 | D |
| G-226930 | 75 | 4,120.29 | 5,796 | 1,03,007.25 | 5,796 | 1,08,803.25 | 2572.5 | 1,06,230.75 | 409.81 |
| G-226930 | 150 | 4,353.39 | 5,990.40 | 1,08,834.75 | 5,990.40 | 1,14,825.15 | 4285 | 1,10,540.15 | 251.64 |
| G-226930 | 225 | 5,155.92 | 6,047.73 | 1,28,898 | 6,047.73 | 1,34,945.73 | 6997.5 | 1,27,948.23 | 641.77 |
| G-238133 | 0 | 3,650.85 | 5,850.90 | 91,271.25 | 5,850.90 | 97,122.15 | - | 97,122.15 | D |
| G-238133 | 75 | 3,439.71 | 5,946.30 | 85,992.75 | 5,946.30 | 97,122.15 | 2572.5 | 94,549.65 | D |
| G-238133 | 150 | 4,041.72 | 5,351.67 | 1,01,043 | 5,351.67 | 1,06,394.67 | 4285 | 1,02,109.67 | 441 |
| G-238133 | 225 | 5,561.55 | 6,133.59 | 1,39,038.75 | 6,133.59 | 1,45,172.34 | 6997.5 | 1,38,174.84 | 1,329.59 |
| G-238871 | 0 | 4,539.87 | 5,897.70 | 1,13,496.75 | 5,897.70 | 1,19,394.45 | - | 1,19,394.45 | D |
| G-238871 | 75 | 5,176.89 | 6,033.42 | 1,29,422.25 | 6,033.42 | 1,35,455.67 | 2572.5 | 1,32,883.17 | 524.34 |
| G-238871 | 150 | 5,622.48 | 6,471.36 | 1,40,562 | 6,471.36 | 1,47,033.36 | 4285 | 1,42,748.36 | 576.06 |
| G-238871 | 225 | 6,045.66 | 6,213.24 | 1,51,141.50 | 6,213.24 | 1,57,354.74 | 6997.5 | 1,50,357.24 | 280.51 |
| Alidoro | 0 | 4,457.52 | 6,062.67 | 1,11,438 | 6,062.67 | 1,17,500.67 | - | 1,17,500.67 | D |
| Alidoro | 75 | 4,691.88 | 6,354.36 | 1,17,297 | 6,354.36 | 1,23,651.36 | 2572.5 | 1,21,078.86 | 139.09 |
| Alidoro | 150 | 5,118.21 | 6,469.47 | 1,27,955.25 | 6,469.47 | 1,34,424.72 | 4285 | 1,30,139.72 | 529.1 |
| Alidoro | 225 | 6,137.28 | 6,846.39 | 1,53,432 | 6,846.39 | 1,60,278.39 | 6997.5 | 1,53,280.89 | 853.13 |
Table 7: Partial budget analysis of the mean effects of blended fertilizer (NPSB) rates on bread wheat genotypes at study area in 2021 cropping season.
Based on yield response and economic indicators, applying the treatment 225 kgha-1 NPSB blended fertilizer along with 100 kg ha-1 urea would be advisable for wheat production at Adekoysha experimental site Damote Gale district. Application of blended and other fertilizer should be done based soil-test and site specific conditions since the availability of an element can vary depending on the nature of the soil. Based on the results of the current study on various parameters including yield and yield components of wheat, economic feasibility and agronomic efficiency, the following recommendations could be forwarded: Application of 225 kgha-1 NPSB blended fertilizer along with 100 kg ha-1 urea should be adopted to improve most of the wheat growth, yield and yield components and the economics of fertilizer and obtain the highest net benefit and marginal rate of return a well as to improve some soil chemical properties of the experimental site. In the future for keeping the soil health and improve the production of the yield, use of balanced nutrient application (macro and micro) for the farmer land is so important. Since this study was conducted in one location for one season, it should be repeated in more location and season for further recommendation in similar agro ecologies.
[Crossref] [Google Scholar] [PubMed]
Citation: Robel T, Chiko S (2025) Response of Different Blended Fertilizer Rates on Yield and Yield Related Traits of Bread Wheat (Triticum aestivum L.) Genotypes in Wolaita Zone, Southern Ethiopia. J Agri Sci Food Res. 16:198.
Received: 26-Nov-2023, Manuscript No. JBFBP-23-28173; Editor assigned: 30-Nov-2023, Pre QC No. JBFBP-23-28173 (PQ); Reviewed: 14-Dec-2023, QC No. JBFBP-23-28173; Revised: 17-Jan-2025, Manuscript No. JBFBP-23-28173 (R); Published: 24-Jan-2025 , DOI: 10.35248/2593-9173.25.16.198
Copyright: © 2025 Robel T, et al. This is an open-access article distributed under the terms of the Creative Commons Attribution License, which permits unrestricted use, distribution and reproduction in any medium, provided the original author and source are credited.