Immunome Research
Open Access
ISSN: 1745-7580
ISSN: 1745-7580
Research Article - (2020)Volume 16, Issue 3
N6-methyladenosine (m6A) plays critical roles in a broad set of biological processes. Knowledge about the precise location of m6A site in the transcriptome is vital for deciphering its biological functions. Although experimental techniques have made substantial contributions to identify m6A methylations, they are still labor intensive, costly and time consuming. As good complements to experimental methods, in the past few years, a series of computational approaches have been proposed to identify m6A sites in Saccharomyces cerevisiae. In order to facilitate researchers to select appropriate methods for identifying m6A sites, it is necessary to give a comprehensive review and comparison on existing computational methods. In this review, we summarized the current progresses in computational prediction of m6A sites and also assessed the performance of computational methods for identifying m6A sites on an independent dataset. Finally, challenges and future directions of computationally identifying m6A sites were presented as well. Taken together, we anticipate that this review will provide an important guide for future computational analysis of m6A and other RNA modifications.
Post transcription modification; N6-methyladenosine; Epitranscriptome; Machine learning method; 5-step rules
Among the ~150 kinds of known RNA modifications, the N6- methyladenosine (m6A) is the most prevalent internal mRNA/ lncRNA modifications, which occurs on the sixth nitrogen atom of adenine. As a reversible and dynamic post-transcriptional modification, the formation of m6A is installed by a multicomponent methyltransferase complex including METTL3, METTL14 and WTAP , while its demethylation is regulated by demethylases FTO and ALKBH5. The biological functions of dynamic m6A modification is regulated by m6A readers, such as heterogeneous nuclear ribonucleoprotein C (HNRNPC), YTH Domain Family proteins 1, 2 and 3 (YTHDF1, YTHDF2, YTHDF3) and YTHDC1, etc. [1,2-4].
Since discovered in 1970s, m6A has been observed in all three kingdoms of life. With the intensive researches on m6A methylation in recent years, its functions have been uncovered gradually. It has been found that m6A is associated with a broad set of fundamental cellular processes, such as RNA localization and degradation, RNA splicing, circadian rhythm, cell differentiation and reprogramming, immune tolerance and even the occurrence of diseases. However, few of them are currently understood in mechanistic detail. Identifying the precise location of m6A site in transcriptomes will be of a great help to investigate its biological mechanisms and functions.
With the development of next-generation sequencing technology, the MeRIP-Seq and m6A-seq high-throughput methods have been developed to identify m6A sites in Saccharomyces cerevisiae, Homo sapiens, and Mus musculus. However, the resolution of these techniques is low and couldn’t identify the exact methylated adenosines. Recently, the miCLIP technique was proposed, which provided the single-nucleotide resolution m6A profile of the human transcriptome. Based on these experimental data, several informative databases related with m6A modifications have been built. Taken together, these experiments promote the progress of researches on m6A modifications. However, experimental techniques are still labor-intensive and expensive for transcriptome-wide detection of m6A. Therefore, it is an urgent task to develop effective and low-cost approaches to automatically identify m6A sites. As excellent complements to experimental techniques, computational methods are in high demand to accurately detect m6A sites.
In 2013, Schwartz proposed the first computational model to predict the m6A site in the S. cerevisiae transcriptome, whose features include relative position in gene, nucleotide composition and predicted secondary structures. Although no public web server or software package was provided for this method, Schwartz’s pioneer work provides a new strategy for identifying m6A site. Since then, the scientific community witnessed an unprecedented amount of studies considering the application of machine learning method to identify m6A sites. For example, a series of machine learning based methods, such as m6Apred, iRNA-Methyl, SRAMP, pRNAm-PC, RAM-ESVM, RAM-NPPS and RNA-MethylPred have been proposed. All these prediction methods were developed in principle by following the guidelines of the Chou’s 5-step rule [5] as done in a series of powerful predictors developed recently for genome or proteome analyses.
Accordingly, these methods also share the advantages: (1) clearer in logic development, (2) more transparent in operation, and (3) more useful in practical application.
To provide the readership with a clear landscape about the recent developments in this important area, in this comprehensive review we are to elaborate their details in observing the Chou’s 5-step rule [5]: (1) how to construct or select a valid benchmark dataset to train and test the predictor; (2) how to formulate the biological sequence samples with an effective mathematical expression that can truly reflect their intrinsic correlation with the target to be predicted; (3) how to introduce or develop a powerful algorithm (or engine) to operate the prediction; (4) how to properly perform crossvalidation tests to objectively evaluate the anticipated accuracy of the predictor; (5) how to establish a user-friendly web-server for the predictor that is accessible to the public. Moreover, to facilitate users to select appropriate method according to their need, a comparison of existing methods in identifying m6A sites is to be performed based on an independent dataset. Finally, the challenges and future perspectives for identifying m6A sites are to be discussed.
Benchmark dataset for predicting m6a sites
Constructing a valid and reliable benchmark dataset is the critical step to train a computational model with high effectiveness [6,7]. In literature, the benchmark dataset usually consists of a training dataset and a testing dataset: the former is constructed for the purpose of training a proposed model, while the latter for the purpose of testing it. As pointed out by a comprehensive review [8], however, there is no need to separate a benchmark dataset into a training dataset and a testing dataset for validating a prediction method if it is tested by the jackknife or subsampling (K-fold) crossvalidation because the outcome thus obtained is actually from a combination of many different independent dataset tests.
For investigating the m6A sites, the benchmark datasets were constructed as follows. The sequence segment surrounding the m6A site contains the underlying discrimination information, whose size can be determined with the aid of sliding window scheme. The window length is usually set to 2n+1, whose central element is the experimentally confirmed m6A site, with n flanking nucleotides on both sides of the methylated adenosine. However, there is no uniform standard to set the window size. The determination of n is always associated with features extraction, prediction method and cross-validation performance.
In 2015, the first publicly available benchmark dataset (called S1 here) for the prediction of m6A sites was built by Chen. The positive samples in dataset S1 are 832 m6A sites with distances to the detected m6A-seq peaks less than 10 bp, which were extracted from the 1,307 experimentally confirmed m6A sites [53]. The negative samples in dataset S1 are the 832 non-m6A sites randomly selected from the 33,280 non-methylated adenines. Each sample in the dataset S1 is 21-nt long with the m6A sites or non-m6A site in the center.
In some cases, the m6A site locates at the beginning or end of the sequence, which results in that the extracted sequence fragments size is shorter than the given window size. Two strategies are often used to generate fixed window length. The first one is to fill the blank by using the dummy ‘X’ nucleotide that don’t represent any real nucleotide. The second one is to fill the blank using the mirror image method. If the missing nucleotides locate at the beginning (i.e. upstream of the m6A site), they will be filled by using their mirror images locate at downstream of the m6A site, and vice versa (Figure 1). The second approach has been used to construct the benchmark dataset for the prediction of m6A sites in S. cerevisiae.

Figure 1: A schematic illustration showing the mirror image for (a) upstream (b) downstream missing nucleotides, respectively. The real RNA segment is colored in blue and its mirror image is colored in red. The methylated A is highlighted in green.
In 2016, Chen built another benchmark dataset (called S2 here) using the mirror image method, which includes 1,307 m6A site containing sequences (positive samples) and the equal number of non-m6A containing sequences (negative samples). In dataset S2, all the experimentally confirmed m6A sites in S. cerevisiae were included. The sequences in this dataset are 51-nt long with the sequence similarity less than 85%, with the m6A site or non-m6A site in the center. Since it has been built, nearly all the computational models for identifying m6A site in S. cerevisiae were trained and tested on the dataset S2 [54].
Formulation of rna samples
The 2nd step of the 5-step rules [5] is about the formulation of biological samples. With the explosive growth of biological sequences in the post-genomic era, one of the most important but also most difficult problems in computational biology is how to express a biological sequence with a discrete model or a vector, yet still keep considerable sequence-order information or key pattern characteristic. This is because all the existing machinelearning algorithms (such as “Covariance Discriminant” or “CD” algorithm [9,10], “Nearest Neighbor” or “NN” algorithm [11,12], “Support Vector Machine” or “SVM” algorithm [13,14], and “Random Forest” or “RF” algorithm [15,16]) can only handle vectors as elaborated in a comprehensive review [17]. However, a vector defined in a discrete model may completely lose all the sequence-pattern information. To avoid completely losing the sequence-pattern information for proteins, the pseudo amino acid composition [18] or PseAAC [19] was proposed. Ever since the concept of Chou’s PseAAC was proposed, it has been widely used in nearly all the areas of computational proteomics (see example, [20-45] as well as a long list of references cited in [46]).
Because it has been widely and increasingly used, four powerful open access soft-wares, called ‘PseAAC’ [47], ‘PseAAC-Builder’ [48], ‘propy’ [49], and ‘PseAAC-General’ [50], were established: the former three are for generating various modes of Chou’s special PseAAC [51]; while the 4th one for those of Chou’s general PseAAC [5], including not only all the special modes of feature vectors for proteins but also the higher level feature vectors such as “Functional Domain” mode (see equations..9-10 of [5]), “Gene Ontology” mode (see Equations 11-12 of [5]), and “Sequential Evolution” or “PSSM” mode (see equations13-14 of [5]). Encouraged by the successes of using PseAAC to deal with protein/peptide sequences, the idea of PseAAC was extended to PseKNC (Pseudo K-tuple Nucleotide Composition) to generate various feature vectors for DNA/RNA sequences [52] that have proved very successful as well [25,41,43,44,53-60]. Particularly, recently a very powerful web-server called ‘Pse-in-One’ [61] and its updated version ‘Pse-in-One2.0’ [62] have been established that can be used to generate any desired feature vectors for protein/peptide and DNA/RNA sequences according to the users’ need or their own definition.” According to the concept of pseudo components, any RNA sequence sample can be formulated as [53].

where
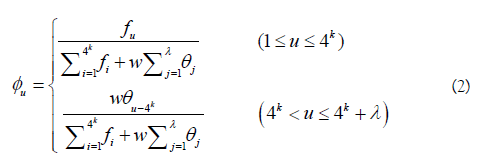
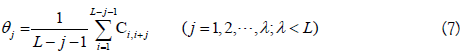
In Eq.2, fu (u = 1,2,..., 4k) is the normalized occurrence frequency of the u-th non-overlapping k-tuple nucleotide in the RNA sequence. λ is the number of the total pseudo components used to reflect the long-range or global sequence effect, and w is the weight factor. θ is the j-th tier correlation factor that reflects the sequence order correlation between all the j-th most contiguous k-tuple nucleotide along a L-nt long RNA sequence as formulated by
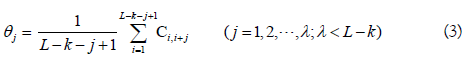
where Ci,i+jis the correlation function and is defined by
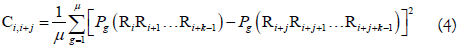
where μ is the number of RNA physicochemical properties considered, Pg (RiRi+1...Ri+k-1) is the numerical value of the g-th (g=1, 2, 3, ..., u) RNA local structural property for the k-tuple nucleotide RiRi+1...Ri+k-1 at position i and Pg (Ri+jRi+j+1...Ri+j+k-1) the corresponding value for the dinucleotide RiRi+j+1...Ri+j+k-1 at position i + j. The details about PseKNC can be found in our recent review article [53].
Algorithm or operation engine
The 3rd step of the 5-step rules [5] is about the operation engine. The two commonly used machine learning algorithms for identifying m6A sites are support vector machine (SVM) and random forest (RF), which were briefly introduced as following.
Support vector machine (SVM)
SVM is a powerful and popular method for pattern recognition, which has been widely used in the realm of bioinformatics especially very effectively in a series of recent genome analyses (see example [63-65]). Its basic idea is to transform the input data into a high dimensional feature space and then determine the optimal separating hyperplane. Owing to its effectiveness and speed in training process, the radial basis kernel function (RBF) of SVM was often used to obtain the classification hyperplane. The regularization parameter C and kernel parameter γ of the SVM operation engine can be optimized in the following ranges [2-5, 215] and [2-15, 2-5] with the steps of 2 and 2-1, respectively. For a brief formulation of SVM and how it works, see the papers [66,67]. For more details about SVM, see a monograph [68].
Random forest (RF)
RF is an ensemble of a large number of decision trees. Each tree in the ensemble is trained on a subset of training instances and gives a classification result. The three parameters of RF, namely the number of trees, the number of features randomly selected, and the minimum number of samples required to split an internal node (nsplit) can be determined by using the grid search scheme. The predictive results of RF are based on the ensemble of those decision trees. Since proposed by Breiman in 2001 [69], owing to its advantages in dealing with high-dimensional data, RF has been used in many areas of bioinformatics (see example, [15,16,56,70-83]).
Performance evaluation
The 4th guideline of the 5-step rules [5] is about how to validate the proposed model. To address this, two issues are need to considered. One is what kind of metrics should be used to measure the scores, and the other is what test methods should be adopted to count the scores.
A set of intuitive metrics
The performance of the computational methods are usually evaluated using the following four metrics [84]: (1) overall accuracy or Acc, (2) Mathew’s correlation coefficient or MCC, (3) sensitivity or Sn, and (4) specificity or Sp. However, the conventional metrics copied from math books are hard to be understood by most experimental scientists due to lacking intuitiveness; especially for the MCC, which is very important to indicate the stability of a predictor. Fortunately, using the symbols introduced by Chou [85] in studying signal peptide cleavage sites, a set of four intuitive metrics were derived [14,86], as given below

where N+ represents the total number of positive samples investigated, while N+- is the number of positive samples incorrectly predicted to be of negative one; N- the total number of negative samples investigated, while N-+ the number of the negative samples incorrectly predicted to be of positive one. The set of intuitive metrics have been concurred and applauded by a series of recent publications (see example, [14,16,57-59,74,82,83,87-100,101-114]). It is instructive point out, however, either the conventional metrics [84] taken from math books or the intuitive metrics of Equation 5 are valid only for single label systems (where each of the constituent samples belong to one, and only one, attribute or class); for the multi-label systems (where a sample may simultaneously belong to several different attributes or classes) whose existence has become more frequent in system biology [6,7,29,115-134], system medicine [135,136] and biomedicine [78,137], a completely different set of metrics as defined in [138] is absolutely needed.
Jackknife test
In statistical prediction, the following three cross-validation methods are often used to evaluate the performance of a predictor: independent dataset test, subsampling (or K-fold cross-validation) test, and jackknife test [139]. Among them, however, the jackknife test was deemed the least arbitrary that can always yield a unique result for a given benchmark dataset, as elucidated in [5] and demonstrated by Equations 28-32 therein. Therefore, the jackknife test has been increasingly recognized and widely adopted by investigators to test the power of various prediction methods (see example, [140-146]). In view of this, the jackknife test was also adopted to evaluate the computational methods in identifying m6A sites.
Web servers for detecting m6a sites
The last but not least important step of the Chou’s 5-step rules [5] is about the web-server establishment. As pointed out in [147] and demonstrated in a series of recent publications (see example [55, 57-59,81,89,97,102,104,121-127,135,148-160]), user-friendly and publicly accessible web-servers represent the future direction for developing practically more useful prediction methods and computational tools. Actually, many practically useful webservers have significantly increased the impacts of bioinformatics on medical science [17], driving medicinal chemistry into an unprecedented revolution [46].
Computational methods for detecting m6a sites
Over the past several years, nine different computational methods were proposed to identify m6A sites in the S. cerevisiae transcriptome. For clarity, their names and web server addresses (if available) are listed in Table 1 according to the chronological order. Show in Figure 2 is the corresponding flowchart.
| Methods | Sn (%) | Sp (%) | Acc (%) | MCC |
|---|---|---|---|---|
| iRNA-Methyl | 19.25 | 80.75 | 50 | 0 |
| RAM-ESVM | 18.83 | 68.62 | 43.72 | -0.14 |
| RNA-MethylPred | 27.2 | 74.06 | 50.63 | 0.01 |
| RAM-NPPS | 28.87 | 71.55 | 50.21 | 0 |
| DeepM6APred | 48.54 | 70.29 | 59.41 | 0.19 |
Table 1: List of computational methods for identifying m6A sites in S. cerevisiae.

Figure 2: The general framework of computational method for identifying m6A sites. The widely used feature extraction strategies and machine learning classifiers were shown in this figure.
Using graphic approaches to study biological and medical systems can provide an intuitive vision and useful insights for helping analyze complicated relations therein, as indicated by many previous studies on a series of important biological topics, (see example [161-174], particularly in enzyme kinetics and protein folding rates [169,175-177] as well as low-frequency internal motion [178,183].
Below, we are to make a comparison among the nine different prediction methods via their flowcharts as well.
m6Apred
Inspired by Schwartz’s pioneer work, a support vector machine (SVM) based method called m6Apred was proposed by Chen, which encodes RNA sequences by using both accumulated nucleotide frequency and nucleotide chemical properties (i.e. chemical structure, chemical binding and chemical functionality).
Compared with the classic nucleotide composition, the accumulated nucleotide frequency includes not only the nucleotide frequency information, but also the distribution of each nucleotide in the RNA sequence. The three kinds of nucleotide chemical properties have different impacts on RNA’s low-frequency internal motion and its biological function.
Accordingly, each nucleotide in the sequence was represented by a 4-dimenstional vector, in which the first element is the accumulated nucleotide frequency and the remaining three elements correspond to the nucleotide chemical properties. For the sequence with a length of L (where L=21), it can be represented by a 4L-dimenstional vector and used as the input of SVM. The proposed m6Apred obtained a satisfactory performance for identifying m6A site in the S. cerevisiae transcriptome based on dataset S1.
iRNA-Methyl
It was found that the formation of m6A methylation is affected by RNA secondary structure that is highly related with the physicochemical properties of dinucleotide. In view of this, a predictor called “iRNA-Methyl” was proposed by formulating RNA sequences with the pseudo nucleotide composition (PseKNC). By using PseDNC (i.e. k=2 in Equation 2), three physicochemical properties, namely enthalpy, entropy, and free energy that can quantify the RNA secondary structures were used to calculate the long-range sequence order effects using the following formula:
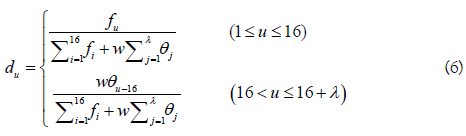
where fu (u = 1,2,..., 16) is the normalized occurrence frequency of the u-th non-overlapping dinucleotide in the RNA sequence, and
where θj is called the j-tier correlation factor that reflects the sequence order correlation between all the j-th most contiguous dinucleotide, the coupling factor Ci,i+j is given by

where Pg(Di) (g=1, 2, 3) is the normalized value of the above mentioned three RNA physicochemical properties for the i-th dinucleotide Di. By using the 10-fold cross validation test, the optimal values for the parameters λ and w of PseKNC were obtained (i.e. λ=6 and w=0.9). Accordingly, the samples in dataset S2 were transferred into a 22-dimensional vector in the iRNA-Methyl method. It was found that iRNA-Methyl obtained an accuracy of 65.59% for identifying m6A sites in the rigorous jackknife test. For the convenience of experimental scientists, a web-server for iRNA-Methyl has been established at http://lin-group.cn/server/iRNA-Methyl.
pRNAm-PC
In 2016, in order to improve the accuracy of m6A site identification, Liu proposed the pRNAm-PC method, in which the RNA sequences in dataset S2 were encoded by using a vector, whose components were derived from a physical-chemical matrix via the auto-covariance and cross-covariance transformations [55].
Based on the dinucleotide physicochemical properties, a 10×50 dimensional physicochemical property matrix (PC) was defined as following,
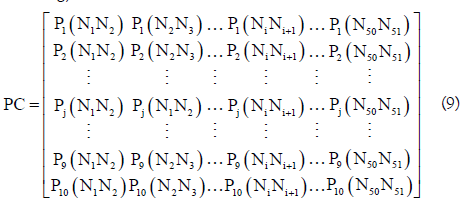
where Pj(NiNi+1) is the j-th (j=1, 2, ..., 10) physicochemical properties value for the dinucleotide NiNi+1 (namely AA, AC, AG, AU, CA, ..., or UU) in the RNA sequence. In the pRNAm-PC method, 10 dinucleotide physicochemical properties (i.e. P1: rise, P2: roll, P3: shift, P4: slide, P5: tilt, P6: twist, P7: enthalpy, P8: entropy, P9: stack energy, and P10: free energy) were used.
In order to reflect the correlation of the same and different physicochemical property between two subsequences separated by λ dinucleotides, the auto-covariance (AC) and cross-covariance (CC) method were used to transform the physicochemical property matrix into a length-fixed feature vector and were defined as following.
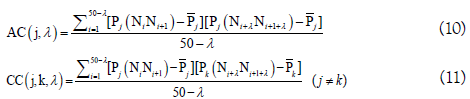
By preliminary tests, they found that the best value for λ is 4. Therefore, the RNA sequences in dataset S2 were encoded by a 400-dimensional vector, of which the 40 elements were deduced from the auto-covariance and the 360 elements from the crosscovariance. Based on this kind of feature, the pRNAm-PC was built and yielded an accuracy of 69.74% for identifying the m6A sites in dataset S2 in the jackknife test, which is ~5% higher than that of iRNA-Methyl. However, the feature dimension of pRNAm-PC was nearly 26 times larger than that of iRNA-Methyl. Moreover, the contributions and biological meanings of the above mentioned 10 physicochemical properties for identifying m6A sites were not described at all.
SRAMP
Subsequently, by combining multiple features, Zhou and his colleagues established a random forest based computational predictor, called SRAMP, which is available at http://www.cuilab. cn/sramp/. In order to capture more sequence-derived features, the positional nucleotide sequence pattern, K-nearest neighbor information, the position independent nucleotide pair spectrum, and the predicted RNA secondary structure were used to encode the RNA sequences.
For the positional nucleotide sequence pattern, the nucleotide (A,C,G or U) at each position were represented by the binary vector of (1,0,0,0), (0,1,0,0), (0,0,1,0), or (0,0,0,1). For a 2n+1 long sequence segment, a 4×(2n+1) dimensional vector can be obtained.
In order to measure the extent of how much the flanking window of one query sample resembles those of other m6A sites, the K-nearest neighbor information was introduced. Firstly, the flanking window of the query sample was compared with all samples in the training dataset and obtained a pair-wise similarity score,

where qi and ri are the nucleotides at the i-th position of the flanking windows in the query sample and the training samples. 2n + 1 is the window size. The NUC44 is a common nucleotide similarity scoring matrix. And then, the fraction of positive samples in the top K most similar reference samples was taken as the KNN feature. In SRAMP, 30 K values were used (i.e., K=50, 100, 150, …, 1500).
The sequence context was also reflected by calculating the frequencies of all possible d-spaced nucleotide pairs, which is defined as

where C(npi) is the number of npi inside a flanking window with a size of 2n, d is the space between two nucleotides, and ranged from 0 to 3.
As indicated in their work, the hairpin loop, multiple loop, interior loop, paired and bulged loop from the RNA secondary structure were also used to represent RNA sequences, which were encoded as the binary vectors, namely (1,0,0,0,0), (0,1,0,0,0), (0,0,1,0,0), (0,0,0,1,0), (0,0,0,0,1) and (0,0,0,0,0), respectively. Accordingly, in the structure space, a flanking window with a size of 2n will be converted into a 2n×5-dimensional vector.
For each kind of these features, a random forest classifier was built. The final prediction result was the combination of them by using the weighted summing scheme. As indicated by, SRAMP yielded comparable accuracy for identifying m6A sites in the S. cerevisiae transcriptome to that of iRNA-Methyl. As a big plus, SRAMP can not only identify m6A sites in S. cerevisiae, but also much more effective for identifying mammalian m6A sites.
M6A-HPCS
Later on, with the aim of finding out which physicochemical properties making great contributions for identifying m6A sites, Zhang proposed a heuristic nucleotide physicochemical property selection algorithm, called M6A-HPCS, to identify m6A sites in the S. cerevisiae transcriptome [99]. The M6A-HPCS method is based on the iRNA-Methyl and pRNAm-PC methods. However, rather than directly using the physicochemical properties, the relative gain and direct gain methods were used to measure the significance of each of the 23 dinucleotide physicochemical properties for identifying the m6A sites. And then, a heuristic algorithm is employed to select the optimal physicochemical properties for the PseKNC (used in iRNA-Methyl) and auto-covariance and cross-covariance (used in pRNAm-PC) encoding schemes, respectively.
For the PseKNC and auto-covariance and cross-covariance encoding scheme, 5 and 13 out of the 23 dinucleotide physicochemical properties were selected out as their optimal candidates to represent the RNA sequences in dataset S2, respectively. In the rigorous jackknife test, the accuracies of 67.33% and 72.38% were obtained for identifying m6A sites for both encoding schemes, respectively. Although its predictive accuracy is higher than those of iRNA-Methyl and pRNAm-PC, the shortcomings for M6A-HPCS still exist in the following aspects. First, the biological meanings of using the optimal dinucleotide physicochemical properties are not described at all. Second, although a web-server was developed for M6A-HPCS at http://csbio.njust.edu.cn/bioinf/M6A-HPCS, it couldn’t be accessed anymore.
RNA-MethylPred
To further improve the accuracy of m6A site identification, Jia proposed a new computational method called RNA-MethylPred. In this method, three kinds of feature extraction strategies were used to represent the RNA sequences in dataset S2 [16].
Bi-profile bayes vector (V) was employed to reflect the posterior probability of positive and negative samples.

where the first n components denotes the posterior probability of each nucleotide at the i-th position in the positive samples, the remaining n components denotes the posterior probability of each nucleotide at the i-th position in the negative samples. n is equal to the length of the RNA sequence (i.e. n=51).
Two forms of dinucleotide composition were defined to reflect sequence order information.
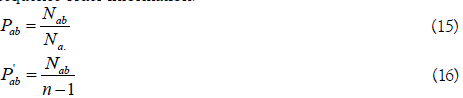
where Nab is the number of neighboring dinucleotide (a, b can be nucleotide A, C, G or U), a • indicates any adjoining dinucleotides that starting with a.
K nearest neighbor (KNN) scores were used to measure whether the local sequence similarity. To this end, similarity score S(A,B) between two sequence fragments A and B was defined as
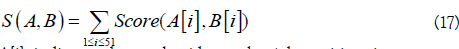
A[i] indicates the nucleotide at the i-th position in sequence segment A, and the score of two nucleotides was defined as
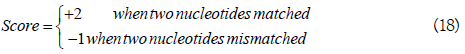
Based on Equations. (11) and (12), the KNN score was achieved by calculating the percentage of the positive neighbors in its KNNs. In RNA-MethylPred, the 20 considered Ks were 10, 20, ..., 200.
Finally, these features were combined together and used as the input of SVM to perform the prediction. In the jackknife test, the RNA-MethylPred obtained an accuracy of 76.51% for identifying m6A sites in the S. cerevisiae transcriptome. Rather than building a web-server, the authors provided a MATLBA package for the RNAMethylPred method.
RAM-ESVM
As introduced above, various features and predictors have been proposed for identifying m6A sites. However, their performances are still not satisfactory. In 2017, Chen developed an ensemble classifier called RAM-ESVM, which combines three basic classifiers based on different features including PseKNC, motif features, and optimized K-mer [57]. The first two classifiers (SVM-PseKNC and SVM-motif) were built based on SVM by using PseKNC and motif features as the inputs, respectively. The third one is also a SVM based classifier and its input features are optimized gapped k-mers, which is achieved by using the GkmSVM software. The three basic classifiers vote for the final result based on the voting score.
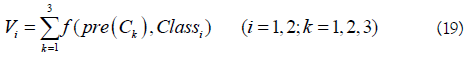
where Vi is the voting score for the RNA sample belonging to the classi (i=1: m6A sites; i=2: non- m6A sites), and
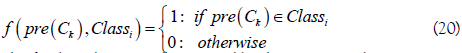
The final prediction is determined by the argument that maximizes the voting score Vi,

In the jackknife test, the RAM-ESVM produced an accuracy of 78.35% for identifying m6A sites in the S. cerevisiae transcriptome. The RAM-ESVM can be freely accessed at http://server.malab.cn/ RAM-ESVM/.
RAM-NPPS
In 2017, another m6A site predictor, called RAM-NPPS, was proposed by Xing, which is based on multi-interval nucleotide pair position specificity (NPPS).
For a given RNA sequence segment P, it can be represented by P=P+-P-. P+ and P- can be formulated as

To obtain pξk, single nucleotide position matrix Tξs and dinucleotide position matrix Tξd are defined as following
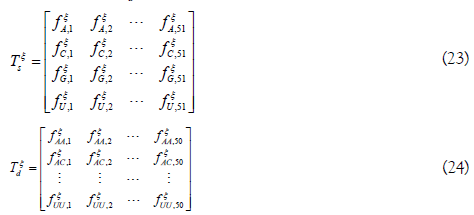
The elements in the two matrices indicate the occurrence probability of the nucleotide in each position and the occurrence probability of the nucleotide pair at position i and i+η, respectively.
Suppose the dinucleotide between the i-th nucleotide and (i+η)-th nucleotide is ‘ab’, pξk can be calculated according to the conditional probability,
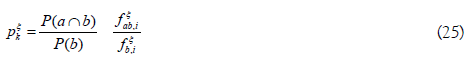
Accordingly, the RNA sequence can be converted into the feature vector as described in Eq. 18. When the optimal interval value of the two nucleotides is set as η=5, the SVM based computational model RAM-NPPS was built, which is available at http://server. malab.cn/RAM-NPPS/. In the jackknife test, RAM-NPPS yielded an accuracy of 79.92% for identifying m6A sites in the S. cerevisiae transcriptome.
DeepM6APred
More recently, Wei proposed a new method called DeepM6APred, which represented the RNA samples by using both the above mentioned NPPS feature and binary string encoding scheme [63]. Different from traditional methods, before directly using these features to make predictions, the deep-belief network was used to automatically learn meaningful feature representations from raw input sequences. Finally, an optimal feature set containing 429 features was obtained, based on which a predictive accuracy of 80.50% was obtained for identifying m6A sites in the S. cerevisiae transcriptome. To the best of our knowledge, this is the best accuracy for identifying m6A sites in the S. cerevisiae transcriptome till now. The DeepM6APred can be accessed at http://server. malab.cn/DeepM6APred.
Comparison of various prediction methods
In this section, we performed a comparison on existing methods for identifying m6A sites in the S. cerevisiae transcriptome. Since SRAMP is a mammalian specific predictor and m6Apred is trained based on dataset S1, for a fair comparison, they were not considered here. The predictive accuracies of the other 7 methods for identifying m6A sites based on the benchmark dataset S2 were shown in Figure 3. It was found the performance of DeepM6APred ranks the top.

Figure 3: The performance of different methods for identifying m6A sites in the benchmark dataset S2.
To further demonstrate the generalization ability of these methods, an independent dataset was built, which includes 239 m6A site containing sequences obtained from the RMBase, and the same number of non-m6A site containing sequences. All these sequences are 51 nt and independent from the samples in the dataset S2, which are available at https://github.com/chenweiimu/m6a.
It should be point out that the web-server of M6A-HPCS is not accessible anymore as indicated in its homepage, and the pRNAm- PC could not make predictions for these independent sequences. Therefore, the comparisons were performed among the remaining methods (i.e. iRNA-Methyl, RAM-ESVM, RNA-MethylPred, RAMNPPS, and DeepM6APred). Their predictive results for identifying m6A sites in the independent dataset were reported in Table 2. It was found that the Sn, Acc and MCC of DeepM6APred are much higher than the other four methods. Although iRNA-Methyl obtained a high Sp, it has lower Sn, Acc and MCC. Thus, we can draw a conclusion that the performance of DeepM6APred is the best, while the performance of iRNA-Methyl is comparable to RNA-MethylPred and RAM-NPPS.
As demonstrated by many previous studies on a series of important biological topics (see example [161,162,166,168,170,173,180-182]), using image or graphic approaches to study biological systems can provide intuitive insights for helping analyze complicated relations therein, in view of this, the accurately predicted m6A sites by the different methods were presented in Figure 4. As we can see from the figure, of the 239 m6A site containing sequences, 116 were correctly identified by DeepM6APred, 69 by RAM-NPPS, 65 by RNA-MethylPred, 46 by iRNA-Methyl, and 45 by RAM-ESVM. These results indicate that for users who are interested in identifying m6A sites in the S. cerevisiae transcriptome, the DeepM6APred predictor should be their first choice, and the other predictors, namely RAM-NPPS, RNA-MethylPred, iRNA-Methyl and RAMESVM, may used as complementary tools in this regard.

Figure 4: The detail predictive results of DeepM6APred, RAM-NPPS, iRNA-Methyl, RAM-ESVM and RNA-MethylPred based on the independent dataset. Each row is a sample in the independent dataset. The correctly identified m6A site containing samples were highlighted in red, and the counterparts were in blue.
Key Points
It is an urgent task to develop effective computational approaches for detecting m6A and other RNA modifications in the transcriptome.
The computational approaches for identifying m6A sites in the S. cerevisiae transcriptome are introduced and discussed.
To help biologists choose appropriate methods for identifying m6A sites, a comprehensive comparison on existing methods was performed on the independent dataset.
The challenges and future directions for identifying RNA modifications were discussed.
Remarks and perspective
In this paper, we comprehensively reviewed the computational methods for identifying m6A sites in the S. cerevisiae transcriptome and evaluated their performance based on the independent dataset. Although these methods obtained quite good results in identifying m6A sites when tested by the benchmark dataset S2 of Section 2, their exploited or extrapolative effectiveness in practical application [139] was not so ideal as reflected by the fact when tested by the independent dataset.
The poor performance of these methods on the independent dataset is due to the following reason. All these methods were trained based on dataset S2, in which both positive and negative samples were obtained by selecting the sequences containing RGAC consensus motif. However, in most cases, the m6A site may not locate in the RGAC consensus motif. Thus, the construction of the benchmark dataset in such a way precluded the generalization ability of these methods. In order to improve the performance and generalization ability of the computational methods for identifying m6A sites, much more efforts should be made by considering the following aspects.
The performance is dependent on the benchmark dataset
Although several benchmark datasets have been established for training computational models for identifying m6A sites, the challenges still exist in the construction of the benchmark dataset.
Compared with the positive samples, there is no uniform standard to collect negative samples (non-m6A samples). The popular strategy of obtaining non-m6A samples is to select the adenosines that are not experimentally annotated as being methylated. It indeed raises the possibility that the m6A sites are not identified may serve as false negative samples. In addition, in the real case, the number of non-m6A sites is significantly higher than that of m6A sites. The existing benchmark datasets are all balanced ones that contain roughly equal number of m6A samples and the randomly selected non-m6A sample. Such randomly sampling of non-m6A samples may lead to inadequate learning and the models trained on such a dataset would change when the selected non-m6A samples are different. To solve these challenges, more efforts can be made in the following aspects.
First, the one-sided selection (OSS) undersampling and synthetic minority oversampling technique (SMOTE) can be used to balance the non-m6A and m6A samples and minimize the influences of imbalance issue. The one-sided selection (OSS) undersampling employed the condensed nearest-neighbor to remove redundant negative samples that are far from the boundary of the class and the Tomek links to eliminate borderline samples and samples suffering from class label noise. By doing so, the number of non-m6A samples can be decreased. On the other hand, the SMOTE will resample the small class (m6A samples) by taking each small class example and introducing synthetic examples along the line segments joining it to the small class nearest neighbors. Accordingly, the positive and negative samples will be balanced.
The second way to deal with such an imbalance problem is to use ensemble techniques, which trains basic classifiers with different sampling data and combines their results to reduce the random sampling bias. The key step of this technique is to select meaningful negative samples to train basic classifiers.
Another strategy is to use cost-sensitive classifiers, such as XGboost (eXtreme Gradient Boosting), which can be trained with all the samples without selecting a subset of negative samples and prevent training model from over-fitting by defining different costs for the misclassified positive and negative samples.
Encode RNA sequences using effective schemes
Feature extraction strategy is another essential step to build computational models for identifying m6A sites. The performance of existing models for identifying m6A sites depends on how to accurately represent RNA sequences. The encoding schemes are based on the experiences and usually derived from the segments surrounding the m6A sites, such as pseudo nucleotide compositions, physicochemical properties, position specific nucleotide/ dinucleotide composition, and so on. Although considerable progresses have been achieved, the following aspects should be considered for designing distinguishable feature descriptors in the future work.
Except for Schwartz’s and Zhou’s works, none of the other existing computational methods represented the RNA samples using RNA secondary structure information [55]. By regulating the interaction of methyltransferase complex with RNA sequences, RNA secondary structure is closely related to the formation of m6A. Therefore, it is necessary to integrate this kind of feature when constructing more powerful computational models for identifying m6A sites. To this end, the RNAfold tool in ViennaRNA package can be used to predict RNA secondary structure, whose output is dots (indicate unpaired nucleotides) and brackets (indicate paired nucleotides). If encode unpaired nucleotides using 0 and the paired one using 1, a given RNA sample will be transferred into a feature vector with its elements are 0 and 1.
Another shortcoming of existing methods is that existing computational methods directly use the entire features, which may lead to over-fitting problems, reduce the generalization capacity of the model and increase the computational time. In order to alleviate irrelevant features and overcome the above mentioned shortcoming, the feature selection techniques, such as minimal redundancy maximal relevance (mRMR), maximum relevancy maximum distance (MRMD), and analysis of variance (ANOVA), can be used to winnow out the optimal features.
Generalizability of existing computational approaches
Compared with the performance for identifying m6A sites in other species, the accuracy for identifying m6A sites in the S. cerevisiae transcriptome is still far from satisfactory. Therefore, new computational models are still required. Besides support vector machine and random forest, other machine learning methods such as Native Bayes, Logistic Regression, and K-nearest neighbor are all potential candidates to build new computational models for identifying m6A sites. With the development of convolutional neural network and deep learning, these advantaged approaches are also suggested to be used in developing computational models. In addition, since most of the existing methods are complementary to each other (Figure 4), it’s wise to employ the ensemble classification techniques to develop computational models with high performance.
Besides m6A, the pseudouridine, N1-Methyladenosine (m1A), and 5-methylcytosine (m5C) are also frequently observed RNA modifications. However, both the computational models and experimental techniques couldn’t simultaneously identify these different types of RNA modifications. To address such a challenge, more efforts should be made to develop a platform that can be used to simultaneously detect different types of RNA modifications.
The authors thank Dr Cangzhi Jia for her assistance in running the RNA-MethylPred program.
This work was supported by the National Nature Scientific Foundation of China (31771471, 61772119), Natural Science Foundation for Distinguished Young Scholar of Hebei Province (No. C2017209244).
Citation: Chou KC (2020) Recent Progresses for Computationally Identifying N6-methyladenosine Sites in Saccharomyces cerevisiae. Immunome Res. 16:6982.
Received: 26-Oct-2020 Accepted: 09-Nov-2020 Published: 16-Nov-2020 , DOI: 10.35248/1745-7580.20.16.6982
Copyright: © 2020 Chou KC. This is an open-access article distributed under the terms of the Creative Commons Attribution License, which permits unrestricted use, distribution, and reproduction in any medium, provided the original author and source are credited.
Sources of funding : This work was supported by the National Nature Scientific Foundation of China (31771471, 61772119), Natural Science Foundation for Distinguished Young Scholar of Hebei Province (No. C2017209244).