Journal of Clinical Trials
Open Access
ISSN: 2167-0870
ISSN: 2167-0870
Review Article - (2016) Volume 6, Issue 2
Questionnaires in different languages have expanded research into new dimensions by performing studies in variety of cultural groups and validating these questionnaires in those respective languages have ensured more precise and accurate information about the particular population. Questionnaire should always have a definite purpose that is related to the objectives of the research. To develop a questionnaire, various factors such as question sequence, layout, content, response structure & wordings are to be formed. On forming a questionnaire, pretest or pilot validation is performed, which is followed by translation into the local vernacular language of the target population to administer it to the local group of patients, because all the patients are not aware of the original language of the Questionnaire in which it formed. It is desired to be validated in that particular language by the most appropriate validation procedure for each questionnaires, because there will be chance of particular word having similar meaning in different languages which can change the interpretation of the question.
Validation of questionnaire have important implications to develop research methodology for the evaluation of the specific disorders and the validity of the research outcomes and thus it is important for clinicians/researchers who wish to use questionnaires as a research tool. Once the validation of a questionnaire is successful into the desired language, the questionnaire will be more acceptable by the society and Physician, which can provide more accurate diagnostic result.
Keywords: Questionnaires, Languages, Validation, Physician, Clinicians
A questionnaire is simply a ‘tool’ for collecting and recording information about a particular issue of interest. It is mainly made up of a list of questions, but should also include clear instructions and space for answers or administrative details. Questionnaires should always have a definite purpose that is related to the objectives of the research, and it needs to be clear from the outset how the findings will be used.
Questionnaires have many merits and demerits which go side by side. They are relatively economical and a large population can be studied but their response rates can be low. It is easy to reach people who are spread across wide geographical area and respondents are able to complete the questionnaires in their own time [1].
Questionnaire Design
In order to gather useful and relevant information, it is essential that careful consideration is given to the design of your questionnaire. A well-designed questionnaire requires thought and effort, and needs to be planned and developed in a number of stages (Figure 1).
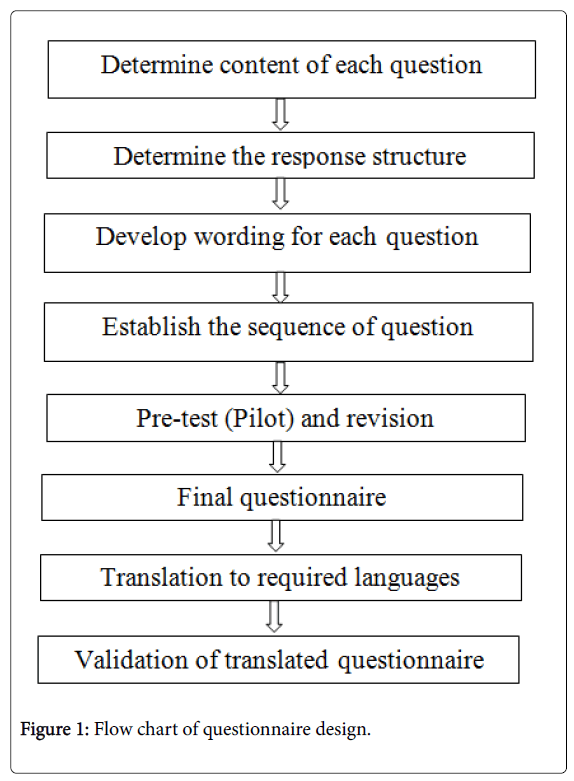
Figure 1: Flow chart of questionnaire design.
Questions should be numbered and ordered in a manner that is logical to the respondent, generally using ‘Funneling’ technique that begins with simple questions to put respondents at ease and then focusing down to more specific questions [2].
The use of questionnaires as a method of data collection in healthcare research both nationally and internationally has increased in recent years [3,4].
When developing a questionnaire, items or questions are generated that require the respondent to respond to a series of questions or statements. Participant responses are then converted into numerical form and statistically analyzed [5].
Determining the response structure to each question
There are two different types of responses: opened-ended and closed-ended.
In an opened-ended question, the respondent is required to come up with an answer himself. The advantages of these types of responses are that they are good for gaining insightful data and avoid creating biased answers. Some disadvantages are that respondents may not know how much to write or how long to spend on the answer and analyzing opened-ended questions can be a daunting task.
Closed-ended questions provide the respondent with several choices. They may be multiple choice, matching, or in some other format. These types of questions provide more structure, which makes them much easier to analyze and interpret. However, the answers that are given may create bias, as respondents may select a response that they wouldn't normally think of [6].
Establish the sequence of questions
Typically, the first part of the questionnaire should contain the easier questions that help to gain the respondents' cooperation. The middle series of questions contains the most important topics. Demographic and other classification questions should appear at the end of the questionnaire.
It has been named after its developer, Rensis Likert. The Likert scale is one of the most widely used itemized scales. The end-points of a Likert scale are typically “strongly disagree” and “strongly agree.” The respondents are asked to indicate their degree of agreement by checking one of five response categories [7-9].
The data are typically treated as interval scale. When using this approach to determine the total score for each respondent on each store, it is important to use a consistent scoring procedure so that a high (or low) score consistently reflects a favorable response. This requires that the categories assigned to the negative statements by the respondents be scored by reversing the scale. Note that for a negative statement, an agreement reflects an unfavorable response, whereas for a positive statement, agreement represents a favorable response. Accordingly, a “strongly agree” response to a favorable statement and a “strongly disagree” response to an unfavorable statement would both receive scores of five.
The Likert scale has several advantages. It is easy for the researcher to construct and administer this scale, and it is easy for the respondent to understand. Several variants of the Likert scale are commonly used in marketing that vary the number of scale points (for example, 7 or 9 points) as well as the descriptors (for example, importance, and familiarity) and other characteristics. The major disadvantage of the Likert scale is that it takes longer to complete than other itemized rating scales. Respondents have to read the entire statement rather than a short phrase [9].
Likert scale decisions
The researcher must make four major decisions when constructing Likert type of scales.
Number of scale categories
Two conflicting considerations are involved in deciding the number of scale categories. The greater the number of scale categories, the finer the discrimination among stimulus objects that is possible. On the other hand, most respondents cannot handle more than a few categories.
Balanced versus unbalanced scales
In a balanced scale, the number of favorable and unfavorable categories is equal; in an unbalanced scale, the number is unequal. In general, the scale should be balanced in order to obtain objective data. However, if the distribution of responses is likely to be skewed, either positively or negatively, an unbalanced scale with more categories in the direction of skewness may be appropriate.
Odd or even number of categories
With an odd number of categories, the middle scale position is generally designated as neutral or impartial. The presence, position, and labeling of a neutral category can have a significant influence on the response. The Likert scale is a balanced rating scale with an odd number of categories and a neutral point.
The decision to use an odd or even number of categories depends on whether some of the respondents may be neutral on the response being measured. If a neutral or indifferent response is possible from at least some of the respondents, an odd number of categories should be used [9].
Forced versus nonforced scales
On forced rating scales, the respondents are forced to express an opinion, because a “no opinion” option is not provided. In such a case, respondents without an opinion may mark the middle scale position. If a sufficient proportion of the respondents do not have opinions on the topic, marking the middle position will distort measures of central tendency and variance. In situations where the respondents are expected to have no opinion, as opposed to simply being reluctant to disclose it, the accuracy of data may be improved by a nonforced scale that includes a “no opinion” category.
Pretest (Pilot) validation
Pilot testing the questionnaires on representatives of the population to which it is going to be administered is another essential component of the process of questionnaire development.
Data entry and decoding are recommended components of pilot testing as this allows troubleshooting of possible problems in data management and analysis [10].
The items rated for pilot testing were; (1) Usability (2) Ease of Administration (3) Comprehensiveness (4) Format. And average scores based from a scale of 1 (lowest)-5 (Highest) [11].
Translation of questionnaire
Initially two different translators who can speak both original and desired language, but whose native tongue is the desired language, will translate the items to the desired language. Next four medical specialists should discuss the differences in the two translations and determine one complete translation. Then, in the back translation stage, two new translators, who have neither worked in the medical field nor knew the purpose of the questionnaire translate the composite questionnaire back to original language,; and they could speak both original and desired language, but their native language was the original language. Next, the four medical specialists who had determined the composite translation discuss on the back translation and analyzed it for the appropriateness [12,13].
Need for validating a questionnaire
It is, at times, difficult to locate and obtain developed questionnaires due to lack of scientific incentives, lack of criteria for good quality questionnaire, lack of “Gold standard” questionnaires and ignorance of the importance of accurate measurements and lack of funds for the purpose of development and validation of questionnaire is also one of the contributory factors [14].
Validation of questionnaire has important implications for research methodology and the validity of the research outcomes and thus important for clinicians/epidemiologists who wish to use questionnaires as a research tool. Research outcome is directly dependent upon the quality and the completeness of the data used.
The need to translate a questionnaire is sometimes apparent from the outset if one or more targeted populations is known to need a different language from the one in which the questionnaire is/will be designed. Alternatively, the need for a translation may only become apparent at a later stage [15].
The greatest advantage of validating a questionnaire is that it reduces bias by detecting ambiguities and misinterpretations which can then be minimized. The instrument is compared with a “gold standard” questionnaire. As well as the acceptability, time needed to respond, cost etc. are pre-examined. This also examines the variation in response due to data inquiry methods (self-administered, personal interview, telephone interview etc.) Hence, better quality data will be collected, comparability will be high, efforts will be reduced and the credibility, quality and usefulness of information derived will be far superior.
When questionnaire is translated from one language to another then it is not assumable that the translated items are valid enough, even though the original questionnaire is valid, because the validity of any particular questionnaire is context specific and is not an abstract notion that transferred from one instrument to another. Meaning and intentions are part of what makes a questionnaire valid and it cannot be that easily translated from one to another. The cultural context of the second language is totally different so the meaning and intentions of the word would be understood differently. Hence, if any questionnaire is translated in to another language than it must be again subjected to further analyze and pilot studies are performed to confirm its validity anew.
In order to have confidence in the results of a study, one must be assured that the questionnaire consistently measures what it purports to measure when properly administered. In short, the questionnaire must be both valid and reliable [16].
Questionnaires can be designed to assess either broad or specific dimensions of health. Researchers acknowledge the role of general health measures while identifying their limitations in measuring the impact of specific diseases [17].
The most important consideration in the design and administration of a questionnaire is that it must be able to measure accurately what it is designed to measure. The ‘accuracy’ of the data obtained from a questionnaire, has two components: reliability and validity [18].
In psychometric testing, a reliable test is one which will produce consistent results when the same individual is tested on different occasions (often referred to as ‘test-retest’ reliability). When evaluating a test, reliability is generally measured before validity, since the reliability of a test places an upper limit on its validity- in other words, a test cannot measure what it purports to measure unless it is stable and consistent in its measurement [19].
Reliability
Reliability is defined as the extent to which a questionnaire, test, observation or any measurement procedure produces the same results on repeated trials. In short, it is the stability or consistency of scores over time or across raters.
There are three aspects of reliability, namely: Equivalence, Stability and Internal consistency (homogeneity) [20]. The first aspect, Equivalence, refers to the amount of agreement between two or more instruments that are administered at nearly the same point in time. Equivalence is measured through a parallel forms procedure in which alternative forms of same measures is administered to either same or different respondents at the same time or within some time delay. The higher the degree of correlation between the two forms, the more equivalent they are. Equivalence is demonstrated by assessing interrater reliability which refers to the consistency with which observers or raters make judgments.
The second aspect of reliability, Stability, is said to occur when the same or similar scores are obtained with repeated testing with the same group of respondents. In other words, the scores are consistent from one time to the next. Stability is assessed through a test-retest procedure that involves administering the same measurement instrument to the same individuals under the same conditions after some period of time. The reproducibility of the questionnaire varies with the type of information collected and the time interval of administration of the two questionnaires [21].
The third and last aspect of reliability is internal consistency (or homogeneity). Internal consistency concerns the extent to which items on the test or instrument are measuring the same thing. If the individual items are highly correlated with each other then it proves the high reliability of the entire scale. The appeal of an internal consistency index of reliability is that it is estimated after only one test administration and therefore avoids the problems associated with testing over multiple time periods. Internal consistency is estimated via the split-half reliability index, coefficient alpha index [22] or the Kuder-Richardson formula 20 (KR-20) indexes [23]. The split-half estimate entails dividing up the test into two parts (e.g., odd/even items or first half of the items/second half of the items), administering the two forms to the same group of individuals and correlating the responses. The split-half method cannot be used with heterogeneous questionnaires because division of the questionnaire will not yield "equivalent" forms. In this situation one may repeat questions throughout the questionnaire; only the original question is kept in the final form [24]. Coefficient alpha and KR-20 both represent the average of all possible split-half estimates. The difference between the two is when they would be used to assess reliability. ‘Reliability’, ‘consistency’ and ‘reproducibility’ are often used to mean the same thing when they are all different. Ideally, one would like a reproducible questionnaire instrument to give values that vary little under such circumstances. This reduces measurement variation (‘background noise’) and contributes to greater ‘precision’ in statistical estimates of the measure.
With questionnaires which measure conditions or states represented by categorical variables (e.g. ‘disease/ non-disease’, ‘mild/moderate/ severe’), reproducibility is most commonly and appropriately assessed using the Cohen’s kappa statistic [25]. The kappa measures the agreement above and beyond the amount of agreement which would be expected by chance alone. For continuous measures, the Pearson product moment correlation coefficient is often used, or the corresponding Spearman rank correlation coefficient for skewed data distribution. The Pearson correlation coefficient measures the strength of co-variability and not exact value agreement between two measurements [26,27].
Pearson correlation coefficient may be misleadingly high, even though there is a systematic bias between the two measurements. The intraclass correlation coefficient is often the preferred statistical index for the exact agreement between two measurement variables [28].
In order to have confidence in the results of a study, one must be assured that the questionnaire consistently measures what it purports to measure when properly administered. In short, the questionnaire must be both valid and reliable [29]. Questionnaires can be designed to assess either broad or specific dimensions of health. Researchers acknowledge the role of general health measures while identifying their limitations in measuring the impact of specific diseases [30].
Validation
Every person either have or does not have the disease can take the test. The test outcome can be positive (predicting that the person has the disease) or negative (predicting that the person does not have the disease). The test results for each subject may or may not match the subject's actual status. In that setting:
True positive: Sick people correctly diagnosed as sick
False positive: Healthy people incorrectly identified as sick
True negative: Healthy people correctly identified as healthy
False negative: Sick people incorrectly identified as healthy.
Only studies where the diagnoses were made by a structured or semi structured diagnostic interview were considered for sensitivity and specificity measures.
Sensitivity: Sensitivity relates to the test's ability to identify positive results.
Again, consider the example of the medical test used to identify a disease. The sensitivity of a test is the proportion of people who have the disease who test positive for it. This can also be written as:
Sensitivity=(number of true positives)/(number of true positives +number of false negatives)
Sensitivity=probability of the positive test given that the patient is ill.
If a test has high sensitivity then a negative result would suggest the absence of disease. For example, a sensitivity of 100% means that the test recognizes all actual positives-i.e. all sick people are recognized as being ill. Thus, in contrast to a high specificity test, negative results in a high sensitivity test are used to rule out the disease [31].
Specificity: Specificity relates to the ability of the test to identify negative results.
Consider the example of the medical test used to identify a disease. The specificity of a test is defined as the proportion of patients who do not have the disease who will test negative for it. This can also be written as:
Specificity=(number of true negatives)/(number of true negatives +number of false positives)
Specificity=probability of the negative test given that the patient is ill.
If a test has high specificity, a positive result from the test means a high probability of the presence of disease [32] (Tables 1 and 2).
| Has Condition | Does not have condition | ||
|---|---|---|---|
| Test Positive | A | B | Test Positive tests (A+B) |
| Test Negative | C | Does not have condition | Test Negative tests (C+D) |
| Number in sample with condition (A+C) | Number in sample without condition (B+D) | Total Number of Subjects (A+B+C+D) |
Table 1: Calculation table for the Specificity. Sensitivity=A/(A+C), Specificity=D/(B+D).
| S. No | Author | Questionnaire used | Translation | Parameters Used |
|---|---|---|---|---|
| 1 | Constantin R. S., Dimitris G. D., Thomas J.P.(2000) | Athens Insomnia Scale (AIS) | Greek | Cronbach alpha -0.90 Item total Correlation Coefficient- 0.70 |
| 2 | Vanessa R.F., Lucaine B.C., Fabiana R., Lucila B.F.(2008) | Sleep Disturbance Scale (SDSC) | Brazilian Portuguese | Cronbach alpha -0.78 Convergent Validity (Pearson correlation) Discriminate validity. |
| 3 | Sung-Goo Kang, Jin-Hee Shin (2010) | Penn State Worry Questionnaire (PSWQ) | Korean | Cronbach alpha- 0.898 Correlation Coefficient - 0.83 Convergent Validity (Correlation Coefficient) |
| 4 | Jie ZHONG, Chun WANG, Jie LI, Jun LIU (2009) | Penn State Worry Questionnaire (PSWQ) | Chinese | Cronbach alpha- 0.898, Guttmann’s Split-Half Reliability- 0.88 & 0.65, Convergent Validity (Pearson Correlation Coefficient) |
| 5 | Marcos HortesNisiharaChagas et al.,(2010) | Zung Self Rating Depression Scale (ZSRDS) | Brazilian | Cronbach alpha- 0.73, Item total Correlation- 0.30, Concurrent and Convergent validity- 0.70 & 0.65 |
| 6 | Anna Szekely, KatalinMuszbek et al | Hospital Anxiety Depression Scale (HADS) | Hungarian | Cronbach's alpha-0.82, Discriminate Validity, Concurrent Correlation{r}-0.78 |
| 7 | Ali Montazeri, Mariam Vahdaninia et al (2003) | Hospital Anxiety Depression Scale (HADS) | Iranian | Cronbach's alpha-0.78, Discriminate Validity, Convergent (Pearson Correlation{r})-0.83 |
| 8 | Jamdile G. Santos, Jacilene O. Brito, Daniel C. de Andrade et al (2009) | The DouleurNeuropathique 4 questionnaire (DN4) | Portuguese | Cronbach's alpha-0.713, Sensitivity -100%, Specificity- 93.2%, ROC Curve- 0.97 (CI 95%) PPV, NPV |
| 9 | Azidah Abdul Kadir, RusliNordin et al (2004) | Edinburgh Postnatal Depression Scale (EPDS) | Malay | Sensitivity -72.7%, Specificity- 92.6% |
| 10 | Ramli Musa, MohdAriffFadzil, &ZainiZain (2007) | Depression Anxiety Stress Scales (DASS) | Malay | Cronbach's alpha-0.84(Anxiety) & 0.74 (Depression0.001)- 062), Construct Validity by factor analysis |
| 11 | A Montoya, N Llopis, I Gilaberte (2011) | DISCERN | Spanish | Concurrent Validity, Face Validity |
| 12 | Kocchar PH, Rajadhyakhsha SS (2007) | Brief Patient Health Questionnaire (BPHQ) | 11 Different Indian Languages | Specificity, Sensitivity, Kappa Coefficient |
| 13 | SherinaMohdSidik, Bruce Arroll et al (2012) | Generalized Anxiety Disorder-7 questionnaire (GAD-7) | Malay | Cronbach's alpha-0.74, Convergent Validity |
| 14 | Montalbán SR, Vives AC, Garcia M(2010) | Patient Health Questionnaire-15 (PHQ-15) | Spanish | Cronbach's alpha-0.78, Convergent & Divergent Validity |
| 15 | Appukuttan D, Datchnamurthy M, Deborah SP (2012) | Modified Dental Anxiety Scale(MDAS) | Tamil | Cronbach's alpha-0.839, Convergent & Construct Validity(r = 0.827, p<0.001) |
| 16 | Araya-Vargasa GA, Morrowb SG, Buckworthc J (2009) | Mindful Awareness, Attention Scale (MAAS) | Spanish | Cronbach's alpha-0.88, Co-efficient Correlation(r = 0.94, p<0.01) |
| 17 | Pais-Ribeiro J, Silva I, Ferreira T, Martins A(2007) | Hospital Anxiety and Depression Scale(HADS) | Portuguese | Cronbach's alpha-0.81, Test-Retest, Factorial Validity |
Table 2: Evidence literatures of the validation parameter used.
These can also be calculated as:
Validity: Validity is the degree to which an assessment measures what it is supposed to measure. There are various types of the validity as follows:
• Longitudinal validity: Longitudinal validity is the extent to which changes on one measure will correlate with changes on another measure.
• Criterion validity: Examines the extent to which a measure provides results that are consistent with a gold standard. It is typically divided into concurrent validity and predictive validity.
• Concurrent validity: To validate a new measure, the results of the measure are compared to the results of the gold standard obtained at approximately the same point in time (concurrently), so they both reflect the same construct. This approach is useful in situations when a new or untested tool is potentially more efficient, easier to administer, more practical, or safer than another more established method and is being proposed as an alternative instrument [33].
• Predictive validity: Another statistical approach to validity is predictive validity. This approach is similar to concurrent validity, in that it measures the relationship between examinees' performances on the test and their actual status as masters or nonmasters.
• Construct validity: Reflects the ability of an instrument to measure an abstract concept, or construct. For some attributes, no gold standard exists. In the absence of a gold standard, construct validation occurs, where theories about the attribute of interest are formed, and then the extent to which the measure under investigation provides results that are consistent with these theories are assessed.
• Convergent validity: Convergent validity helps to establish construct validity when you use two different measurement procedures and research methods (e.g. participant observation and a survey) in your dissertation to collect data about a construct (e.g. anger, depression, motivation, task performance). The extent to which convergent validity has been demonstrated is establish by the strength of the relationship between the scores that are obtained from the two different measurement procedures and research methods that you have used to collect data about the construct you are interested in.
• Convergent validity is not the same as concurrent validity, both convergent and concurrent validity are ways of assessing construct validity by examining the strength of the relationship between the scores from two different measurement procedures. However, whilst concurrent validity compared a new measurement procedure with a well-established measurement procedure, both measurement procedures are new when testing for convergent validity [34].
• Discriminate validity: Measures that should not be related are not. Discriminant validity examines the extent to which a measure correlates with measures of attributes that are different from the attribute the measure is intended to assess.
• Content validity: Content validity pertains to the degree to which the instrument fully assesses or measures the construct of interest. It is a logical process where connections between the test items and the job-related tasks are established. Specifically, raters will review all of the items for readability, clarity and comprehensiveness and come to some level of agreement as to which items should be included in the final instrument.
• Face validity: A form of content validity, face validity is assessed by having 'experts' (clinicians, clients, or researchers) review the contents of the test to see if the items seem appropriate.
There were several translated questionnaires used in different studies and their statistical parameter particularly cronbach and convergent validity were reflecting significant [35-52].
From the above study and discussion related to the questionnaire, it can be concluded that the impact of the questionnaire on the respondents varies and it depends on the type of the questionnaire and its translated form.
Above all are the various parameters to determine the validity of the questionnaires. Among them the most used and desired method is Convergent Validity which helps to establish construct validity when they use two different measurement procedures and research methods. The convergent validity was estimated by calculating the Spearman’s correlation coefficients among the Questionnaire Scores.
The translated form of the questionnaire must be validated and it must be reliable for the general populations. The validated and reliability are the most accurate and precise process to standardize or to develop and create a very good questionnaire and to obtain the desirable outcomes from the questionnaire when it is administrating to the respondents.
After the validation of such questionnaire the usage of questionnaire will be very useful for the society and it brings very dramatic change to the diagnostic area since it is nicely understandable by the respondents in their own language which helps to examiner to identify the diseases and provide the specific treatment for that particular disease symptoms.