Translational Medicine
Open Access
ISSN: 2161-1025
ISSN: 2161-1025
Research Article - (2024)Volume 14, Issue 1
This study employs game theory in health economics to develop and test a decision-making model for citizens’ adherence to preventive measures, specifically analyzing the COVID-19 pandemic’s impact on European healthcare systems. The investigation delves into dynamic equilibria at decision nodes regarding preventive measures, utilizing Bayesian equilibria in mixed strategies. Theoretical foundations and simulations explore citizens’ cooperation or defection based on subjective payoffs, considering individual attributes and conditioning factors. Real-world data analysis, particularly focusing on COVID-19 vaccination rates, reveals disparities between simulated equilibria and observed outcomes. The study underscores the need to reduce vaccination barriers, emphasizing the continuous nature of vaccinations and suggests public awareness campaigns and improved appointment management to enhance follow-up vaccinations. It also raises concerns about the effectiveness of mandatory vaccination for diseases requiring frequent revaccination. The findings contribute to future discussions on vaccination policies and strategies to achieve herd immunity.
COVID-19; Vaccination; Behavior; Player
The COVID-19 pandemic presented unprecedented challenges to European healthcare systems. Following the events of the past years, it is now essential to evaluate the measures taken at the time and draw conclusions, in order to be able to predict future behavior. The measures for protection against Severe Acute Respiratory Syndrome Coronavirus 2 (SARS-CoV-2) infection (referred to as “corona measures”) represented an intrusion into the freedom of citizens and thus a social conflict. Game theory in health economics offers various approaches to investigate such situations. The aim of this study is to develop and test a model of decision-making situations regarding preventive measures by citizens using game theory. By examining the dynamic equilibria in decision nodes for preventive measures, we can draw conclusions regarding the measures that are truly appropriate. Furthermore, one can determine the effect that the measure’s course can have on the intended outcome. It is important to model the relevant dynamic equilibria as simply as possible to enable broad applicability.
Theoretical foundations
Utilizing game theory to simulate issues within medical contexts constitutes a widely employed and well-established methodology [1]. Furthermore, prior investigations have attempted to deduce decisions predicated on game-theoretical principles during the Corona Virus Disease-19 (COVID-19) pandemic [2-4]. Although some authors have endeavored to simulate the COVID-19 pandemic as a prisoner’s dilemma, it appears unsuitable for the scenarios under investigation due to our lack of knowledge regarding the players’ payoffs [5]. In discussions concerning the advantages of preventive measures, a topic of significant public concern throughout the pandemic years, we must grapple with numerous variables that remain unknown. Modeling the situation as a game of public goods also proves unhelpful, as it unduly complicates matters by abstractly referencing public goods primarily in the context of non-measurable variables such as freedom and subjective utility, which cannot be readily incorporated into a mathematical formula [6].
Moreover, one’s personal health is not a public good and individual freedoms do not constitute a common good. The pandemic has demonstrated the public sector’s capacity to exclude individuals from the utilization of public goods through restrictive measures (e.g., quarantine, penalties, access restrictions, work prohibitions, etc.). The incongruities and inadequacies of controlling authorities and the associated higher payoffs for players should not be the focus here. When simulating decision nodes among affected citizens regarding preventive measures, a viable simulation approach involves employing a game model with Bayesian equilibria in mixed strategies. In this context, mixed strategies imply that the citizenry makes decisions for or against a measure with a probability denoted as “p” (where “p” ranges between 0 and 1).
Despite the non-numeric nature of the underlying variables, we can work with “p” without the necessity of predefining other variables, as we can derive “p” from real-world data without explicitly specifying the underlying conditioning factors. Indeed, decisions concerning the adoption or rejection of preventive measures, whether pertaining to the prevention of infectious diseases, chronic ailments or other preventive contexts, invariably constitute personal choices by citizens. Consequently, these choices are contingent upon an array of factors that defy facile measurement or calculation, thereby rendering them outside the purview of this study. The sole exception pertains to preventive constraints imposed without individuals’ decision-making agency, with mandatory vaccination serving as an example [7].
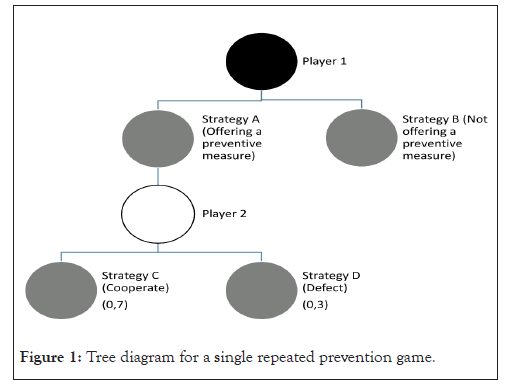
The framework within which citizens make these determinations is influenced, among other factors, by stakeholders within the public healthcare sector. Thus, if player 1 (in our example, representing public healthcare) extends an offer of a preventive measure to player 2 (in our example, representing the entire population), player 2 can elect either to accept or decline it. These decision scenarios can be visualized using a tree diagram (Figure 1).

Figure 1: Tree diagram for a single repeated prevention game.
The decision to recommend or not recommend a measure, stems from an evaluation process, typically preceded by scientific investigations confirming the advantages of a specific measure. In this context, player 1 will opt for strategy A if it offers a favorable outcome (positive payoff) and strategy B if this measure does not assure a positive outcome. From an objective standpoint, it would consistently be the dominant strategy for player 2 to cooperate, thereby employing a measure only when offered by player 1. Nonetheless, objective decision criteria do not invariably govern decision-making and it remains unpredictable for individual citizens whether they will choose cooperation or defection and which factors hold particular significance for them. It is postulated, however, that these factors remain constant when neither player 1 nor player 2 alters the conditions.
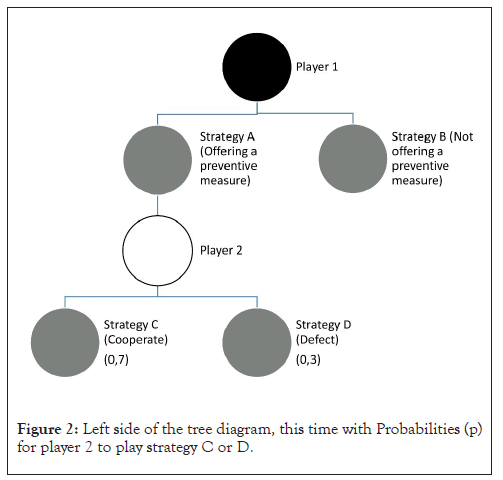
Similarly, the subjective payoff of player 2 cannot be precisely predicted. Regrettably, player 2 bases their decision on this payoff. For our purposes, this payoff can only be indirectly ascertained through backward induction. As the probability of player 2 cooperating rises, so does their anticipated (subjective) payoff for cooperation. Of particular interest to us is the question of player 2’s cooperation when player 1 extends a preventive measure (Figure 2).

Figure 2: Left side of the tree diagram, this time with Probabilities (p) for player 2 to play strategy C or D.
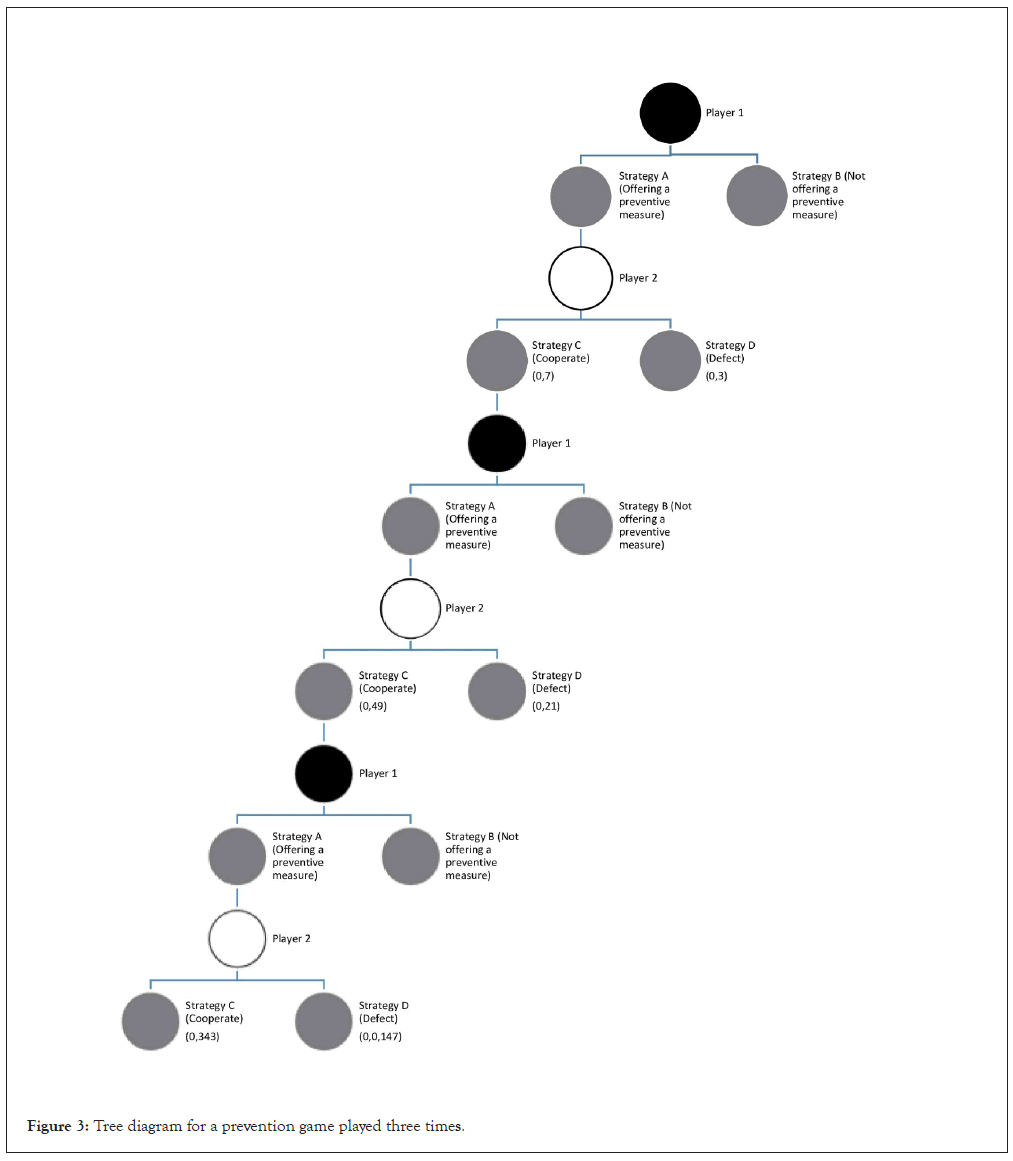
The likelihood of player 2 cooperating or defecting hinges on their subjective payoff, which, in turn, is contingent on individual attributes of player 2 and the conditions imposed by player 1, variables that remain undisclosed. Simplistically, it can be inferred that player 2’s individual attributes are rooted in upbringing and past experiences and thus, they remain constant. Consequently, when player 1 also maintains the conditions unchanged, the probability of player 2 cooperating or defecting likewise remains constant. The constancy of the cooperation probability at the decision node assumes paramount importance in repeated games. In such cases, the probability of player 2 consistently cooperating in each iteration is derived from the initial probability in the first game, denoted as p0, multiplied by the number of repetitions (Figure 3).

Figure 3: Tree diagram for a prevention game played three times.
Hence, if the conditions remain unaltered, the probability (px) of player 2 cooperating in each successive repetition (x) of the game can be calculated based on the initial probability in the first game (p0) using the following formula:
p_X = 【 p_0】^(X+1)
In the given example, the probability in the 2nd repetition of the initial game for cooperation is calculated as follows:
p_X = 【 p_0】^(X+1)
p_ 2 =【 0.7】^3
p_ 2 = 0.343
Control through real-world data
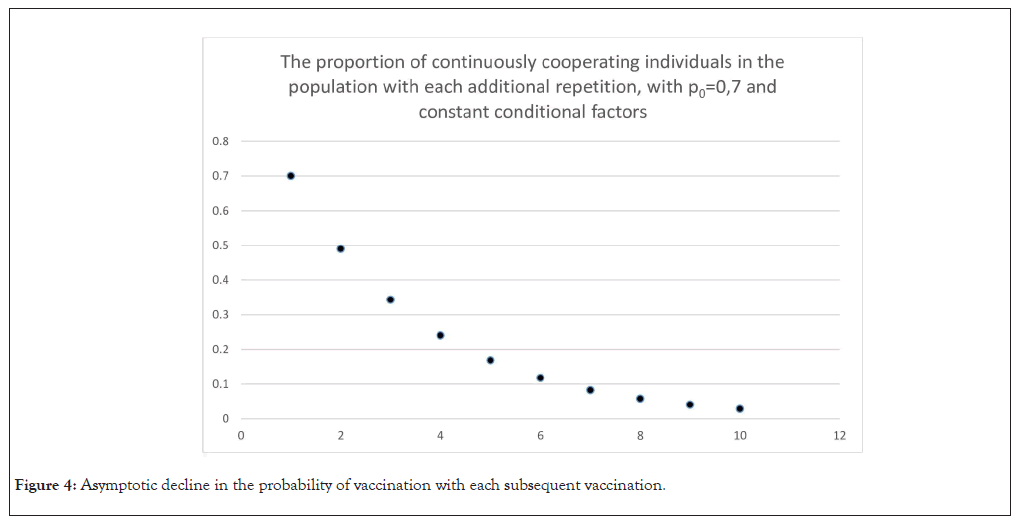
If these preliminary considerations hold true, it is anticipated that an asymptotic decline in vaccination probability will manifest itself with repeated vaccine administrations, as depicted in Figure 4. Real-world data pertaining to this phenomenon are primarily available for select vaccines, with notable attention given to the vaccination against the SARS-CoV-2 virus. In recent years, extensive efforts have been made to inoculate the populace against this virus and data collection has been carried out in an unprecedented manner. Publicly accessible data from the European Centre for Disease Prevention and Control (ECDC) reveals that 73.1% of all European Union (EU) citizens have received full vaccination (330,874,923 citizens) [8]. However, for the initial booster shot, only 54.8% of EU citizens opted for vaccination (248,148,426 citizens), roughly 75% of the fully vaccinated individuals. This outcome aligns with expectations, derived from the formula, that predicted a rate of 53.4% when starting from an initial 73.1% fully vaccinated population.

Figure 4: Asymptotic decline in the probability of vaccination with each subsequent vaccination.
The proportion of booster vaccinations in the total population exhibited variations across countries: in Germany, it was 54.8% (with an expected rate of 58.21%); in Sweden, it stood at 53.3% (49.8% expected); in Spain, it reached 56.2% (62.9% expected); and in Estonia, it was 36.6% (40.1% expected).
Asymptotic reductions in vaccination rates are also noticeable in data related to Diphtheria, Tetanus and Pertussis (DTP) vaccinations [9]. For instance, DTP vaccinations in Brandenburg showed that the rate for the third vaccination was 92.9%, deviating by only 0.5% from the calculated value of 92.4%, as indicated in Table 1.
| Disease | 1st vaccination | Completed primary immunization | Expected for completed primary immunization | Difference |
|---|---|---|---|---|
| Age 4-7 years | ||||
| Mumps | 97,5 | 93,2 | 95,1 | -1,9 |
| Measles | 97,3 | 93 | 94,7 | -1,7 |
| Rubella | 97,2 | 93 | 94,5 | -1,5 |
| Varicella | 88,9 | 85,1 | 79 | 6,1 |
| Age 15 months | ||||
| DTP | 96,6 | 90,5 | 93,3 | -2,8 |
| Age 24 months | ||||
| MMR | 93,7 | 80,5 | 87,8 | -7,3 |
| Varicella | 88 | 75,2 | 77,4 | -2,2 |
Table 1: Real-world data and calculated values for the recommended vaccinations against Diphtheria, Tetanus and Pertussis (DTP) and Measles, Mumps, Rubella (MMR), as well as varicella by age, in accordance with the epidemiological bulletin of the Robert Koch Institute (RKI) as of December 1, 2022.
In the context of basic immunization, the required second vaccination at the EU level reached 73.1%, following an initial vaccination rate of 75.6%, with no apparent asymptotic decline. Similarly, in Germany and Sweden, the decrease from the first to the second vaccination was marginal, while in Estonia, the reduction from 63.5% to 63.3% was even smaller. Spain recorded an initial vaccination rate of 87.4%, which decreased to 79.3% for the second vaccination (76.4% expected).
Concerning the fourth COVID-19 vaccination, administered as the second booster shot, the percentages across all considered countries fell notably below the anticipated values (Table 2).
| COVID-19 Vaccinations by regions | ||||||||||
|---|---|---|---|---|---|---|---|---|---|---|
| Region | 1st vaccination | 2nd vaccination | Expected for 2nd vaccination | Difference | 3rd Vaccination | Expected for 3rd vaccination | Difference | 4th vaccination | Expected for 4th vaccination | Difference |
| EU | 75,6 | 73,1 | 57,2 | 15,9 | 54,8 | 53,4 | 1,4 | 14,3 | 39,1 | -24,8 |
| Germany | 77,9 | 76,3 | 60,7 | 15,6 | 54,8 | 58,2 | -3,4 | 15,2 | 44,4 | -29,2 |
| Sweden | 71,9 | 70,6 | 51,7 | 18,9 | 53,3 | 49,8 | 3,5 | 27,7 | 35,2 | -7,5 |
| Spaim | 87,4 | 79,3 | 76,4 | 2,9 | 56,2 | 62,9 | -6,7 | 20 | 49,9 | -29,9 |
| Estonia | 63,5 | 63,3 | 40,3 | 23 | 36,6 | 40,1 | -3,5 | 8,2 | 25,4 | -17,2 |
Table 2: Real-world data on Corona Virus Disease-19 (COVID-19) vaccinations in the European Union and selected countries based on publicly available data from the European Centre for Disease Prevention and Control (ECDC), rounded to one decimal place. The calculated values were determined based on the proportion of fully vaccinated individuals to the total population, as per the formula.
The simulated dynamic equilibria exhibit notable disparities when compared to real-world data on multiple fronts. At the European Union (EU) level, the simulation results displayed an upward deviation of 1.4% absolute from the real-world data for the first booster shot. In contrast, the real-world data for the second booster shot demonstrated a significant downward deviation of 24.8% and this pronounced divergence was consistently observed in all other considered countries. One crucial contributing factor to this divergence likely stems from the altered recommendation for the second booster shot in comparison to the first booster shot, indicating a lack of constancy in conditioning factors. The second booster shot was no longer intended for the entire population but was exclusively targeted at specific professional groups and vulnerable populations. Even in the case of Measles, Mumps, Rubella (MMR) vaccinations, the real-world data fell short by less than 2% absolute in comparison to calculated values, while for varicella, they exceeded expectations by as much as 6.1%. However, for DTP (third vaccination), the real-world data lagged by 2.8%.
It is evident that calculating the proportions of the population choosing to undergo vaccination within these dynamic equilibria was only feasible when the conditioning factors (e.g., vaccination recommendations) remained constant. Concerning basic immunization, it was observed that the values for the necessary second vaccination were significantly higher than the expected values, a phenomenon not observed in the case of MMR and DTP vaccinations. The underlying cause of this discrepancy can only be speculated upon, but it is highly plausible that it relates to the particularly low barriers to accessing COVID-19 vaccination. Often, citizens were already scheduled for a second vaccination during their first vaccination appointment. The threshold for rescheduling appointments was likely higher initially due to limited appointment availability. This may have led vaccinated individuals to perceive both events as interconnected, effectively reducing their decision-making to a single choice, rather than two separate decisions.
If this premise holds true, it suggests that player 2, as depicted in the initial tree diagram, remains within the same decision node of the game. Consequently, the original probability for the first vaccination also serves as the probability for the second vaccination, with the latter being influenced solely by the proportion of those yet to decide, i.e., those situated in decision node 2. This observation assumes significance because the asymptotic decline in necessary second and third vaccinations, as observed in recommended vaccination schedules, can impede the attainment of herd immunity for certain diseases. This, in turn, may necessitate the implementation of mandatory vaccination, as witnessed in the case of measles.
In the future, efforts should be directed toward significantly reducing vaccination barriers for citizens, fostering a perception of all vaccinations as a continuous process, obviating the need for subjective deliberation before each vaccination. Achieving this objective may necessitate public awareness campaigns aimed at promoting the importance of necessary second and third vaccinations. Additionally, attention should be devoted to appointment management and vaccination organization, where additional support can augment the proportion of follow-up vaccinations for basic immunization. Another insight that emerges from this analysis is that, with constancy in the probability of decision at each node, an asymptotic decline in the proportion of those opting for vaccination can be observed consistently, even in the presence of mandatory vaccination, as seen in the case of measles. Therefore, if this asymptotic decrease holds universally, the effectiveness of mandatory vaccination must always be evaluated based on its ability to achieve herd immunity. The more frequently a vaccination must be repeated, the greater the asymptotic decline in the presence of complete constancy in conditioning factors. Consequently, mandatory vaccination may not be independently effective for vaccinations requiring frequent repetition, such as seasonal influenza vaccination. The same consideration applies to vaccinations that are likely to necessitate frequent revaccination, such as those for COVID-19. These observations should inform future deliberations surrounding mandatory vaccination policies.
[Crossref] [Google Scholar] [PubMed]
[Crossref] [Google Scholar] [PubMed]
[Crossref] [Google Scholar] [PubMed]
[Crossref] [Google Scholar] [PubMed]
[Crossref] [Google Scholar] [PubMed]
Citation: Philipp H (2024) Prevention as a Game-Theoretical Simulation in Bayesian Equilibria and Control through Real-World Data from Vaccination Monitoring. Trans Med. 14:313.
Received: 29-Dec-2023, Manuscript No. TMCR-23-28370; Editor assigned: 01-Jan-2024, Pre QC No. TMCR-23-28370 (PQ); Reviewed: 15-Jan-2024, QC No. TMCR-23-28370; Revised: 22-Jan-2024, Manuscript No. TMCR-23-28370 (R); Published: 29-Jan-2024 , DOI: 10.35248/2161-1025.24.14.313
Copyright: © 2024 Philipp H. This is an open-access article distributed under the terms of the Creative Commons Attribution License, which permits unrestricted use, distribution, and reproduction in any medium, provided the original author and source are credited.