Journal of Drug Metabolism & Toxicology
Open Access
ISSN: 2157-7609
ISSN: 2157-7609
Research Article - (2017) Volume 8, Issue 3
Efficacy and safety of a drug and its plasma concentration are closely correlated, and plasma concentrations are used as an index of the drug’s effects. Therefore, it is important to understand the relationship between the drug’s plasma concentration and its effects. Plasma glucose control of diabetics retards its progression and glimepiride is widely used for its treatment. In the present study, pharmacokinetic-pharmacodynamic analysis of glimepiride was performed in Wistar rats, with normal plasma glucose levels (Normal), and streptozotocin-induced type 1 diabetes rats (Type 1) and type 2 diabetes GK rats (Type 2). The PK-PD model was structured to investigate time-dependent plasma glucose changes in relation to the plasma concentration, and the PK and PD characteristics of glimepiride were investigated.
PK analysis of glimepiride in the three groups showed no significant differences in total body Clearance (CL) and half-life of the β phase. Plasma concentration profiles at a 0.5 mg/kg dose increased in the following order; Type 1, Normal, and Type 2 groups. The area under the plasma concentration-time curves for glimepiride was dosedependent in Normal and Type 2 groups. The CL decreased in the Type 2 group compared to the other groups at a 0.5 mg/kg dose. The maximum decrease in the plasma glucose level was increased in the following order; Normal, Type 2, and Type 1.
From the estimated PK-PD analysis, the plasma glimepiride concentration necessary to produce hypoglycemic effects was higher, and the responsiveness of the drug at a drug concentration at the half-maximum effect was quicker, in the Type 2 group compared to the other groups. These effects of glimepiride were considered to improve the pathological condition. This study of the PK-PD characteristics of glimepiride is useful for prediction of the influence of drug-drug interactions and the change in clinical conditions of patients.
Keywords: Pharmacokinetic-pharmacodynamic modelling; Antidiabetes; Glimepiride; GK rats; Streptozotocin; Diabetes model rat
PK: Pharmacokinetic; PD: Pharmacodynamic; GK rat: Goto- Kakizaki Rat; PEG: Polyethylene Glycol 400; iv: Intravenous; Ip: Intraperitoneal; MRM: Multiple Reaction Monitoring; ESI: Electrospray Ionization; k12, k21, k10: First-order Rate Constants for the Pharmacokinetic Process; k0: Infusion Rate; Ct: Plasma Concentration at Time t; D: Administered Dose; V1: Distribution Volume of the Central Compartment; Vdss: Distribution Volume at the Steady-state; Tinf: Infusion Period; AUC: Area under the Plasma Concentration- Time Curve; CLL: Total Body Clearance; Cmax: Maximum Plasma Drug Concentration; t1/2, β: Half-life in the β Phase; Emax: Maximum Drug Effect; EC50: Drug Concentration at Half-maximum Effect; γ: Hill Constant; Kin, kout: Zero- and First-order Rate Constants Related to the Formation and Degradation of Glucose
Drug therapies are designed based on the efficacy and safety of drugs, and basic evaluation of drug effects can be used to measure the plasma drug concentration. Therefore, an understanding of the relationship between the plasma concentration of a drug and its effect is important to assess pharmacokinetics in clinical practice. This will allow the drug dose and the effects or side effects of drugs to be quantitatively investigated using a Pharmacokinetic (PK)- Pharmacodynamics (PD) modelling technique. Information from PKPD modelling is useful as it allows for determination of the therapeutic regimen and dose requirements needed for optimum treatment of individual patients.
Diabetes is a serious and common metabolic disease and is characterized by hyperglycemia resulting from defects in insulin secretion, insulin action, or both. Chronic hyperglycemia increases the risk of neuropathy, retinopathy, and significant neurological dysfunction in diabetic patients, if treatment is not successful [1-3]. Diabetes is classified into type 1 and type 2 diabetes. Briefly, type 1 diabetes is caused by insulin insufficiency, whereas insulin sensitivity is decreased in type 2 diabetes. It is important that the relationship between the pharmacokinetics and effect of drugs after their administration are clarified.
Glimepiride is largely used as a type 2 diabetes therapeutic drug in clinical practice. This drug is effective not only for the treatment of type 2 diabetes, but also for type 1 diabetes [data on file, (2017) Interview Form, Amaryl, Sanofi K. K.]. It is known that glimepiride induces a blood hypoglycemic action by promotion of endogenous insulin secretion by pancreatic β-cell stimulation [4]. Glimepiride was slowly, but almost completely, absorbed in rats, dogs, and rabbits orally [5,6]. The liver and, to a lesser extent, the kidneys were the organs with the highest glimepiride concentrations. The excretion clearance of glimepiride was quite small, and most of the administered glimepiride was excreted into the bile as a hydroxymethyl derivative, M1, of which the hypoglycemic effect is about one-third of glimepiride [7]. In the in vitro metabolism study, M1 was found to be formed mainly in the liver microsomal fraction, and glimepiride was metabolized to M1 by CYP2C9 in the liver [8,9].
In the present study, simultaneous examination of the PK and the effects of glimepiride was conducted in Wistar rats, which have normal plasma glucose levels (Normal), as well as in strepitozotocin-induced type 1 diabetes rats (Type 1) and type 2 diabetes GK rats (Type 2) as pathological animal models of diabetes. The PK-PD model was structured to investigate time-dependent plasma glucose changes in relation to the plasma concentration. Such analysis has not yet been investigated using pathological model rats compared with normal rats. PK-PD analysis was used to investigate the characteristics of PK and PD after glimepiride administration in these rat groups.
Materials
Glimepiride and streptozotocin were both purchased from Wako Pure Chemical Industries, Ltd. (Osaka, Japan). Acetonitrile (HPLC grade), polyethylene glycol 400 (PEG), and citric acid were obtained from Nacalai Tesque, Inc. (Kyoto, Japan). All other reagents were of analytical grade and were obtained commercially.
Standard stock solutions of glimepiride were prepared by dissolving glimepiride in methanol to a final concentration of 100 μg/mL. This solution was used to prepare a standard for the calibration curve. Briefly, a small amount of this solution was added to drug-free rat plasma.
Preparation of type 1 diabetes rats
Wistar male rats were used to prepare type 1 diabetes rats. Streptozotocin, a N-nitroso derivative of D-glucosamine, destroys the β-cells in the pancreas after a single injection [10]. Animals treated with streptozotocin develop hyperglycemia due to insulin deficiency, and serve as a model of insulin-dependent diabetes. Streptozotocin (50 mg/mL/kg body weight) dissolved in isotonic citric acid was administrated by intraperitoneal (ip) injection. One week later, rat urine was collect using a metabolic cage, urinary glucose was tested using TES-TAPE A (Shionogi & Co., Ltd., Osaka, Japan), and rats with urinary glucose above 250 mg/dL were used for this study.
Animal experiments
Male Wistar and GK rats (Shimizu Laboratory Co., Ltd., Kyoto, Japan), 9 to 11-weeks-old, were used throughout the study. The animal experiments were performed in accordance with the Guidelines for Animal Experiments of Doshisha Women's College of Liberal Arts. The rats were housed in pairs under controlled environmental conditions and fed commercial feed pellets with free access to water. Five to seven rats were used for the study of each dose/rat group. Wistar male rats were used as a normal plasma glucose level control group (Normal), type 1 diabetes was induced in Wister rats (Type 1) using streptozotocin, as described above, and GK rats were used as a polygenic model of spontaneous type 2 diabetes mellitus (Type 2).
Under ip anaesthesia by a Somnopentyl injection (Kyoritsu Seiyaku Corporation, Tokyo, Japan, 32.4 mg/kg), 1.0 g/kg rat body weight, intravenous (iv) infusion test solutions of glimepiride prepared in 0.5 mL PEG were administered at doses of 0.2, 0.5 and 1.0 mg/kg body weight. The test solutions were infused for 30 min at a rate of 0.5 mL/30 min using a variable-speed compact infusion pump, a KDS1000 syringe pump (LMS Co., Ltd, Tokyo, Japan), into the right femoral vein. Blood samples were directly collected from the right jugular vein using a heparinized syringe 5-360 min after starting the infusion. All blood samples were centrifuged to obtain their plasma fractions. Plasma samples were stored in the refrigerator for PD analysis or frozen immediately after collection and stored in a freezer at -30°C until PK analysis. The plasma glucose concentration was measured by glucose oxidase analysis as described below. Drug concentrations in rat plasma were measured by the LC/MS/MS assay method described in the next section.
Quantitative analysis of glimepiride
For the extraction of glimepiride from rat plasma, 50 μL plasma, 500 μL of 1 N NaOH, and 2 mL ethyl acetate were added to a 15-mL extraction glass tube. The tube was shaken for 20 min and centrifuged at 3,000 rpm for 15 min. The organic extracts were separated by freezing the aqueous layer, followed by decanting the organic liquid into a clean glass tube. The organic liquid was evaporated using the SPD1010 SpeedVac concentrator system (Thermo Electron Corporation, Yokohama, Japan). The resulting residue was reconstituted by adding 50 μL HPLC mobile phase (90% acetonitrile solution including 0.1% formic acid), of which a 30 μL aliquot was injected into the LC/MS/MS system described below. Calibration curve samples were prepared by adding known amounts of glimepiride (0.1-250 ng) to the plasma of rats.
Glimepiride plasma concentrations were determined using the 4000 Q trap LC/MS/MS system (AB Sciex, Foster City, CA, USA) equipped with a Prominence HPLC system (Shimadzu Co., Kyoto, Japan). The HPLC system consisted of a LC-20AD pump and a SIL-20AC automatic sample injector. The flow rate of the pump was 0.2 mL/min. The analytical column was a Cosmosil 5C18-MS-II (50 × 2.0 mm ID; Nacalai Tesque, Inc.) and was maintained at 40°C by a column oven (CTO-20A; Shimadzu). The data were loaded onto Analyst ver 1.4.1 analytical software (AB Sciex) by connecting to a CBM-20A (Shimadzu) communication bus module.
Detections were performed in the multiple reaction monitoring (MRM) mode of the parent, with the selected product ion acting as the positive mode. The source parameters were as follows: curtain gas, collision gas, ion spray voltage, temperature, and ion source gases 1 and 2 were 10.0, 8, 5500.0, 400, 40.0, and 40.0, respectively. Glimepiride was monitored using the following mass transition, m/z 491.1 → 126.0, by an Electrospray Ionization (ESI) method. The linear ranges of the calibration curves were both 2 to 5,000 ng/mL.
Quantitation of plasma glucose
Plasma glucose concentrations were measured by the glucose oxidase method using a glucose CII-test (Wako Pure Chemical Industries, Ltd.) [package insert, 2008]. Briefly, sample plasma (10 μL) was added to a clean glass tube, and then 1.5 mL of reacting solution for glucose was added to the tube. The glass was then vortexed for 1 min, incubated at 37°C for 5 min, and the absorbance was measured at 490 nm within 30 min.
Pharmacokinetic analysis
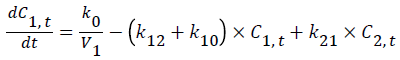
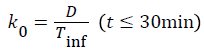
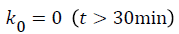
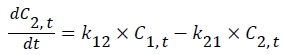
A general two-compartmental pharmacokinetic model was applied to the data using Phoenix™ WinNonlin® 6.2 (Pharsight®, a Certara® company, Mountain View, CA, USA). The rate constants for the pharmacokinetic process, such as k12, k21, and k10, followed first-order kinetics. The infusion rate of glimepiride, k0, followed zero-order kinetics. Ct is the concentration at time t, where t is the time after starting the infusion. Indexes 1-2 represent the PK compartment numbers. D is the administered dose, and V1 and Vdss are the distribution volume of the central compartment and at steady-state, respectively. Tinf is the infusion period, 30 min in this study.
The anti-hyperglycemic effect of glimepiride was estimated, minus the control glucose profile (data are not shown), from the raw plasma glucose levels after glimepiride administration.
Figure 1 shows PK-PD models utilized in this study [11].

Figure 1: Schematic representation of the PK-PD model of plasma glucose changes produced by glimepiride.
PK-PD analyses of plasma glucose changes by glimepiride were performed using an ordinary indirect response model. Incorporating the PK parameters determined from the mean plasma values, the PD parameters were predicted by fitting the data to PK-PD models using WinNonlin. In the model, Kin and kout are the 0 order and 1st order rate constants, respectively, of the formation and elimination of glucose. Emax and EC50 are the maximum drug effect and the drug concentration at half-maximum effect, respectively. Gamma (γ) is the Hill constant.
Statistics
Statistical analysis was performed by two-sided t-tests. P<0.05 was considered to be significant.
Figure 2A shows plasma concentration-time curves after 30-min iv infusion of glimepiride in the Normal group at two doses.

Figure 2: Fitted and observed plasma concentrations of glimepiride after iv infusion into Normal (A), and Type 1 and 2 (B) groups. Symbols: 0.2 (▲) and 0.5 (●) mg/kg in the Normal (A) group; 0.5 (♦) mg/kg in the Type 1 (B) group; and 0.2 (Δ), 0.5 (○), and 1.0 (■) mg/kg in the Type 2 (B) group. Fitted curves were both obtained according to the two-compartment PK model. Each point represents the mean SD of the data obtained from 5-7 experiments.
Plasma concentrations of the drug increased during the infusion then showed two-compartmental degradation from rat plasma after stopping the infusion. The obtained PK parameters fitted by twocompartmental analysis are summarized in Table 1. The k10, k12, and k21 were 0.0372, 0.0193, and 0.0188 min-1 at the 0.2 mg/kg dose and 0.0447, 0.0360, and 0.0342 min-1 at the 0.5 mg/kg dose, respectively. The half-life in the β phase (t1/2) was tends to prolong by the dose decrease because of the β phase period. Briefly, the t1/2 s were calculated using observed plasma concentration from 150 to 240 min at the 0.2 mg/kg dose and from 240 to 360 min at the 0.5 mg/kg dose. The mean areas under the plasma concentration-time curves (AUC) were largely proportional between the dose ranges. Although PK parameters were calculated using the mean plasma concentration, it is considered that there is almost the same total body Clearance (CL) value between the two doses.
| Normal | Type 1 | Type 2 | |||||||||
|---|---|---|---|---|---|---|---|---|---|---|---|
| Parameter | 0.2 mg/kg | 0.5 mg/kg | 0.5 mg/kg | 0.2 mg/kg | 0.5 mg/kg | ||||||
| Mean | CV (%) | Mean | CV (%) | Mean | CV (%) | Mean | CV (%) | Mean | CV (%) | ||
| PK | V1(mL) | 81.0 a | 6.7 | 66.2 | 17.5 | 78.3 b | 3.6 | 45.9 | 28.4 | 51.2 | 44.8 |
| K10(min-1) | 0.0372 | 12.3 | 0.0447 | 21.3 | 0.0338 b | 4.9 | 0.0261 | 31.5 | 0.0277 b | 46.3 | |
| K12(min-1) | 0.0193 | 30.1 | 0.036 | 65.8 | 0.0279 | 15.1 | 0.0373 | 134 | 0.0859 | 140.7 | |
| K21(min-1) | 0.0188 | 60.5 | 0.0342 | 66.3 | 0.0286 | 17.8 | 0.0536 | 94.9 | 0.0809 | 64.9 | |
| AUC*(μg min/mL) | 21.4 a | 8.7 | 55.2 | 9.5 | 44.9 b | 2.7 | 44.6 a | 9.6 | 101.2 b | 6.1 | |
| t1/2*(min) | 63.9 | 52 | 45 | 42.7 | 55.9 | 11.6 | 51.3 | 29.4 | 56.4 | 13.7 | |
| CL*(mL /min) | 3.01 | 8.7 | 2.96 | 21.2 | 2.65 b | 2.7 | 1.20 a | 9.6 | 1.42 b | 6.1 | |
| Vdss* (mL) | 164.2 | 28.6 | 135.8 | 22.5 | 154.7 | 6.1 | 77.9 a | 14.8 | 105.6 b | 7.2 | |
| PD | Kin(ng/mL/min) | 8.11 a | 21 | 2.97 | 24.7 | 16.09 b | 36 | 9.76 a | 34.7 | 5.49 b | 25.4 |
| kout(1/min) | 0.0519 a | 20.2 | 0.0214 | 24.7 | 0.0286 | 35.2 | 0.0302 a | 34.5 | 0.0152 b | 25.7 | |
| Emax | 0.456 a | 6.8 | 0.667 | 17.9 | 0.178 b | 15.1 | 0.269 a | 17 | 0.495 b | 21 | |
| EC50(ng/mL) | 39.3 a | 9.2 | 202.3 | 20.2 | 27.0 b | 49.8 | 97.1 a | 17.7 | 395.5 b | 15 | |
| Y | 7.45 a | 34.7 | 3.63 | 46.2 | 2.09 | 42 | 44.91 | 1415.5 | 26.35 | 439.2 | |
Table 1: Pharmacokinetic and Pharmacodynamics parameters of glimepiride in Normal, Type 1 and 2 rat groups.
Plasma concentration-time curves for glimepiride after iv infusion in diabetes model rats, Type 1 and 2 groups, are shown in Figure 2B. Compared with the same dose in the Normal group (987 ng/mL), the maximum plasma drug concentration (Cmax) was increased in the Type 2 group (1165 ng/mL) and decreased in the Type 1 group (758 ng/mL). The fitting profiles of the diabetes model groups were consistent with observed data. At the 0.5 mg/kg dose, the AUC, CL, and t1/2 for glimepiride in the Type 1 and 2 groups were 44.9 μg·min/mL, 2.65 mL/min, and 55.9 min, and 101 μg·min/mL, 1.42 mL/min, and 56.4 min, respectively. Near dose-linearity in the PK parameters was observed in the Normal and Type 2 groups, although the CL values for Type 2 were decreased compared with the Normal group. The V1 and k10 were lower, and k12, and k21 were higher in the Type 2 group compared with the Normal and Type 1 groups. Glimepiride is an anti-diabetes drug for the treatment of type 2 diabetes. Thus, we examined the PKs of glimepiride using GK rats and compared them to Normal and Type 1 groups at the same dose, namely 0.5 mg/kg. Although the PK of glimepiride at 0.2 mg/kg was examined in the Normal group, plasma concentrations of glimepiride were too low to calculate the PK parameters adequately. On the other hand, glimepiride induced hypoglycemia at a dose of 1.0 mg/kg in the Normal group. The plasma concentration of glimepiride in the Type 1 group was presumed to be lower than those of the Normal group at the 0.2 mg/kg dose compared with the results at the 0.5 mg/kg dose. In addition, the plasma glucose level of Streptozotocin-induced Type 1 diabetes rats was extremely high, and it was difficult to maintain these conditions. Thus, the PK and PD of glimepiride were investigated only at the 0.5 mg/kg dose in the Type 1 group.
PK-PD model analysis was performed using the mean PK parameters. The plasma glucose profiles of glimepiride after iv infusion in the Normal, Types 1, and Type 2 groups are shown in Figure 3.

Figure 3: Pharmacodynamic responses with respect to the time after iv infusion of glimepiride into Normal, and Types 1 and 2 rat groups. Symbols: 0.2(▲) and 0.5( ● ) mg/kg in the Normal rat group; 0.5 (♦) mg/kg in the Type 1 rat group; 0.2 (Δ), 0.5 (○) and 1.0 (■) mg/kg in the Type 2 rat group. Each point represents the mean ± SD of the data obtained from 5-7 experiments. Symbols and bars indicate the observed mean value and its SD, respectively. Lines represent the fitted PD effects.
The plasma glucose concentrations before drug administration were not significantly different between each dose group in the Normal or Type 2 groups. In the Normal group, plasma glucose levels were 142 ± 11 and 147 ± 38 mg/dL at 0.2 and 0.5 mg/kg doses, respectively. In the Type 2 group, plasma glucose levels were 280 ± 18, 321 ± 34 and 297 ± 33 mg/dL at 0.2, 0.5, and 1.0 mg/kg doses, respectively. The plasma glucose level of the Type 1 group before drug administration was 554 ± 55 mg/dL. These values are similar to those calculated by Kin/kout, respectively. Although the data are not shown, there was hysteresis in that the plasma concentration vs. effect profiles lagged behind the change in the plasma glimepiride concentration. Calculated PD parameters are also listed in Table 1.
PK-PD parameters were obtained by a fitting method followed by PK fitting, and he CVs was relatively large. The Emax values in the three groups were largely similar. Namely, 0.456 and 0.668 for the Normal group, and 0.272, 0.521 and 0.700 for the Type 2 group. However, the EC50 and γ values were higher in the Type 2 group compared with the Normal and Type 1 groups at the 0.5 mg/kg dose. The maximum effects in the present experiment and the time to reach the maximum at the 0.5 mg/kg dose were 82.4 mg/dL and 60 min in the Normal group, 98.3 mg/dL and 60 min in the Type 1 group, and 94.0 mg/dL and 90 min in the Type 2 group, respectively.
In this study, we evaluated the relationship between the plasma glimepiride concentration and plasma glucose changes in Normal (Wistar), Type 1 (streptozotocin-induced diabetes Wistar), and Type 2 (GK) rat groups as a diabetes animal model.
Obtained PK parameters calculated from the mean plasma profiles were adapted to PK-PD models to fit PDs more exactly. Plasma concentration profiles at a 0.5 mg/kg dose increased in the following order; Type 1, Normal, and Type 2 groups. Rate constants of the twocompartment model were large in the Type 2 group compared with the Normal and Type 1 groups. The V1 and slightly the Vdss of the Type 2 group were lower than those of the Normal and Type 1 groups. The t1/2 s of these three groups were largely the same, and the CL was decreased in the Type 2 group. Glimepiride has a high lipophilic property and it was reported that plasma total cholesterol, high-density lipoprotein, low-density lipoprotein, and triglyceride were significantly higher in GK rats than in SD rats, which were the non-diabetic control group [12]. These properties are hypothesized to cause the higher plasma glimepiride concentration values.
The Kin and kout are the zero- and first-order rate constants, respectively, of glucose formation and degradation for the indirect response model in the PK-PD model. These constants were relatively similar in the three groups. In the present study, there was found to be hysteresis, in that plasma glucose changes lagged behind the plasma glimepiride concentration profiles in all groups. It is known that glimepiride has a blood hypoglycemic action by promotion of endogenous insulin secretion by pancreatic β-cell stimulation [4]. Our results were support a previously cited study reporting hysteresis, in that the effect delayed the plasma drug concentration profile. GK rats showed changes in the pancreatic B cell response. They were reported to show glucose intolerance, a hyperglycemic state, and a hyperinsulinemic pattern. Thus, a decrease of the response to insulin in the basal state was suggested [13]. Östenson et al. reported that glucose (16.7 nmol/mL) only stimulated insulin release two-fold in GK rat islets compared with basal insulin secretion, while in control rat islets it was stimulated five-fold [14]. Kimura et al. found that the insulin response to 16.7 mmol/L glucose in the perfused pancreas of GK rats was markedly impaired [15]. In addition, it is reported that glucoseinduced insulin release was impaired in islets from GK rats compared with islets from Wistar rats [16]. Accordingly, hypoglycemic reactivity to plasma glucose decreased in the Type 2 group. From the results of the PK-PD analysis in our study, the γ of the Type 2 group was much higher than those of the Normal and Type 1 groups, and the EC50 value of the Type 2 group was higher than that of the Normal group. This indicates that the plasma glimepiride concentration necessary to produce the hypoglycemic effect is higher, and the responsiveness of the drug is quicker, in the Type 2 group. It was considered that glimepiride administration improved the pathological condition. Experimentally-obtained hypoglycemic effects of the two diabetes groups were observed to a higher extent than that of the Normal group. Basal plasma glucose levels before drug administration in Type 1 and 2 groups were approximately four-fold and two-fold higher, respectively, than that of the Normal group. The maximum decrease in the plasma glucose level was larger at higher plasma glucose levels before drug administration.
Glimepiride is known to have a hypoglycemic effect in rats in which severe Type 1 diabetes was induced by streptozotocin [data on file, (2017) Interview Form, Amaryl, Sanofi K. K.]. In addition, the Type 1 group was induced from Wistar rats that were pre-treated with streptozotocin for destruction of partly pancreatic islet cells. Impaired insulin response is a characteristic feature of type 2 diabetes. Glimepiride acts as a stimulator of the insulin production process. Thus, the plasma insulin level increases and the plasma glucose level decreases after glimepiride.
In this study, PK-PD analysis of glimepiride was performed in normal and pathological model rats. Then PK and PD characteristic of glimepiride in various plasma glucose levels and pathological conditions were investigated. This study of glimepiride PK-PD characteristics is useful to predict the influence of PK, changes in the timing of drug-drug interactions, and changes to the clinical condition of patients.
None of the authors are aware of a conflict of interest concerning this article.
Funding from Doshisha Women’s College of Liberal Arts is gratefully acknowledged.