Family Medicine & Medical Science Research
Open Access
ISSN: 2327-4972
ISSN: 2327-4972
Research - (2020)Volume 9, Issue 1
Background: Universal Health Coverage is a situation where all people can access the health services they need without incurring financial hardship. The aim of the study was to compare the overall satisfaction with primary health care among insured and non-insured outpatient service beneficiaries in five Community-Based Health Insurance (CBHI) contracted health centers in North Eastern Ethiopia.
Methods: facility-based cross sectional comparative study design was conducted from March through April 2017 among 311 insured and 301 non-insured outpatients. All statistical analysis was done using Statistical Package for Social Sciences research IBM version 20.0. Multi-variable linear regression analysis was employed to control confounders in determining predictors of patient satisfaction by insurance status. Chi-Square test, unstandardized coefficient (Uβ), standardized coefficient (Sβ) Standard error, with 95% Confidence Interval (CI) and P < 0.05 was used to claim statistical significance.
Results: Out of 624 outpatients, 612 respondents with a response rate of 98% were enrolled in this study. The overall, insured and non-insured patient satisfaction was 475 (77.6%), 247 (79.4%) and 228 (75.7%), respectively. The mean score with Standard Deviation of the satisfaction score was 86.14 ± 14.99 among insured and 83.85 ± 17.16 among noninsured under CBHI scheme, respectively. An independent sample t-test showed statistically significant difference where insured patients have a higher mean satisfaction score than their counterpart noninsured with t= 2.031, df=610, P=0.043. And the consultation and diagnosis service are much more performed among noninsured than insured patients on the use of a stethoscope, proper examination, taking the history of past illnesses, asked history treatment taken before arrival at the health facility and explained diagnosis to patients by health care providers with X2= 4,509 to 14.664, P-value < 0.05.
Conclusions: The study finding shows that insured patients perceived with a higher level of quality of care and satisfaction score. However, non-insured patients received high proportion score on objective quality of care measurements. Therefore, to improve patient experiences at health centers and achieve financial risk protection through CBHI, program managers and health care providers should ensure quality of services to the standards at the health facility to insured and noninsured community members.
Community-Based health insurance; Perceived and objective quality of care; Patient satisfaction; Ethiopia
AOR: Adjusted Odds Ratio; CBHI: Community Based Health Insurance; CI: Confidence Interval; COR: Crude Odds Ratio; SD: Standard Deviation; SDGs: Sustainable Development Goals; WHO: World Health Organization
The world has more access to essential health services in recent years than any other time in human history. However, there are regional disparities and Sub-Saharan African (SSA) countries lag behind in several health services where health facilities are burdened with lack of resources and supplies to function effectively. To overcome these challenges, in 2017 African health ministers agreed to strengthen health systems through adopting a range of interventions which will eventually lead to countries to achieving Universal Health Coverage (UHC) [1]. UHC is a situation where “all people can access the health services they need without incurring financial hardship” [2-4]. The promotion of Ethiopian public health sector on citizen financial protection through insurance scheme has two major components namely; Social Health Insurance (SHI) and Community-Based Health Insurance (CBHI). SHI is recommended for the formal sector and is in preparatory phase of implementation. CBHI meanwhile has been endorsed and is being expanded to secure financial protection for over 85% of the Ethiopian population who are engaged in the informal sector and have limited protection from other sources [5,6].
Health service equity and quality are important indicators in achieving universal health coverage. The Ethiopian Federal Ministry of Health has developed a strategic plan (2016-2020) to achieve quality health service in the whole country [7]. The quality of healthcare in the strategic plan is defined as “Comprehensive care that is measurably safe, effective, patient-centered, and uniformly delivered in a timely way that is affordable to the Ethiopian population and appropriately utilizes resources and services efficiently”. Patient-centred service as a component of quality of care is measured through patient satisfaction [7,8].
Patient satisfaction is often associated with positive emotions drawn from interaction with health service providers and quality of care in all aspects. Patient satisfaction is seen as a measurement for both an outcome and as an indicator of the quality of care. Studying healthcare quality from the patient’s perspective provides valid and unique information about the quality of care. A number of studies have used patient perspective as a key measure of evaluating healthcare quality and noted that measuring patient satisfaction helps to improve patient experience of care [9-11].
Patient dissatisfaction with poor quality of service is likely to affect their decisions to remain enrolled in the CBHI scheme which ultimately makes the scheme less attractive to new members. Therefore, while removing financial barriers and improving access to care; it is also important that attention is given to the quality of care provided and improving patient experience of care [12]. Since the introduction of CBHI, there is an improved attitude to utilizing healthcare service among the insured members while it gives the freedom to healthcare providers to prescribe the relevant medicines. Is the scheme has also increased health facilities’ internal revenue that is ultimately used for quality improvement [6].
Studies conducted in different areas have shown that satisfied patients are more likely to utilize health services, comply with medical treatment, and continue with using healthcare providers while dissatisfied patients are less likely to follow instructions for taking medications, might not attended follow-up care and discourage family members and friends from seeking healthcare services [11,12]. Patient satisfaction studies conducted in Asia and Africa showed that there were differences on satisfaction of insured and non-insured patients. Although there is a shortage of studies on patient satisfaction in Ethiopia, studies conducted in different areas of the country show that there is a low proportion of satisfaction with health services [11,13-16]. Patient waiting time, friendliness of staff, time given for diagnosis and objective quality of services such as physical examination, measuring temperature and measuring weight were significantly associated with the overall satisfaction of patients [11,12,15,16-19].
In Ethiopia, there have been great efforts put into improvements in increasing health service coverage while little attention has been given to the quality and utilization of services especially in health centers where a significant proportion of patients receive primary health care. Healthcare financing reform, including CBHI, has contributed towards breaking down financial barriers which hamper health service utilization and quality [6]. CBHI has increased healthcare utilization among members and will eventually contribute to the achievement of the goal of universal health coverage [6,20]. An increase in the healthcare demand has increased attention to quality of care on the healthcare supply side. In recent years, various reforms have been used to improve the quality of health services such as the Ethiopian Hospital Alliance for Quality (EHAQ) and Ethiopian Primary Health Care Alliance for Quality (EPAQ).
Ethiopia’s ambitious five-year Health Sector Transformation Plan (HSTP 2015 - 2020) targets four main agendas, namely, (1) Quality and Equity of healthcare; (2) Information revolution; (3) Woreda Transformation; and (4) Compassionate, Respectful and Caring Health Workforce [8]. To achieve these goals, establishing a sustainable health care financing system is mandatory. During the last decade, Ethiopia has piloted and moved to expand the tested CBHI scheme throughout the country [7].
This study is based on the concepts of Robyn et al and Duku et al to elucidate the experiences of outpatient perceived and objective quality of care measurements among insured and noninsured, under community-based health insurance scheme in north east, Ethiopia [18,21]. A comparative cross-sectional facility-based patient satisfaction study on primary health care services among insured and noninsured outpatient services was conducted in the Tehuledere district of Ethiopia. The main aim of the study was to compare the overall satisfaction with primary health care among insured and non-insured outpatient service beneficiaries in five health centers. The second aim of the study was to explore the relationship between the overall satisfaction and socio-demographic characteristics, objectives and perceived dimensions of quality of care.
Study setting
A comparative cross-sectional facility-based study among patients who are insured and noninsured under the CBHI scheme was conducted in Tehuledere district, Amhara region, north east Ethiopia. According to the point estimate of the district population in the year 2017 (CSA), was about 139,341, where males account for 73,973 (53%) and females totalling 65,368 (47%). The majority 135,328 (97.1%) are rural residents. Close to half (53%) of the households in the district were active members of the CBHI Scheme [22]. Health care service in the district are delivered through five health centres, 26 health posts and nine private health facilities. Tehuledere district is one of thirteen districts, where CBHI was introduced as a pilot program since 2010 in Ethiopia [6]. This study was employed in five CBHI contracted health centres from March to April 2017.
Source and study population
The source population of the study was all outpatients who visited the health centres in the study period. The study populations were selected using a systematic random sampling technique among adult patients who had visited the outpatient department during the study period and data were collected from both insured and noninsured patients.
Eligibility criteria
Patients who are insured and noninsured under CBHI scheme and had visited the outpatient departments of health centers were included in the survey. Patients who were critically ill and unable to respond to interviews, urban residents, formal sector employees, students and retired patients and clients who use exempted services were excluded from the interviews because as they do not require insurance coverage.
Sample size determination
The sample size for the study was determined by the double population formula using EPI Info version 7. The sample size was calculated using power formula which was assumed to be 80%. The formula used for the calculation is [23]:
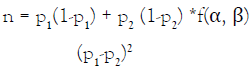
The assumption was:
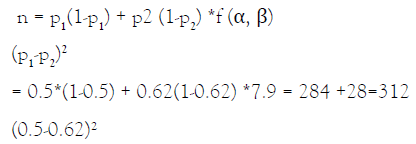
n= sample size; P1-proportion satisfaction in the CBHI member clients is taken as 50% because there is no study conducted in health insurance implementing areas; and P2-proportion of satisfaction in non CBHI member clients is taken as 62% from a study conducted in western Shoa, central Ethiopia [13]; α - The level of statistical significant 0.0;5 β = Type II error 0.2; and none response rate 10%
Therefore, the final calculated sample size was,
Sampling procedures
All five health centers in the district were included in the study. The number of interviewees was proportionally allocated to the number of outpatients that were seen at the health centers in the last three months, prior to the actual data collection. The outpatient lists were obtained from routine Health Management Information System (HMIS) reports of the health facilities. Accordingly, there were 23,746 insured and 18,829 noninsured outpatient attendants in three months. In the health centers, patients who visited the health centers during the study period were registered as insured and noninsured in the record rooms using a daily routine register. From both groups based on the list, interviewees were systematically selected at the 25th interval. The first interviewee was selected using a lottery method from the register.
Data collection
The data collection was conducted using a structured questionnaire which was adopted from studies conducted in Ghana, Burkina Faso and Ethiopian Health insurance pilot study [6,12,18,21]. The data collection tool for the study was an interviewer-administered structured questionnaire. The questionnaire was first prepared in English and then translated into Amharic. The Amharic version of the questionnaire was used for data collection.
The data collectors were trained, diploma level health professionals working in the neighboring woredas. A two-day long training was conducted on principles of data collection, components of instruments and ethical principles. Based on the results of a pretest, tools used in the study were modified. Face to face interview technique was used to collect data using a structured questionnaire. The data were collected from patients during their exit from the facility and interviewees whose age is 18 years old and above were interviewed while caretakers or guardians of those who were below 18 years were interviewed. To protect the collected data from any bias, the data collectors were given strict guidance to confine the whole process and information to themselves and use a separate room for the interviews. The health information technicians identify, provide codes and collect insurance statuses in a separate sheet. Data collectors were kept blind to the insurance status of patients.
Data quality management
The questionnaire was tested defects in Wuchale health centre located in the Ambassel district which has a similar setting with the surveyed district and the questionnaire was restructured and rephrased accordingly. The data collection was closely monitored, and regular communication was maintained with supervisors and data collectors. Each questionnaire was reviewed by supervisors to check its completeness and consistency and the completed questionnaires were rechecked by the principal investigator to maintain the quality of the data.
The reliability of twenty-seven Likert scale perceived quality of primary health services measurement instruments was estimated using Cronbach’s alpha value of 0.927. This result was much higher than the generally accepted value of 0.80 which was recommended by Kline as cited in Sauer Liberato et al for cognitive tests [24]. The results confirm that the instrument employed was reliable.
Data processing and analysis
After all questionnaires were collected, they were checked for completeness, cleaned, coded and finally entered into EPI Info statistical software V.3.5.1(CDC, Atlanta, Georgia, USA) [25] and exported to the Statistical Package for Social Science (SPSS-IBMversion 20) [26]. Descriptive statistics were used to summarize the data by using simple frequency tables and figures. The respondents were asked about their perceived satisfaction of the primary health care services they were received on the day of the interview. The data were scored using a five-level Likert scale of categories. The scores were: ‘very good’ (5); ‘good’ (4); ‘Somewhat good’ (3); ‘poor’ (2); and ‘very poor (1). For each respondent, summary scores, or a ‘mean patient satisfaction’ score was calculated by summing individual perceived quality scores for each item and dividing the result by five. The aggregate or ‘mean patient satisfaction’ score was equaled to three point-one. To produce categorical variables on patient satisfaction, the weighted mean scores less or equal to two were classified as dissatisfied. The mean score greater or equal to four were classified as satisfied. For the mean scores between greater than two and less than four, first median was calculated then the score less than median was classified and dissatisfied and the rest classified and satisfied [27]. To examine the presence of a statistical significant association between the insured and noninsured under CBHI scheme on perceived and objective quality of services, Pearson’s Chi-Square test, independent sample t-test, and linear logistic regression model were employed. A bivariate linear regression was analyzed to identify potential predictor variables which have a P-value of 0.2 for transferring candidate variables to multi-variable linear regression. The dependent variable, overall patient satisfaction, and the independent variables were entered into the regression model including, socio-demographic, cost of services, cost of prescribed drugs, provider recording of patient history, provider inquiry into treatment taken before arrival, provider usage of a stethoscope, provider performing a proper physical examination and provider explanation of the diagnosis to the patient. The variables used in the regression model as control were: age, (continuous), gender (male=0 , female=1), married or not married ( not married =1, married =0), cost of service (very high=1, high=2, acceptable=3, low=4, very low=5), cost of prescribed drugs (very high=1, high=2, acceptable=3, low = 4, very low=5), provider performance on objective variable ( Yes= 1, no=0). Variables with P< 0.05 were claimed as associated factors for patient satisfaction in insured and noninsured outpatient service beneficiaries. The following multiple variable linear regression model was used:
Patient satisfaction=α + β1Age + β2 Sex + β3 Educ+ β4 Marital + β5 cost of Service + β6 cost of drugs + β7 measure weight + β8 measure temp + β9 use stethoscope + β10 proper examination + β11 history of past illnesses + β12 history of present illness + β13 history of treatment + β14 diagnosis explained + ɛi.
NB: α: constant; β: slop/coefficient; ɛi: value of standard error
Ethical consideration
Prior to the implementation of the research project ethical clearance was obtained from Wollo University College of Medicine and Health Science Ethical committee. A support letter was also obtained from district health office and submitted to all health centers. Informed written consent was obtained from each study participant after the purpose and objective of the study were clearly shared. Participants were also informed that participation is on a voluntary basis and that they can withdraw from the study at any time if they are not comfortable. For the purpose of confidentiality, the names of participants were not recorded.
Socio-demographic characteristics of the study population
Table 1 summarizes the presentation of a comparison of the socio-demographic characteristics of the study participants versus outpatient service beneficiaries among insured and noninsured under the CBHI scheme. Out of 624 outpatients, 612 (98%) respondents with a response rate of 98% were enrolled in this study. Among the total interviewed clients, 311 (50.8%) were insured and 301 (49.2%) were noninsured under the CBHI scheme. The mean age with Standard Deviation (SD) was 39.91±13.57 and 35±13.09 years for insured and non- insured participants, respectively. There was a statistically significant difference in age among study participants with X2= 18.262, P-value= 0.000. With regards to the gender of participants, 228(73.3%) were male and 83 (26.7%) were female while 185 (61.5%) of male and 116 (38.5%) female respondents were in the noninsured group, with statistically significant difference in distribution between insurance status and gender at X2=9.78, P-value= 0.002. In terms of the level of education of respondents, 141 (45.3%) of the insured and 64 (21.3%) noninsured groups are uneducated. On the other hand, 84 (27.0%) of the insured and 55 (18.3%) of the noninsured study participants were able to read and write. The study participants’ distribution had a statistically significant difference in distribution between insurance status and educational level at X2=75.85, P-value= 0.001. With regards to marital status, 239 (76.8%) of the insured and 161 (53.5%) of noninsured participants were married whereas 47 (15.1%) of insured and 114 (37.9%) noninsured patients were unmarried. The rest of the respondents were either widowed or divorced. The study participant distribution had a statistically significant difference in distribution between insurance status and marital status at X2=42.97, P-value= 0.001.
| Variables | Response category | Community- based health insurance status | Test Statistics | ||||
|---|---|---|---|---|---|---|---|
| Insured | Noninsured | ||||||
| (n1=311) | (n2= 301) | ||||||
| Freq. | % | Freq. | % | X2 | p-value | ||
| Health Center | HC (1) | 85 | 27.3 | 172 | 42 | 76.048 | 0 |
| HC (2) | 62 | 19.9 | 35 | 15.8 | |||
| HC (3) | 49 | 15.8 | 19 | 11.1 | |||
| HC (4) | 82 | 26.4 | 30 | 10 | |||
| HC (5) | 33 | 10.6 | 45 | 15 | |||
| Age | 18 - 30 Years | 90 | 28.9 | 134 | 44.5 | 18.262 | 0 |
| 31- 44 Years | 117 | 37.6 | 97 | 32.2 | |||
| 45 - 64 Years | 82 | 26.4 | 60 | 19.9 | |||
| ≥ 65 Years | 22 | 7.1 | 10 | 3.3 | |||
| Sex | Male | 228 | 73.3 | 185 | 61.5 | 9.789 | 0.002 |
| Female | 83 | 26.7 | 116 | 38.5 | |||
| Education | Uneducated | 141 | 45.3 | 64 | 21.3 | 75.853 | 0 |
| Able to read and write | 84 | 27 | 55 | 18.3 | |||
| Primary education | 38 | 12.2 | 55 | 18.3 | |||
| Secondary education | 36 | 11.6 | 78 | 25.9 | |||
| TVET@ | 12 | 3.9 | 49 | 16.3 | |||
| Marital Status | Unmarried | 47 | 15.1 | 114 | 37.9 | 42.977 | 0 |
| Married | 239 | 76.8 | 161 | 53.5 | |||
| Divorced | 12 | 3.9 | 12 | 4 | |||
| Widowed | 13 | 4.2 | 14 | 4.7 | |||
| Occupation | Private employee | 8 | 2.6 | 22 | 7.3 | 18.173 | 0 |
| Farmer | 281 | 90.3 | 243 | 80.7 | |||
| Unemployed | 30 | 9.7 | 58 | 19.3 | |||
Table 1: Socio-demographic characteristics of the study population at visiting outpatient service in Tehuledere district, South Wollo Zone, Amhara Region, April 2017 (n= 612).
The table 1 presented the socio -demographic characteristics of the study participants. The information depicted identification of contracted health centres, age, sex and educational status, marital status and occupation of outpatients. The result resented includes: Chi- Square test and P-value for checking distribution of insured and non- insured patients.
Health service utilization
All interviewed patients in both groups have visited the outpatient department for primary health service utilization while 108 (34.7%) of the insured and 118 (39.2%) noninsured group have received laboratory service. In addition, 308 (99%) of the insured and 296 (98.3%) of the noninsured group have been served in pharmacy units in five health centres. Regarding the pharmaceutical services, 229 (73.6%) of the insured and 201 (68.8%) of noninsured have collected drugs and supplies from the health centre. Concerning waiting time spent between reaching health center and seeing their first health care provider, 18 (5.8%) of the insured and 36 (12%) of the noninsured respondents experienced a waiting time of less than 30 minutes while 103 (33%) of the insured and 106 (35%) of the noninsured experienced a half an hour to an hour waiting time.
Perceived satisfaction
Figure 1 depicts the perceived satisfaction levels of the study population. The overall satisfied proportion of the respondents was 475 (77.6%; 95% CI=74.1% - 80.9 %). A little over threefourths of the insured group,247 (79.4%; 95% CI=74.5% - 83.8%) were satisfied with the primary health care and, three-fourth of noninsured group, 228 (75.7%; 95%CI=70.5% - 80.5 %) were satisfied with the primary health care services. The mean score of availability of medicine for all illnesses was 2.81±1.036 and 3.30±0.946 among insured and noninsured outpatient service beneficiaries respectively. Perceived satisfaction on the availability of all drugs was significantly high among noninsured than insured service beneficiaries with t=-6.087, df=610, P=0.000. The mean score of patients on health care providers’ level of compassion and their support to patients was 3.34±0.868 and 3.22±0.924 among insured and noninsured outpatient service beneficiaries respectively. Insured patients positively perceived at t = 3.739, df = 610, P = 0.000. Similarly, facility assistances were perceived as friendly and helpful for patients among insured than noninsured with t =3.198, df =610, P = 0.001. Availability of an alternative payment option, cost of service payments and cost of prescribed drugs were more positively perceived by insured patients than noninsured patients at P = 0.000 (Table 2). The mean score with Standard Deviation of the satisfaction score was 86.14 ± 14.99 among insured and 83.85 ± 17.16 among noninsured under the CBHI scheme respectively. An independent sample t-test showed statistically significant differences where insured patients have a higher mean satisfaction scores than their counterpart noninsured patients with t=2.031, df=610, P=0.043 (Table 2).

Figure 1. Level of satisfaction in insured and noninsured under CBHI in Tehuledere district, Amhara Region, April 2017.
| Indicators of health service quality | Insured (N=311) | SD | Noninsured (N=301) | SD | t-test | P-Value |
|---|---|---|---|---|---|---|
| Mean | Mean | |||||
| Perceived availability of health care providers, supplies and physical resources | ||||||
| Medical supplies and equipment are sufficient | 3.08 | 1.128 | 2.92 | 1.072 | 1.8 | 0.072 |
| Rooms are sufficient | 3.04 | 1.051 | 2.9 | 1.041 | 1.673 | 0.095 |
| Adequate/appropriate healthcare providers for women | 2.95 | 0.932 | 3.1 | 1.014 | -1.797 | 0.073 |
| There are sufficient, high-quality healthcare providers | 3.33 | 0.934 | 3.19 | 1.017 | 1.757 | 0.079 |
| Availability of laboratory service | 3.29 | 0.957 | 3.15 | 1.022 | 1.79 | 0.074 |
| Medicine for all illnesses is always available | 2.81 | 1.036 | 3.3 | 0.946 | 6.087 | 0 |
| Perceived quality of health care delivery | ||||||
| Healthcare providers conduct quality diagnostic exams | 3.02 | 1.001 | 2.89 | 0.987 | 1.605 | 0.109 |
| Healthcare providers make appropriate drug prescriptions | 3.12 | 0.923 | 3.24 | 1.033 | 1.518 | 0.129 |
| The quality of drugs prescribed is good | 3.25 | 0.861 | 3.13 | 0.943 | 1.572 | 0.116 |
| Treatment provided is efficient and effective | 3.34 | 0.868 | 3.22 | 0.924 | 1.588 | 0.113 |
| Perceived quality of health care provider conduct | ||||||
| Healthcare providers show compassion and support for patients | 3.57 | 0.796 | 3.3 | 0.965 | 3.739 | 0 |
| Healthcare providers are respectful to patients | 2.98 | 0.952 | 3.1 | 0.984 | 1.437 | 0.151 |
| Healthcare providers provide quality follow-up care | 3.32 | 0.97 | 3.2 | 1.016 | 1.524 | 0.128 |
| Healthcare providers are welcoming during consultations | 3.21 | 0.976 | 3.08 | 1.033 | 1.592 | 0.112 |
| Healthcare providers respect patient confidentiality | 3.35 | 0.955 | 3.2 | 1.052 | 1.862 | 0.063 |
| Facility assistants are friendly and helpful to patients | 3.59 | 0.837 | 3.35 | 1.011 | 3.198 | 0.001 |
| Facility assistants respond to patients’ questions | 2.92 | 0.974 | 3.06 | 0.998 | 1.799 | 0.072 |
| Perceived financial and physical accessibility to care | ||||||
| Alternative payment options are available | 3.51 | 0.811 | 3.17 | 1.071 | 4.418 | 0 |
| The cost of services is manageable | 3.53 | 0.871 | 3.24 | 1.034 | 3.815 | 0 |
| The cost of prescribed drugs is manageable | 3.56 | 0.832 | 3.19 | 1.071 | 4.782 | 0 |
| Distance to the facility is accessible | 3.39 | 1 | 3.24 | 1.069 | 1.83 | 0.068 |
| Healthcare providers give sufficient time to their patients | 3 | 1.043 | 3.16 | 1.068 | 1.907 | 0.057 |
| Waiting time from entering the facility to see the healthcare provider | 2.87 | 1.076 | 2.7 | 1.021 | 1.969 | 0.049 |
| Perceived physical structure of the facility | ||||||
| Health facility is clean and orderly | 3.14 | 1.085 | 2.98 | 1.034 | 1.806 | 0.071 |
| Easy to identify location of specific services at facility | 2.71 | 1.063 | 2.56 | 0.963 | 1.778 | 0.076 |
| Patients feel comfortable and safe while waiting | 3.26 | 1.022 | 3.12 | 1.066 | 1.708 | 0.088 |
| Convenience of access to the facility | 3.28 | 1.017 | 3.14 | 1.047 | 1.641 | 0.101 |
| Overall satisfaction | 86.14 | 14.99 | 83.85 | 17.16 | 2.031 | 0.043 |
Table 2: Indicators of level of satisfaction between the insured and noninsured group on health services in Tehuledere district, South Wollo Zone, April 2017 (n=612).
The table 2 presented the result of 27 Likert Scale reported Perceived quality of care with its associated mean score, Standard Deviation, t- test and p-values. The main categories are: perceived availability healthcare providers, supplies and physical resources; perceived quality of health care delivery; perceived quality of health care conduct; perceived financial and physical accessibility of care; perceived physical structure of the health facility and overall satisfaction of patients.
Objective measurement of quality of care
Table 3 presents the objective quality of care measurement of outpatient beneficiaries. Among 612 respondent patients 117 (38.0%) of insured and 134 (45.0%) of the non-insured under CBHI scheme were seeking treatment for their illness within one to two days. Seeking health care services do not show significant statistical difference by insurance status with X2=3.952, P-value= 0.267. Diarrheal disease was the most prevalent reason for visiting health centres with 78 (25.0%) and 86 (29%) for insured and noninsured patients under CBHI respectively. Reasons for visits to health centres were not statistically different between insured and non-insured outpatients with X2= 3.67, P-value= 0.45. With regards to consultation and diagnosis, insured patients reported that healthcare workers used a stethoscope (133; 43%), properly examined them (196; 63%), took down their history of past illness (253; 81%), asked treatment taken before arrival at health centers (241; 77%) and explained the diagnosis to them (215; 69%). Noninsured patients on the other hand reported that healthcare workers used a stethoscope (157; 52%), properly examined them (214; 71%), took down their history of past illness (269; 89%), asked treatment taken before arrival at health centers (268; 89%) and explained the diagnosis to them (232; 77%). Results showed that the consultation and diagnosis service is better performed among noninsured rather than insured patients on the use of a stethoscope, proper examination, taking note of history of past illnesses, asking about history of treatment taken before arrival at the health facility and explaining of diagnosis to patients by health care providers with X2= 4,509 to 14.664, P-value < 0.05.
| Objective characteristics of quality of care | Insured (N=311) | Noninsured (N=301) | Pearson X2 | P-Value | ||
|---|---|---|---|---|---|---|
| Number | % | Number | % | |||
| Days between the onset of illness (sign & symptoms) and seeking facility care | ||||||
| <1 | 66 | 21% | 59 | 20% | 3.952 | 0.267 |
| 1 to 2 | 117 | 38% | 134 | 45% | - | - |
| 3 to 4 | 80 | 26% | 61 | 20% | - | - |
| 5+ | 48 | 15% | 47 | 16% | - | - |
| Reason for visit | ||||||
| Diarrhea | 78 | 25% | 86 | 29% | 3.679 | 0.451 |
| Fever | 48 | 15% | 35 | 12% | - | - |
| Cough, chest pain | 65 | 21% | 66 | 22% | - | - |
| Injuries | 55 | 18% | 44 | 15% | - | - |
| Other# | 65 | 21% | 70 | 23% | - | - |
| Consultation and diagnosis (Yes 1, No =0) | ||||||
| Did the provider weigh the patient | 41 | 13% | 38 | 13% | 0.042 | 0.837 |
| Did the provider measure the temperature of the patient | 77 | 25% | 60 | 20% | 2.05 | 0.152 |
| Did the provider use a stethoscope | 133 | 43% | 157 | 52% | 5.414 | 0.02 |
| Did the provider examine the patient (head to toe) | 196 | 63% | 214 | 71% | 4.509 | 0.034 |
| Did the provider ask about history of past illness | 253 | 81% | 269 | 89% | 7.84 | 0.005 |
| Did the provider ask about history of present illness | 304 | 98% | 292 | 97% | 0.328 | 0.567 |
| Did the provider ask if treatment was taken before arrival at facility | 241 | 77% | 268 | 89% | 14.564 | 0 |
| Did the provider explain the diagnosis to the patient | 215 | 69% | 232 | 77% | 4.903 | 0.027 |
Table 3: Characteristics and objective quality of care by insurance status, Tehuledere, Ethiopia, April 2017.
The Table 3 presented the descriptive statistics report on objective quality of care measurements by insurance status. The variables reported includes: days spent between onset of illness and visiting health facility; reason for facility visit; consultation and diagnosis services with their respective Chi-Square test results.
Factors affecting client satisfaction
A bi-variable and multivariable linear regression analysis was done to compare factors influencing overall patient satisfaction score among patients who are insured and noninsured under CBHI scheme (Table 4). On one hand, the multivariable linear regression result showed that α (constant value) of 68.57 and an adjusted β values of 0.358 at cost of service, 0.383 at cost of drugs and 0.116 at the history of treatment for insured outpatients on overall satisfaction score. This result revealed that one standard deviation increased overall patient satisfaction score will have a change in 0.358 at cost of service, 0.383 at cost of drugs and 0.116 at the history of treatment standard deviation for independent variables. The following multivariable linear regression model predicts overall patient satisfaction among insured patients. The cost of services, cost of drugs and history of treatment (r2=0.571) explained 57.1% of the overall satisfaction score among insured outpatients.
| Variable overall patient satisfaction | Insured | Noninsured | ||||||||
|---|---|---|---|---|---|---|---|---|---|---|
| uβ | s.e. | sβ | 95% CI | P- value | uβ | s.e. | sβ | 95% CI | P- value | |
| Constant | 68.57 | 5 | - | (58.72, 78.43) | 0 | 65.62 | 4.92 | - | (55.94,75.31) | 0 |
| Age (Continuous) | -0.0718 | 0.044 | 0.068 | (-0.15, 0.015) | 0.106 | -0.106 | 0.051 | 0.081 | (-0.207,-0.005) | 0.039 |
| Sex (Male= 1, Female = 0) | -0.358 | 1.26 | 0.011 | (-2.85, 2.13) | 0.778 | -5.773 | 1.185 | 0.164 | (-8.10,-3.44) | 0 |
| Education (literate=1, illiterate =0) | 2.415 | 1.24 | 0.085 | (-0.03, 4.86) | 0.053 | -3.538 | 1.589 | 0.084 | (-6.66, -0.41) | 0.027 |
| Marital status (married =1 unmarried= 0) | -0.275 | 1.34 | 0.008 | (-2.91, 2.36) | 0.838 | 2.475 | 1.215 | 0.072 | (0.08, 4.86) | 0.043 |
| Cost of health service (very high 1, very low 5) | 11.563 | 1.91 | 0.358 | (7.78, 15.33) | 0 | 18.177 | 1.818 | 0.518 | (14.60, 21.75) | 0 |
| Cost of prescribed drugs (very high 1, very low 5) | 12.127 | 1.86 | 0.383 | (8.46, 15.79) | 0 | 13.259 | 1.809 | 0.375 | (9.69, 16.82) | 0 |
| Did provider measure your weight (Yes =1, No= 0) | 2.338 | 1.89 | 0.056 | (-1.38, 6.06) | 0.218 | -0.352 | 2.146 | 0.007 | (-4.57, 3.87) | 0.87 |
| Did provider measure temperature (Yes= 1, No = 0) | 0.26 | 1.63 | 0.008 | (-2.96, 3.48) | 0.874 | -2.199 | 1.839 | 0.051 | (-5.81, 1.42) | 0.233 |
| Did the provider use stethoscope (Yes =1, No= 0) | 2.599 | 1.39 | 0.09 | (-0.15, 5.35) | 0.064 | 2.693 | 1.18 | 0.078 | (0.37, 5.01) | 0.023 |
| Did the provider properly examined the patient (Yes =1, No= 0) | -0.86 | 1.23 | 0.029 | (-3.28, 1.56) | 0.485 | 3.061 | 1.314 | 0.081 | (0.47, 5.64) | 0.02 |
| Did the provider asked history of past illness (Yes =1, No= 0) | 0.618 | 1.64 | 0.017 | (-2.61, 3.85) | 0.707 | 2.871 | 1.905 | 0.052 | (-0.87, 6.62) | 0.133 |
| Did the provider ask history of present illnesses (sign and symptoms)? | -2.005 | 3.71 | 0.021 | (-9.32, 5.31) | 0.59 | 4.355 | 3.342 | 0.043 | (-2.22,10.93) | 0.194 |
| Did the provider ask if treatment was taken before arrival at facility (Yes =1, No= 0) | 3.96 | 1.55 | 0.116 | (0.89, 7.02) | 0.012 | -1.118 | 2.006 | 0.02 | (-5.06, 2.83) | 0.578 |
| Did the provider explain the diagnosis to the patient (Yes =1, No= 0) | 0.295 | 1.36 | 0.01 | (-2.40, 2.98) | 0.83 | 4.278 | 1.532 | 0.105 | (1.26, 7.29) | 0.006 |
Table 4: Comparison of unadjusted and adjusted linear regression coefficients for mean overall patient satisfaction score by insurance status and dimensions of independent variables, Tehuledere, South Wollo, April 2017.
The table 4 presented the statistics of multivariable linear regression analysis. The result helps to compare the main predictor variables by insurance status of study participants.
Patient satisfaction (insured) = 68.57 + 0.358* cost of service + 0.383* cost of drugs + 0.116* history of treatment + 0.
The results showed that α (constant value) of 65.62 and an adjusted β values of -0.081at age, -0.164 at sex, at -0.084 at education, 0.072 at marital status, at 0.518 at cost of service, 0.375 at cost of drugs, .0.078 at use stethoscope, 0.081 at proper examination, 0.105 at diagnosis explained for noninsured outpatients on overall satisfaction score. One standard deviation increase in the overall satisfaction score will have a change in -0.081, -0.164, -0.084, 0.072, 0.518, 0.37, 0.078, 0.081, and 0.105 times standard deviation on independent variables. The age, gender, educational status, marital status, cost of services, cost of drugs, use of a stethoscope, proper physical examination and explaining the diagnosis to patients (r2 =0.698) explained 69.8 % of the overall satisfaction score among non-insured outpatients. The following multivariable linear regression model predicts the overall patient satisfaction score among noninsured patients.
Patient satisfaction (noninsured) = 65.62 + -0.081*age + -0.164*Sex + -0.084*educ + 0.072*Marital status + 0.518* cost of service + 0.375* cost of drugs + 0.078* use of stethoscope + 0.081* proper examination + 0.105* diagnosis explained + 0
The variability (r2) explained by the socio-demographic characteristics, perceived and objective measurement of quality of care 57.1% and 69.8% of insured and non-insured outpatient satisfaction score, respectively.
The Ethiopian Federal Ministry of Health in its journey towards Universal Health Coverage, achieving equity and quality of primary health care services and avoiding financial risk of its citizens gets the desired level of interventions to be implemented during the second growth and transformation strategic period (2015-2020) [6-8]. During the last decade, the Ethiopian public health sector implemented equity and quality initiatives and piloted the community-based health insurance scheme which it strives to scale up to 80% of households’ coverage at 80% of woredas, the lowest administrative units, by the year 2020. These strategies and interventions are in line with the global commitment of Sustainable Development Goals (SDGs) set to be achieved by 2030 in which quality of care and financial risk protection is relevant to the first sustainable development goal of ‘no poverty’, the second sustainable development goal of ‘zero hunger’ and the third sustainable development goal of ‘good health and well-being for people’ and the tenth sustainable goal of ‘reducing inequality’ [28]. Despite the significant relationship of quality of care, and patient satisfaction by insurance status, few studies have been documented. Therefore, this study aimed at comparing patient satisfaction using perceived and objective measures of quality of care between insured and non- insured service beneficiaries under the CBHI scheme in Tehuledere woreda, north east, Ethiopia. Overall this study revealed that there is a significant difference in perceived quality of care scored between insured and noninsured patients. However, with objective measurement of quality of care, noninsured patients received higher perceived quality of care than their counterpart insured patients.
The findings of this study show that a slightly higher than three fourth 77.6% (95%CI=74.1% -80.9 %) of patients were satisfied with the services. However, it was also revealed a high proportion (79.4%) of insured patients is satisfied when compared to 75.7% noninsured out patients. An independent sample t-test was conducted to compare the overall satisfaction score for insured and noninsured patients under CBHI. There were significant differences in scores (M=86.14 ± (SD) 14.99) among insured and (M=83.85 ± (SD) 17.16) among noninsured under CBHI scheme; t (610)=2.031, P=0.043 (two tailed) (Table 3). This finding is nearly in line with a study conducted in India where 82% of insured and 73 % of noninsured clients were satisfied with the services received [17]. The findings of this study also reveal that the difference was statistically significant where insured patients have a higher mean of satisfaction score than their counterpart noninsured with (t=2.031, df =610, P=0.043). This is similar to a study conducted in Ghana that found a statistically significant difference in the satisfaction of currently insured and noninsured clients [29]. Although the findings differ from a study conducted in Burkina Faso and Ghana where the studies reported high overall satisfaction score among insured than non-insured patients, but the difference were not statistically significant at P<0.05 [18,30]. The reported magnitude of satisfaction score in this study indicates a high proportion of patients when compared with other studies were 62% West Shoa, 65% Addis Ababa, 57% Jimma and 54% Welaita, in Ethiopia [13,14,15,30]. However, the result of this study shows lower overall patient satisfaction proportion when compared with another study conducted in Ghana where 88% of insured and 86% of noninsured were either very satisfied or satisfied with the healthcare services [12]. This difference could be explained by the experience of patients and cultural values of patients for time, infrastructure, and cost of services. Moreover, the study area may influence patient experience, while this study was conducted in Health Center, other include hospitals.
In this study, socio-demographic characteristics like age, sex, education and marital status didn’t show a significant effect on overall satisfaction scores among insured patients. However, characteristics like older age, males, education levels and the unmarried status of noninsured patients significantly related to reducing overall satisfaction score. This finding was in line with a study conducted in China and Pakistan where males had a lower level of satisfaction [19,31].
The availability of medicines for all illness was found to have a statistically significant difference between insured and noninsured outpatients under the CBHI scheme. This finding was consistent with a study conducted in Ghana where pharmacy service is the cause of dissatisfaction [12]. However, our finding is different from a study conducted in Burkina Faso, which did not show any statistical difference between the insured and noninsured groups on the availability of medicines for all illness [18]. Obviously, health care service is measured with its curative outcome where availability of drugs and supplies would have vital role. Therefore, clients who receive prescribed drugs feel they will be cured and feel satisfied rather than clients who cannot find their prescribed drugs.
The result of this study showed that insured outpatients were positively perceived quality of health care providers and their assistants conducts as friendly and helpful than their counter part noninsured patients. The comparison of mean scores was fund statistically significant difference.
This is in line with a similar study conducted in Burkina Faso [18]. While this finding showed a statistically significant difference between the insured and noninsured groups on the compassion and support provided to patients by healthcare providers a similar study conducted by Robyn et al did not show any statistical difference [18].
The cost of health care is directly related to patient satisfaction. In this study, the cost of services and prescribed drugs were more affordable to insured than noninsured patients. This finding is also consistent with a study conducted in Burkina Faso in which the cost of services and prescribed drugs are perceived as manageable by insured groups and showed a statically significant difference between the insured and noninsured groups [18,24].
With regards to waiting time, insured patients have perceived the time they spent to get health services as fair than their counterparts which is also statistically significant (P=0.043). This finding is in line with a study conducted in Ghana [21]. This finding was also consistent with studies conducted in Bangladesh, Ghana, Botswana and Ethiopia where shorter waiting time creates high level of satisfaction of clients [12,15,17,32,33]. This can be explained by the value the rural community gives for time. In this study, there is no statistical difference in relation to on-set of illness, reasons for health facility visit and health-seeking behavior by CBHI enrollment status (P=0.267) which is consistent with a study conducted in Burkina Faso [18].
With regards to consultation and diagnosis services, in this study it was documented that a noninsured outpatient 5.4 times examined using stethoscope, 4.5 times served complete physical examinations 1.84 times higher in inquiring about their history of past illness, 14.56 times in inquiring about history of treatment resumed before current consultation and 4.9 time in receiving information on their diagnosis than their counter part insured patients. This finding was in line with Duku et al and Robyn et al reports of the assessment on the quality of care and insurance status in Ghana and Burkina Faso, respectively.[18,21]. In addition, our findings on objective quality of care services specifically on the use of a stethoscope and complete physical examination were similar to a study conducted in Burkina Faso [18].
The study design was cross sectional health facility-based survey design; therefore, a cause and effect relationship could not be established. In addition, this study does not address health care providers’ perceptions of effects of community-based health insurance on access, equity and quality of services.
The study finding shows that insured patients perceived with a higher level of quality of care and satisfaction score. However, non-insured patients received high proportion score on objective quality of care measurements of comprehensive diagnosis and consultation services. Therefore, to improve patient experiences at health centers and achieve the achieve financial risk protection through functional CBHI, program managers and health care providers should ensure quality of services to the standards at the health facility to insured and noninsured community members. Moreover, the health center managers need to fulfil the availability of essential drugs to reduce dissatisfaction of insured patients and attract more members to the CBHI scheme. Operational research using rigorous methods like community based matched case control study and exploratory qualitative study to understand the perception of health care providers are recommended.
Ethical Approval and consent to participate
The research protocol of this health facility based cross sectional study was reviewed and ethical clearance was obtained from institutional review board (IRB) of Wollo University. An official letter of permission was submitted to Tehuledere district, and the five health centers’ administrations. An informed written consent was obtained from all study participants after providing brief explanations about the purpose and procedure of the study. To maintain the confidentiality of collected data, anonymity was maintained throughout the research process. Furthermore, the right to withdraw from participation at any time was respected.
Acknowledgment
The authors acknowledge the Institute of Public Health, College of Medicine and Health Sciences, University of Gondar. The authors would also like to thank all each health facility staffs, data collectors, supervisors and all mothers who participated in this study for their commitment in responding to the interviews.
Consent for publication
Not Applicable.
Availability of data and materials
The datasets used and/or analyzed during the current study are available from the corresponding author on reasonable request.
Competing interests
The authors declare that they have no competing interests.
Funding
MDA; BFD; ZTT; SAM; WSA; ADM; AHF, TAB, TTH received salary support during analysis and write up of this manuscript from their employers.
Authors Contribution
The authors’ responsible were as, AFA, AYD, MDA, BFD, ZTT, TRM, NB, TY, SAM, WSA, AHF, ADM, TA, TT, LN, ASB, S, & AAA. AFA, NB, TY, & MDA: designed the research. AFA, NB, & TY supervised the data collection and ensure the quality of collected data. AFA, AYD, MDA, BFD, ZTT, TRM, NB, TY, SAM, WSA, AHF, ADM, TAB, TTH, LNA, ASB, AAA & SY. AFA, NB, TY, & MDA analyzed, interpreted the findings and drafted the manuscript. MDA the corresponding author submitted the paper for publication. All authors reviewed the manuscript and approved the final version for submission. No funding has been obtained from any source to carry out this study.
The authors would like to express their gratitude to Wollo University for facilitating the research activity. We are indebted to all data collectors and supervisors for their dedication and efforts during the process. We are thankful to all participants of this study for their time and invaluable responses. Finally, we are indebted to USAID: Transform Primary Health Care project for their support in the analysis and write up of this study.
Citation: Abera AF, Desale AY, Argaw MD, Desta BF, Tsegaye ZT, Mavundla TR, et al. (2020). Patient Satisfaction with Primary Health Care Services between Insured and Non-insured patients under Community-Based Health Insurance Scheme: A Comparative Cross- Sectional Facility Based Study in North East Ethiopia. Fam Med Med Sci Res 9: 245.
Received: 29-Jan-2020 Accepted: 16-Apr-2020 Published: 24-Apr-2020 , DOI: 10.35248/2327-4972.20.9.245
Copyright: © 2020 Abera AF, et al. This is an open-access article distributed under the terms of the Creative Commons Attribution License, which permits unrestricted use, distribution, and reproduction in any medium, provided the original author and source are credited.