Journal of Molecular Imaging & Dynamics
Open Access
ISSN: 2155-9937
ISSN: 2155-9937
Research Article - (2012) Volume 2, Issue 2
Objectives: Retrieving the accurate time-tracer activity concentration curve of the blood (arterial input function) is mandatory for performing bio kinetic model analysis of dynamic PET data. Especially in small rodents, gathering the input function remains an active area of research as no generally applicable solution was found so far. While surgically catheterizing blood vessels of rodents is possible, it is labour intensive and time resolution of blood sampling is restricted due to the limited amount of overall blood and the procedure of blood withdrawal itself. Obtaining the input function from the PET images themselves seems thus to be favourable, but suffers from several factors, one of them being spill-in of adjacent tissues. Particularly in mice and for [18F]FDG, the spill-in complicates using the time-activity curve (TAC) from a region of interest (ROI) over the left ventricle (LV) because the signal of the ROI contains contributions from both, myocardial uptake as well as arterial blood activity. We propose non-negative matrix factorization (NMF) as an image based algorithm for separating myocardial tracer concentration from the blood input function. The aim of this study was to evaluate the potential of NMF as an image based algorithm for retrieving the input function by comparison with blood sampling and Factor Analysis (FA).
Method: The femoral arteries of eight mice were surgically catheterized. With the injection of [18F]FDG, a 60 minute PET scan was started during which arterial blood samples were manually drawn from the catheter. For analysis, NMF and FA were performed in a ROI placed over the LV. The NMF algorithm shares similarities with principal component analysis and FA, the advantage over the later two being its non-negativity constraint. For normalization of the NMF extracted curve, the peak value of tracer activity in an early image of the LV and a late blood sample was used. The normalized NMF curve was visually compared to the TAC retrieved from the blood samples and to the FA retrieved TAC. For a quantitative comparison of performance, Pearson correlation and square-root of sum of squares (RSS) between NMF/FA and blood sampling curves was calculated.
Results: TAC based on NMF, FA and arterial blood samples were obtained and compared in all 8 mice. The NMF derived curves described the blood sampling based curves visually significantly better than FA. Pearson correlation between NMF and blood sampling curves ranged from 0.21 to 0.92 with an average of 0.69. Pearson correlation for FA ranged from 0.46 to 0.81 with an average of 0.65. Mean RSS was 2.70E + 006 for NMF and 3.40E + 006 for FA.
Conclusion: In the examined parameters, visual accordance, Pearson correlation and RSS, NMF performs superior to FA and seems to be a promising method for the extraction of the input function from PET images of small rodents without the need for arterial blood sampling.
Keywords: Extraction Chromatography, Extraction, Mouse Imaging, Factor Analysis
Due to its ability for visualizing functional processes and precise quantification of radiotracer uptake, positron emission tomography (PET) became a widely used tool for small animal imaging. Besides the use of static imaging, acquired at a certain time point after the injection of a radiotracer, dynamic measurement for modelling of the radiotracer kinetics offers an important tool especially in preclinical imaging.
For quantification of the kinetic properties of the tracer, the precise knowledge of the arterial input function, defined as the tracer concentration in the arterial blood plasma during the analysis time, is mandatory. While in humans and larger animals such as primates or even rats, samples can be taken continuously using an arterial catheter, in mice, the necessary micro surgical preparation is labour intensive and limited regarding timing resolution due to the low total amount of blood in the animal [1]. This can lead to undersampling of the peak of the activity in the arterial blood, which appears in mice approximately 15 s after injection of the tracer into the tail vein. In addition, surgical intervention makes it difficult to perform repetitive studies in the same animal.
A feasible non invasive technique for gathering the input function in humans and animals down to the size of a rat is its derivation from the image data. The time activity information can be extracted from a region of interest (ROI) placed over a larger blood pool, e.g. the left ventricle (LV) or a larger blood vessel. In mice, the spatial resolution of modern PET scanners of 1.5 mm [2,3] in the central field of view (FOV) principally allows the extraction of the input function from the heart with a left ventricular end-diastolic diameter of approx. 5 mm [4]. However, in the case of [18F]fluorodesoxyglucose ([18F]FDG), this method is seriously affected by spillover from the myocardium into the blood pool [5].
To solve this problem, various methods have been suggested; data driven methods comprise principal component analysis (PCA) [6] and factor analysis [7]. Both of these approaches try to transform possibly correlated variables into a set of uncorrelated variables. Mathematically this can be seen as choosing a new basis in variable space by any projection in such a way that the greatest variance of the data lies on the first new basis vector. The old and the new base are related by rotation in variable space. When applied to time activity curves obtained from PET images of the LV, the principle of PCA and FA can be illustrated as following. The time activity curve (TAC) of each voxel is a mixture of the blood input function (InF) and, due to spill-in, the tracer uptake function of the myocardial tissue (MTUF). PCA and FA try to transform the old basis (the mixed TACs) into the new basis curves (InF and MTUF) with the assumption, that up to a multiplicative factor and Gaussian noise, InF and MTUF are the same in all voxels of the LV.
FA has been used to extract the InF from the LV of Monkeys [8], rats [9] and mice [10]. The smaller the animal is, the smaller the LV is and the more difficult is the extraction with image-based methods.
Unfortunately there is a major problem to overcome when using PCA or FA on PET images: Both methods allow negative values for the new basis. This is, of course, not physiological in the case of InF or MTUF.
This issue does not occur in non-negative matrix factorization (NMF). NMF was originally developed by Lee and Seung to recognize parts of human faces in a database by an algorithm [11]. As a matrix factorization method, NMF tries to split a matrix Y (n x m) into a matrix A (n x f) and a matrix X (f x m) so that
Y = AX (1)
The idea behind NMF is to use alternating minimization of the cost function D(Y||AX) which measures the distance between AX and Y ensuring non negativity. Lee and Seung originally implemented Euclidian distance and the Kullback-Leibler divergence in their algorithm [11], the first being optimal for Gaussian noise and the second for Poisson noise. Various alternative distance measures have been suggested for use with NMF [12].
NMF has found wide application in image processing [13], text analysis [14] or Bioinformatics [15]. In 2002, Lee et al. used NMF for separating left and right ventricle from the myocardium in dynamic PET [13O] water scans, but showed only qualitative results [16].
In 2011, Tian et al. report that an NMF derived function is a reliable, non-invasive method for correction of spill-over and partial volume effect in mice, but only used an image derived, three blood sample corrected, left ventricle input function as their gold standard [17].
In this study, we use NMF and FA to separate InF and MTUF and evaluate their results in mice qualitatively and quantitatively by comparison of each with input functions gained from arterial blood samples.
PET/CT scanning and animal models
PET/CT data acquisition was done using a Siemens Inveon small animal system (Siemens Preclinical Solutions, Siemens, Erlangen, Germany). The PET component of this system consists of 64 detector blocks in 4 rings with 25,600 lutetium oxyorthosilicate crystals of 1.5 mm x 1.5 mm x 10 mm each. The axial field of view is 12.7 cm and the transaxial field of view is 10 cm. The spatial resolution in the center of the field of view was found to be about 1.5 mm in radial and tangential direction [2,3]. The CT component consists of a variable focus x-ray source with a maximum anode current of 0.5 mA, a maximum spatial resolution of 15 μm and a 165 mm x-ray detector with 4064 x 4064 pixels covering a maximum field of view of 10 cm.
For the experiment, seven C57BL/6 mice (Charles River Laboratories, Wilmington, USA, 4 female, and 3 male) were used.
Animal preparation and data acquisition
All mice (mean weight: 23.27 g, range: 18.26 g - 32.12 g) were unfasted and anesthesized (1.0 to 1.5 %-Vol, Isoflurane) about 60 minutes before start of the data acquisition. Animals were warmed during the whole procedure. After surgical preparation of the femoral artery, a catheter (inner diameter 0.3 mm, outer diameter 0.6 mm, polyethylene, Smiths Medical, Kent, UK) was placed in the vessel. A second, intravenous, catheter was placed in the tail vein for injection of [18F] FDG.
PET data was acquired for 60 minutes in list-mode, starting with the injection of on the average 11.53 Mbq (range: 10.14 MBq – 12.36 MBq) [18F]FDG in around 300 μl solution per mouse as bolus within approximately 45 seconds. During PET acquisition, 15 to 17 blood samples of about 25 μl each were collected in around 10 seconds per sample through the femoral catheter on filter paper in preweighted test tubes. Ten samples were drawn within the first 90 seconds trying to keep the sampling frequency as high as possible. Blood activities were then measured using a gamma counter (Wallac Wizard, PerkinElmer, Walttham, USA).
PET acquisition was followed by a CT scan for use in attenuation and scatter correction. Mice were euthanized after the end of the data acquisition.
Data processing and image based input functions
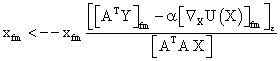
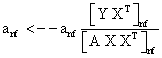
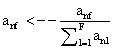
PET data was reconstructed with the standard built-in 2D filteredback projection algorithm including scatter and attenuation correction in 37 frames of 20 x 1 s, 4 x 5 s, 2 x 10 s, 4 x 60 s, 5 x 300 s, 2 x 900 s length. ROIs were placed in the LV of the mice and NMF was applied to the TAC of the voxels within this ROI yielding the NMF InF. Euclidean distance, Kullback-Leibler divergence and Gibbs regularized euclidean cost function (GcF) were tested for application in NMF; GcF was found (not shown here) to give the best results (by standard of our investigated parameters, visual accordance, Pearson correlation and RSS explained below). Applying GcF to NMF was suggested by Zdunek and Gibbs [18] to be useful for separating locally smooth non-negative signals. Using this approach, the following update rules were implemented:
 (2)
(2)
 (3)
(3)
 (4)
(4)
Whereas,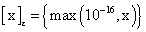 and
and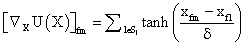 with
with defining the set of nearest neighbors. n is representing the number of voxels included in a ROI over the LV, m is the number of frames of the dynamic scans, whereas f would be 2. The rows of Y consist of the mixed time activity curves in the ROI over the LV, one row of X represents the InF, the other row the MTUF.
NMF returns results in arbitrary units. For normalization purposes, the peak activity of an image derived InF was used, which occurs approximately within the first 20 seconds after injection and thus is not be influenced by spill in of the myocardium in [18F]FDG studies. Least squares estimation was used on the first 60 seconds of the NMF InF and the blood sampled InF for calculation of a multiplicative normalization parameter.
It was found that the free parameter α controls the height of the tail part of the NMF derived InF curve and that no constant value could be used in this study. Thus, α was chosen such that the activity value by the time point of the last blood sample would match the NMF derived InF activity value.
FA with two factors was calculated in ROIs over the LV. Like NMF, FA returns results in arbitrary units. Because FA allows negative values, the calculated curves are scaled and have an offset. Thus for normalization two parameters are needed. Similar to NMF, the peak activity of the LV and the last blood sample were chosen.
Pearson correlation, corresponding significance and RSS were calculated between normalized NMF/FA InF and the InF obtained with arterial blood sampling for each mouse.
TAC based on NMF, FA and arterial blood samples were obtained in all 8 mice. As an example, for mouse 4, Figure 1 shows time - activity concentration curves of the InF gained from blood sampling and the NMF/FA derived InF for the full time scale of 60 minutes as well as for the first 90 seconds (top right) of the acquisition. Comparing NMF InF and blood sampling data in Figure 1, two major differences are noticeable: A peak time delay of approximately 10 seconds and a peak activity difference of about 25%. The peak time delay is true for all mice in the study and is explainable and expected by the amount of time which the blood takes to travel along the 10 cm length of the femoral catheter.

Figure 1: Blood sampling InF, NMF and FA extracted TACs for mouse 4; for the whole measurement time and for the first 90 seconds (top right).
A peak activity decrease of the blood sampled InF compared to NMF derived InF is true for almost all mice within the study and is probably due to the averaging when taking blood samples. As shown in Figure 1, the sampling interval of about 10 seconds within the first 90 seconds of the PET acquisition is twice the FWHM of the NMF derived peak which is about 5 seconds wide. A shorter catheter length and higher sampling frequency would address both delay and activity decrease, but was difficult to reach due to the practical drawbacks of manual sampling.
Considering the full time scale in Figure 1, InF gained from blood sampling and NMF derived InF are visually in very good accordance.
Compared to NMF in Figure 1, FA extracts two peaks within the first 20 seconds. For the duration of the first FA peak NMF calculates a constant activity. A possible reason could be the manual injection of the activity bolus through the tail catheter not having been as smooth as intended. The limited time resolution of the blood sampling does not suffice to decide whether NMF or FA derives the correct curve. Peak time delay and peak activity decrease for the second FA peak are almost identical to NMF.
Considering the FA InF in Figure 1, a third, broader peak is noticeable at the 45 second mark which is not seen in NMF and blood sampling. Bolus injection is done and cannot be the reason for this as the blood sampling curve confirms. Such a delayed peak of FA derived InF can also be seen in figures 2,3 and 4 and is true for five of eight mice in our study. While the activity in the LV is rapidly decreasing after bolus injection, activity of the surrounding tissue raises gradually. NMF seems to perform better in sharply separating these two activity curves than FA does.

Figure 2: Blood sampling InF, NMF and FA extracted TACs for mouse 6; for the whole measurement time and for the first 90 seconds (top right).

Figure 3: Blood sampling InF, NMF and FA extracted TACs for mouse 3; for the whole measurement time and for the first 90 seconds (top right).

Figure 4: Blood sampling InF, NMF and FA extracted TACs for mouse 2; for the whole measurement time and for the first 90 seconds (top right).
Figure 2 shows the results for mouse 6. In this example FA returns a noisy InF with, despite the normalization, negative values. The NMF derived InF on the other hand follows blood sampling much better in shape.
When considering the whole dataset (see additionally Figure 4 as an example), visual accordance between NMF and blood sampling is noticeably superior to the one with FA in our opinion. In search for parameters, which would describe the accordance of NMF and FA with the blood sampling curves quantitatively, Pearson correlation, significance (p-value) and RSS were calculated for all mice (Table 1).
| NMF | FA | |||||
| Mouse | Pearson corr. | Signif. | RSS | Pearson corr. | Signif. | RSS |
| 1 | 0.90 | <0.001 | 1.12E+006 | 0.77 | 0.001 | 2.21E+006 |
| 2 | 0.49 | 0.061 | 4.18E+006 | 0.62 | 0.013 | 6.51E+006 |
| 3 | 0.21 | 0.449 | 3.05E+006 | 0.46 | 0.086 | 3.31E+006 |
| 4 | 0.68 | 0.005 | 2.17E+006 | 0.81 | <0.001 | 3.31E+006 |
| 5 | 0.62 | 0.013 | 2.69E+006 | 0.51 | 0.052 | 3.01E+006 |
| 6 | 0.82 | <0.001 | 1.58E+006 | 0.53 | 0.040 | 2.13E+006 |
| 7 | 0.92 | <0.001 | 1.22E+006 | 0.74 | 0.002 | 2.05E+006 |
| 8 | 0.87 | <0.001 | 5.62E+006 | 0.76 | 0.001 | 4.64E+006 |
| Mean | 0.69 | 0.066 | 2.70E+006 | 0.65 | 0.024 | 3.40E+006 |
Table 1: Pearson Correlation and corresponding significance, squareroot of sum of squares calculated for blood sampling with NMF and FA.
Correlation values for NMF are high, with 0.69 (range 0.21 - 0.92) on average and the correlations are significant with p-values smaller than 0.05, except of 2 mice. NMF InF and blood sampling data for mouse 3, with the, for this study, exceptionally small Pearson correlation of 0.21 is shown in Figure 3. Two intersections are noticeable in the tail part of the curves. This is not true for the other mice in this study, where the NMF InF would normally stay slightly below the blood sampled TAC as in the example of mouse 4 presented in Figure 1. To intersect two times, the curves must have an inflection point, thus changing the sign of slope. The Pearson method tries to find a linear relationship within the data, high correlation arises when the two curves have the same sign of slope as time progresses, which NMF InF and blood sampled TAC for mouse 3 have not.
Pearson correlations for FA are also high with 0.65 on average (range 0.46 - 0.81) and significant (average 0.024). The overall correlation of FA is lower than of NMF with 0.69 on average. For the individual mice, five of eight NMF correlations for FA are higher than the corresponding ones for FA.
When comparing individual RSS values for NMF and FA, ones finds that seven of eight RSS values are lower for NMF than for FA. Also the mean RSS with 2.70E + 006 for NMF is lower than 3.40E + 006 for FA. These results are illustrated in Figure 5.

Figure 5: Squareroot of sum of squares calculated for blood sampling with NMF (blue) and FA. Only in mouse 8 the RSS value is higher for NMF than for FA, in all other mice NMF is performing better.
Measuring the input function is an unavoidable requirement for compartment modelling, which is regarded as one of the most promising ways of analysing dynamic PET data. Blood sampling remains the gold standard but suffers from several disadvantages for small rodents such as mice [1]. The microsurgical preparation of the animal is time consuming and labour intensive, in addition it is hardly applicable to repeated studies of the same animal. Due to practical considerations and the limited amount of arterial blood, manual sampling in mice has the disadvantage of low timing resolution leading to an undersampling of the peak of the blood activity. This is especially relevant in the beginning of the examination when fast changes in the activity concentration appear. For this reason image derived approaches are favourable and examined in the literature [1]. Therefore a large blood vessel or blood pool is necessary. For small rodents, the left ventricle is commonly used for direct extraction of the InF. However several radiotracers, including [18F]FDG, show physiological uptake in the myocardium. This leads to spill-in of the myocardial tracer uptake into the measured blood activity concentrations, especially in the later stages of the measurement for [18F]FDG. To overcome this problem, principal component analysis (PCA) and factor analysis (FA) were used to extract the blood activity curve [6,7]. Both methods have the disadvantage to allow the return of negative values being of course not physiological for the blood input function (InF) and the uptake in the myocardial tissue (MTUF).
In this work we presented an easy to implement method based on non-negative matrix factorisation (NMF) and compared it to the wellknown FA method. Two prerequisites are required for normalization of the NMF derived InF. One is the activity peak in a ROI over the LV, which appears within the first 60 seconds of the PET scan and is therefore unaffected by spill-in of the myocardium. The other is a late arterial blood sample which could be easily replaced by a veneous one.
FA derived curves have an offset and are scaled because of the allowed negative values. As for NMF, FA requires for normalization thus two known values, for which we chose the peak activity and a late sample. Because of the non-negative nature of NMF our method does not allow for unphysiological negative values, which we have observed for FA within our study even after normalization.
All obtained time activity curves with NMF showed visually noticeably better agreement than FA with our gold standard method, the TACs measured with arterial blood sampling. Additionally an artificial late peak after around 50 seconds occurs in FA calculated InF in five of eight mice which cannot be seen in NMF. This peak is not related to injection as blood sampling shows and thus indicates that NMF performs better in separating the InF from spill-in activity of the myocardium at the time when this effect starts to dominate.
In search for a parameter to represent our visual impression in one value, we used Pearson correlation and RSS. The Pearson correlation for NMF was in average 0.69 and statistically significant (p < 0.05) in 6 of the total eight mice. Mouse 3 showed a low correlation coefficient of 0.21 which might be explained by the existence of an inflection point in the curve as discussed in the results part. In our opinion, this leads to the relatively low correlation value, despite the good visual accordance. If mouse 3 is not taken into account the average Pearson correlation between the NMF curves and the curves obtained with arterial blood sampling is 0.76.
Pearson Correlation for FA was 0.65 on average and significant (mean p-value 0.024) and thus lower than NMF.
RSS is a parameter commonly used to quantify the quality of a fitted curve and thus seems to be suitable for our comparison of calculated curves and blood sampling. The smaller RSS is, the more two curves resemble each other. Mean RSS with 2.70E + 006 for NMF was lower than 3.40E + 006 for FA.
Both parameters, Pearson higher for NMF and RSS lower for NMF, support our visual impression and show that NMF performs superior to FA in extracting the InF within our study.
The disadvantage of image-based methods is that they rely on the calibration of the scanner which needs to be performed for each setting of reconstruction algorithm and parameters. However this effort still seems to be preferable compared to the effort of catherizing each individual animal and taking manual blood samples. Especially as, also considered as gold standard, arterial blood sampling is also susceptible to errors. When samples are taken manually it can be difficult to obtain the correct time stamp for each sample. This problem might be solved by the use of a microfluidic device [19]. Still there can be a problem with occlusion of the catheter in use during the examination.
Usage of alternative cost functions could potentially yield better results and remains for future work. Also, the effect of the chosen reconstruction algorithm and of noise in the images on the NMF extraction method will need to be investigated in a future study.
In this work, we separated the mix of InF and MTUF with the help of NMF and only used the InF information. In principle NMF allows for splitting a mix in more than two curves. If the two compartment [18F] FDG model [20] is valid for some tissue in a dynamic PET measurement, the voxels of this tissue would contain the additive mix of blood input function, [18F]FDG uptake function into the cells and phosphorylation curve of [18F]FDG within the cells. Separating this mix by NMF is theoretically possible and so would be using the [18F]FDG uptake curve and the phosphorylation function for a one compartment fit. Future studies will show the feasibility of such an approach.
In this study, we used NMF and FA to obtain an image based arterial input function in mice and compared both methods with arterial blood sampling. Visual accordance of InF between blood sampling as our gold standard and NMF was superior to FA for all eight mice. Unphysiologically negative values did not occur with NMF. Additionally in contrast to FA, NMF seems to perform better in separating the InF from myocardial spill in as no artificial late peak can be seen. Pearson correlation and sum of squares as quantitative parameters support these findings. NMF as an easy to implement method and is hence promising for the routine application.
We are grateful to Marco Lehmann for his excellent assistance in the laboratory, even during late hours. This project was funded in part by the Deutsche Forschungsgemeinschaft (SFB 824).