Journal of Thermodynamics & Catalysis
Open Access
ISSN: 2157-7544
ISSN: 2157-7544
Research Article - (2014) Volume 5, Issue 2
Biomass-coal co-firing has the potential to reduce SOx and net CO2 emissions from coal-fired power plants.Given the heterogeneity of biomass and coal feed stocks, the oxidation kinetic behavior of such blends is not wellunderstood. In this investigation, we probe the applicability of a variety of kinetic models to describe the fast oxidationof feed corn stover, Illinois No. 6 coal, and their blends using thermogravimetric analyzer. We find that a first order reaction assumption (often referred to as the Arrhenius Equation), as well as three-dimensional diffusion reaction models offer the best fit to the data as measured through correlation coefficients, and return reasonably similar activation energies. Derivative thermogravimetric curves show that peak mass loss rates occur within ~30K of each
other for each fuel and blend, though the peak mass loss rate is dependent on the specific fuel and blend. Evidenceof reaction synergism between the fuels in the blends, in the form of a non-additive activation energy predictionscheme, suggests that the biomass promotes decomposition of the coal at lower temperatures.
Keywords: Coal-biomass blend; Co-firing; Oxidation; Kinetics activation energy
In 2008 coal accounted for almost 50% of the electricity generated in the United States, while other renewables defined to include wind, solar and photovoltaic, geothermal, wood and wood-derived fuels, and other biomass accounted for a mere 3.1% of the total [1]. One possible method to reduce our reliance on fossil fuels while maintaining a constant supply of electricity is to co-fire biomass with coal in existing coal-fired boilers. This is a commonplace occurrence across many countries, where biomass is used to control the combustion process by increasing volatile matter content, providing a more stable flame [2,3]. While there are many studies from our European and Asian counterparts on coal-biomass co-firing, domestic United States coal supplies and available agricultural waste streams vary significantly from those with data currently available in the literature. In addition to probing the behavior of domestically available fuel sources, a second goal of this paper is to determine the applicability of various kinetic expressions to describe the activation energies of oxidation of coalbiomass blends.
Data are collected in an oxidative environment using a thermo gravimetric analyzer to cultivate an understanding of the oxidation characteristics of coal-biomass blends. While extrapolation to largescale combustion devices is not directly applicable with such data, thermo gravimetric analysis is useful from both a fundamental viewpoint in comparison among other samples [4-6]. These data are useful in modeling combustion for the co-firing of coal-biomass blends, as intrinsic char reactivity is a key factor affecting char burnout in pulverized coal utilization. As the timescale for combustion is considerably shorter than the time required to reach equilibrium, the kinetics are a strong controlling factor in coal-biomass combustion. Such data also enable analysis of the temperature range over which a material oxidizes, which is necessary to estimate combustion efficiency, and boiler specifications [7].We determine the activation energy of the oxidation reactions to provide necessary data to input into basic combustion calculations, such as residence time, temperature requirement, and efficiency [8].
There is some evidence in the literature that the pyrolysis decomposition in the absence of oxygen, and the first step in combustion of a solid fuel-of coal-biomass blends can be represented by a linear addition of the biomass and coal components [4]. However, whether this is the case for the behavior of coal-biomass blend oxidation is uncertain. With the complex nature of combustion, many suspect that the presence of oxygen leads to gas-phase reactions between the volatiles released and combustion of char generated during solid degradation [9,10]. In such a system, we have the potential for both homogeneous and heterogeneous reactions, leading to a more complete combustion, whereby the CO released via heterogeneous reactions undergoes oxidation in the gas phase [11].
A two-stage reaction kinetics model consisting of two independent reactions [4] to describe the thermal decomposition of coal-biomass blends in oxygen. Initially, the solids and oxygen react to form char and gas, followed by char oxidation to produce gas and ash [4] posit that the two separate reactions are governed jointly by a first-order Arrhenius equation, and test this using a high-volatile bituminous coal and pine sawdust blend. Three stages of decomposition at distinct temperature regions were observed, and attributed to (1) oxidative degeneration of the biomass (release and burning of volatiles), (2) combustion of char, and (3) a final stage attributable to coal. The temperature at which mass loss peaked was equal for each stage no matter the blend ratio, though as the percentage of biomass increased, the maximum rate of mass loss increased for the first stage and decreased for the second and third stages. Would attribute the first stage to the devolatilization and subsequent burning of the light organic volatiles followed by oxidation of the char [12].The first derivative peak in air is often attributed to the pyrolysis of hemicellulose and cellulose of the biomass [13].
Our laboratory explores the use of locally sourced, second generation biomass feed stocks as a blended fuel in coal-fired power plants in the Northeast and Mid Atlantic regions. This would curtail the importation of foreign coal by reducing overall SOx emissions resulting from the use of high-sulfur coals commonly found along the East Coast and further lower the carbon footprint of power generation by selecting fuels of local origin to minimize transport. While the temporal availability of feed corn Stover requires adaptability in processing, cofiring more or less coal and/or using different biomass sources can mitigate supply issues. Almost 4 million of the 97 million acres of corn planted in the U.S. in 2012 were in the Northeast and Mid-Atlantic States, providing a large biomass supply in a fairly concentrated area. Over 40% of the electricity generated in Pennsylvania, and 93% in West Virginia, comes from coal (U.S. EIA); by blending in locally-available biomasses sources the long-haul transport of fuel is reduced, and net CO2 emissions are therefore also reduced. In this paper, we investigate the oxidation behavior of feed corn Stover (FC), a seasonally available feedstock grown across the U.S., with Illinois No. 6 coal (IL), a coal that has been widely studies in the literature. More broadly, we probe the applicability of several different models and mechanisms to describe the behavior of coal-biomass blend oxidation.
Materials
A sample of Illinois No. 6 (IL) coal from the Argonne Premium coal bank was available in-house with particle size of 47-75 mm. The feed corn Stover (FC) was collected in early October 2011 from the Copal House Farm in Lee, NH, and dried in a laboratory oven overnight. It was ground and sieved to a particle size of less than 125 mm. This laboratory (and others) have shown that there is no apparent effect of particle size (between 125-250 μm, 250-300 μm, and 300-500 μm) on activation energy [14]. Blends (80:20, 50:50 Coal: FC by mass) were fabricated by measuring the desired mass, between 2 and 6 g, of each fuel to the 0.1 mg on a Shimadzu semi-microbalance into a glass vial and mechanically agitating with a Scilogex vortex mixer. (Table 1) gives the ultimate and proximate analyses of each of these solid fuels.
| wt% (Dry Basis) | Ill No. 6 Coal | Feed Corn Stover |
|---|---|---|
| C | 70.2 | 46.6 |
| H | 4.8 | 5.7 |
| N | 0.9 | 1.0 |
| S | 3.1 | 0.1 |
| O | 9.9 | 39.6 |
| Ash | 11.1 | 7.1 |
| Moisture | 4.2 | 4.5 |
Table 1: Elemental analysis of solid fuel samples (coal information provided by Argonne Premium Coal Bank; biomass performed by Hazen Research, Golden, CO).
Thermo gravimetric Analysis (TGA)
The solid fuels and their blends were oxidized in a Mettler Toledo TGA/DSC1 in high purity air, flowing at approximately 50 mL.min-1 with a high purity nitrogen flow of 20 mL.min-1 to protect the balance. Between 7 and 13 mg of sample were placed in a 70 mL alumina crucible. The mass was measured every second to the 10-8 grams, along with temperature to ±0.1 K. All samples were heated to 373K and held for 60 minutes to insure moisture removal. The temperature was ramped back down to 298K at -10 K/min and held for 5 minutes. Then the sample was heated at 100 K/min up to 1173K and held for 60 minutes to obtain a stable mass reading. Each sample was run at each temperature ramp rate a minimum of three times each to insure reproducibility.
Kinetic analysis
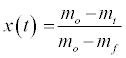
As a solid fuel oxidizes, it goes through a series of decomposition steps. Initially any water will leave the solid around 373-383K (at atmospheric pressure), followed by devolatilization, or pyrolysis, where the volatiles leave the solid matrix. These volatiles released from the solids then combust in the oxygen surrounding the particles. When the volatiles are exhausted, eventually the oxygen will diffuse to the surface of the solid and into its pores, leading to char oxidation. The extent of conversion, by mass, at any time, t, x(t), is determined from the TGA data as:
 (1)
(1)
Where m0 is initial mass, mt is mass at time t in seconds, and mf is any residual mass at complete decomposition.
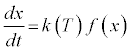
The thermal decomposition of solid fuels is often described by rearrangements of the Arrhenius equation, whereby the activation energy, Ea, is determined according to a conversion function, f(x),that describes the predominant behavior of the fuel, in conjunction with k (T), a temperature function, according to:
 (2)
(2)
The conversion function can include diffusion in one or multiple dimensions, and/or chemical or nucleation reactions in one or multiple dimensions. The temperature dependence of the rate constant, k, is often described by the Arrhenius equation:
 (3)
(3)
where A is the pre-exponential factor, R the Universal Gas Constant, and the temperature is always in absolute scale.
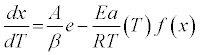
By substituting equation (3) into (2), and accounting for the constant temperature ramp rate, β ,used herein, we find:
 (4)
(4)
Via separation of variables, the integral form of the reaction model can be written:
 (5)
(5)
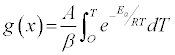
where g(x) describes the integral reaction model:
 (6)
(6)
Table 2 details the conversion functions investigated in this work. It is widely believed that the correct expression for g(x) is the one for which a plot of ln [g(x)/T2] versus 1/T yields a straight line from which Ea and A are calculated [15-18].
| Equation | Rate-Determining Mechanism | Differential Form  |
Integral Form  |
EqnNo |
|---|---|---|---|---|
| Diffusion Models | ||||
| Parabola Law | One-Dimensional Diffusion | 1/2x | x2 | D1 |
| Valensi Eqn. | Two-Dimensional Diffusion | -[ln(1-x)]-1 | (1-x)ln(1- x)+ x | D2 |
| Jander Eqn. | Three-Dimensional Diffusion | (3/2)(1-x)2/3[1-(1- x)1/3]-1 | [1-(1-x)1/3]2 | D3 |
| Ginstling-Brounshtein Eqn. | Three-Dimensional Diffusion | (3/2)[(1-x)-1/3-1]-1 | 1-2x/3-(1-x)2/3 | D4 |
| Zhuravlevl, Lesokin, Tempelman Eqn. | Three-Dimensional Diffusion | (3/2)(1-x)4/3[(1- x)-1/3-1]-1 | [(1-x)1/3-1]2 | D5 |
| Phase Boundary Reaction | ||||
| Power Law | Contracting Cylinder | 2(1-x)1/2 | 1-(1-x)1/2 | P1 |
| Power Law | Contracting Sphere | 3(1-x)2/3 | 1-(1-x)1/3 | P2 |
| Reaction-Order Models | ||||
| First-order | Chemical Reaction | (1-x) | X | R1 |
| Second-order | Chemical Reaction | (1-x)2 | [1/(1-x)]-1 | R2 |
| Third-order | Chemical Reaction | (1-x)3 | (1/2)[(1-x)-2-1] | R3 |
| Nucleation Models | ||||
| Mampel power law | Nucleation | (2/3)x-1/2 | x3/2 | N1 |
| Mampel power law | Nucleation | 2x1/2 | x1/2 | N2 |
| Mampel power law | Nucleation | 3x2/3 | x1/3 | N3 |
| Mampel power law | Nucleation | 4x3/4 | x1/4 | N4 |
| Exponential law | Nucleation | X | ln x | N5 |
| Avrami-Erofeev Eqn. | Random Nucleation and Subsequent Growth | 2(1-x)[-ln(1-x)]1/2 | [-ln(1-x)]1/2 | N6 |
| Erofeev Eqn. | Random Nucleation and Subsequent Growth | 3(1-x)[-ln(1-x)]2/3 | [-ln(1-x)]1/3 | N7 |
| Prout-Tomkins Ewn. | Branching Nuclei | x(1-x) | ln[x/(1-x)] | N8 |
Table 2: Solid-state reaction expressions examined in this work
It is common in the literature to apply a first order reaction rate mechanism to solid fuel decomposition – both oxidation and pyrolysis (see, for example, ref. [4,19,20]). This simple application of the Arrhenius equation is often referred to as the Reaction Rate Constant Method (RRCM). In this case, the explicit form of the Arrhenius equation is:
 (7)
(7)
Numerous studies of biomass, coal, and blend decomposition studies in the literature apply a reaction order of 1 to account for the simultaneous reactions occurring (see, for example, ref [14,21-23]). Given the high degree of linearity of the Arrhenius plots, this is often considered to be a reasonable assumption. We will compare the RRCM to other mechanisms’ results to explore the applicability of this oftemployed assumption.
There is considerable debate in the literature surrounding the nature, be it additive or synergistic, of the thermo chemical conversions of coal-biomass blends. Some studies offer evidence that the kinetics of oxidation of biomass and coal blends are additive in nature, such that each fuel contributes to the activation energy and peak devolatilization rates proportionally to its blend ratio [4]. Other studies suggest that synergistic reactions occur during biomass-coal co-firing that lower the overall activation energies for the combustion of blends as compared to an additive scheme [11,22,24].
(Figure 1) presents mass conversion versus temperature for the oxidation of FC, IL, and its blends at 100K/min. This (Figure 1) illustrates the complicated nature of solid fuel co-oxidation. As expected, the pure FC decomposes at lower temperatures than the IL. Find that the addition of pine sawdust to coal improves volatilization and gas phase combustion at lower temperatures [4]. What is notable about this (Figure 1) is the temperatures at which the blends reach final conversion. Below 825K, the 50:50 blend reaches a higher conversion at lower temperature than the 80:20 blend.

Figure 1: Conversion of pure and blended fuels oxidized at 100K/min;  Feed Corn;
  Illinois No. 6 Coal;
  80:20 Coal:Corn blend;
  50:50 Coal: Corn blend
Similarly, (Figure 2) presents the derivative thermo gravimetric (DTG) curves for each fuel and blend at 100 K/min, and (Figure 3) shows the rate and temperature for each of the two peaks of (Figure 2). We find that the first peak is dominated by biomass decomposition. (Figure 1) shows that a larger amount of biomass converts at lower temperatures, and in (Figure 2) we see that it happens at a higher rate than the coal and blends, indicating the higher reactivity and combustibility of biomass as compared to coal [25]. (Figure 3) illustrates the modest impact of blending on peak DTG temperatures. The FC, IL and blends show a first DTG peak between 570 and 600K, and there is no predictable relationship between fuel ratio and peak temperature, with the exception being that the biomass has the lowest peak temperature. This is not contradictory to the observations of (Figure 1). The amount of mass converted at each temperature is not necessarily related to the temperature at which a given blend sees its highest mass loss rate. The second DTG peak occurs at approximately 700K for the biomass, and at 800K for the coal and blends, though there appears to be no impact of blend ratio on peak temperature. Where we do see evidence of interaction between the fuels is in the peak mass loss rate for both Peaks 1 and 2. At lower temperatures (Peak 1), as the percent biomass increases, the peak mass loss rate also increases. The opposite is true at higher temperatures (Peak 2.) As can clearly be observed by the shape of the plot, this is not a strictly additive, or linear, trend. It is with these complexities in mind that we approach the kinetics analysis of the coal, biomass, and their blends’ oxidation.

Figure 2: DTG curves for 100K/min oxidation of Feed Corn; Illinois No. 6 Coal; 80:20 Coal: Corn blend; 50:50 Coal: Corn blend

Figure 3: Peak DTG temperature and rate for 100K/min oxidation as a function of wt% feed corn in blend  Peak 1 Temperature;
  Peak 2 Temperature;
  Peak 1 Rate;
  Peak 2 Rate
Reaction rate constant method
The RRCM, commonly applied to coal, biomass, and their blends’ oxidation kinetics, provides a highly linear fit to the data; in (Table 3) in none of the regressions do we see an R2 less than 0.982, with the majority higher than 0.99. Like many RRCM studies of solid fuel oxidation, we see multiple mass loss regimes, designated by rather abrupt changes in slope of the Arrhenius plot of l n kvs. 1/T. In this work, we show four regimes, as there are indeed four discontinuities in the data; however the majority of the mass loss - that we can capture in this analysis - occurs over two regimes, consistent with literature findings. The first regime sees a minimal amount of mass loss. This is often attributed to an initiation step, requiring a fairly large input of energy to begin decomposition. When a solid-state reaction follows the RRCM, the rate-determining step is a chemical reaction, as compared to diffusion or phase boundary controls. The RRCM is often applied to coal and biomass decomposition, and it yields highly linear Arrhenius plots when the particle sizes are small enough not to be impacted by transport limitations by maintaining sufficiently small Biot numbers.
| Mass Loss Regime 1 | Mass Loss Regime 2 | ||||||||||||||||
|---|---|---|---|---|---|---|---|---|---|---|---|---|---|---|---|---|---|
| IL:FC Blend | Onset Temp 1 | Endset Temp 1 | Ea | A | R2 | Fraction Sample Mass Loss | Onset Temp 2 | Endset Temp 2 | Ea | A | R2 | Fraction Sample Mass Loss | |||||
| (K) | (K) | (kJ/mol) | (s-1) | (K) | (K) | (kJ/mol) | (s-1) | ||||||||||
| 0:100 | 420.1 | 525.0 | 45.0 | ± | 0.4 | 1.00E+02 | 0.997 | 0.088 | 530.0 | 573.1 | 84.7 | ± | 1.6 | 8.09E+05 | 0.996 | 0.17 | |
| 50:50 | 418.7 | 523.9 | 33.9 | ± | 0.3 | 4.26E+00 | 0.998 | 0.051 | 534.2 | 579.6 | 67.7 | ± | 1.8 | 8.49E+03 | 0.991 | 0.10 | |
| 80:20 | 426.6 | 522.7 | 26.5 | ± | 0.2 | 3.91E-01 | 0.998 | 0.049 | 531.3 | 574.9 | 62.5 | ± | 1.2 | 1.41E+03 | 0.995 | 0.074 | |
| 100:0 | 439.0 | 489.0 | 16.5 | ± | 2.5 | 2.31E-02 | 0.994 | 0.010 | 524.0 | 581.0 | 55.1 | ± | 5.1 | 1.56E+02 | 0.989 | 0.020 | |
| Mass Loss Regime 3 | Mass Loss Regime 4 | ||||||||||||||||
| IL:FC Blend | Onset Temp 3 | Endset Temp 3 | Ea | A | R2 | Fraction Sample Mass Loss | Onset Temp 4 | Endset Temp 4 | Ea | A | R2 | Fraction Sample Mass Loss | Total Mass Fraction in Ea Calc | ||||
| (K) | (K) | (kJ/mol) | (s-1) | (K) | (K) | (kJ/mol) | (s-1) | ||||||||||
| 0:100 | 670.4 | 696.1 | 44.9 | ± | 2.3 | 1.71E+01 | 0.982 | 0.035 | 762.9 | 835.1 | 54.0 | ± | 1.0 | 6.48E+01 | 0.992 | 0.12 | 0.42 |
| 50:50 | 681.5 | 774.8 | 33.4 | ± | 0.4 | 1.12E+00 | 0.997 | 0.13 | 909.2 | 1058.0 | 90.9 | ± | 4.3 | 2.29E+08 | 0.993 | 0.095 | 0.38 |
| 80:20 | 670.8 | 786.8 | 36.0 | ± | 0.2 | 1.36E+00 | 0.999 | 0.23 | 952.6 | 1111.4 | 91.1 | ± | 1.7 | 4.74E+02 | 0.994 | 0.065 | 0.42 |
| 100:0 | 621.0 | 967.0 | 46.6 | ± | 1.2 | 9.05E+00 | 0.990 | 0.16 | 1016.0 | 1086.0 | 242.8 | ± | 3.9 | 1.50E+10 | 0.997 | 0.59 | 0.78 |
Table 3: Reaction Rate Constant Method applied to biomass, coal, and blend oxidation; activation energy presented with 95% confidence interval
As would be expected from many prior studies, the pure biomass decomposes to a greater extent at lower temperatures than the coal or blends, and it has higher initial activation energy at the lowest temperature mass loss regime than the coal or blends. In the fourth mass loss regime, we see much higher activation energies for the coal, and for blends with higher coal percentages. The opposite is true in mass loss regime 2, occurring between approximately 524-534 (onset) and 573-581K (endset), where the activation energy of the biomass is 84.7 ± 1.6 kJ/mol, and 55.1 ± 5.1 kJ/mol for the pure coal. (Figure 4) shows the activation energy for each mass loss regime plotted as a function of weight percent feed corn in the blend. The relationship between these variables is highly linear for the first two regimes, yielding expressions of:

Figure 4: Activation energies of pure fuels and blends oxidized at 100K/min predicted by RRCM for mass loss regimes 1-4;  R1 Regime 1;
  R1 Regime 2;
  R1 Regime 3;
  R1 Regime 4
Regime 1: EaR1 = 18.91 + 0.2721*(Wt.%FC) R2 = 0.9687 (8)
Regime 2: EaR2 = 55.29 + 0.2872*(Wt.%FC) R2 = 0.9834 (9)
Such a relationship does not hold for the third and fourth mass loss regimes, indicating perhaps reaction synergy between the two fuels; we suspect that the biomass is promoting decomposition of the coal, such that there is less coal available at higher temperatures to devolatilize and oxidize, and thus the high activation energies of pure coals are depressed with the addition of the biomass and its higher reactivity.
Despite the good “fit” to the data, the RRCM does not describe the full range of decomposition. As can be seen in (Table 3), the Arrhenius plot captures less than 50% of the total mass loss for each sample within the linear fit regimes. So while this method is an important tool in terms of comparing to the many other literature studies available and a good “first approximation,” its applicability may be limited. In addition, the second and third order reaction models, R2 and R3, were found to be non-linear, with R2< 0.7 for all samples/regimes, and are therefore not reported.
Application of additional kinetic models
While the RRCM (and the second and third order reaction models, R2 and R3), rely on the assumption that a chemical reaction is the rate-limiting step, Diffusion models (D1 to D5) assume that the decomposition is controlled by one or multi-dimensional diffusion processes. In such a system, multiple reactions may occur throughout the solid, but it is the transport of gases in the solid phase that governs the apparent activation energy [26]. Phase Boundary Reaction models (P1 and P2) are predicated on the idea that the reaction occurs instantaneously on the surface of each particle, relying on the movement of the reaction interface at constant velocity in two or three dimensions. Nucleation models (N1 to N8) (Figure 5) describe the formation of a product at a nucleation site, or point of reaction, within the reactant’s lattice; single-step nucleation proceeds under the assumption that nucleation and nuclei growth occur in a single step, as opposed to multi-step nucleation.

Figure 5: Non-isothermal decomposition of FC at 100K/min fit to various models according to Table 2
The five Diffusion models applied herein appear to represent the 100K/min data quite well, with correlation coefficients greater than 0.99 for every solid fuel, blend, and mass loss regime as seen in (Table 4). The activation energies for the pure feed corn range from 85 to 86.5 kJ/mol in mass loss regime 1 (from 403 to 500K) and 9.1 to 28.7 kJ/mol for regime 2 (703 to 838 K); these activation energy values capture a total of 31% of the total mass converted. They range from 49.5-49.8 kJ/ mol and 64.1-69.6 kJ/mol for mass loss regimes 1 (403 to 560 K) and 2 (567 to 946 K), respectively, for the pure coal, capturing 89% of the total weight loss in these values. As (Figure 6) shows, a clear trend - though not linear- exists between weight percent feed corn in the blend and activation energy. Ea in regime 1 decreases as percent FC increases, and increases in regime 2 as percent feed corn increases. Interestingly, the values obtained from the Diffusion models and RRCM are well a similar range.

Figure 6: Activation energies of pure fuels and blends oxidized at 100K/min predicted by Diffusion Models for mass loss regimes 1 and 2; D1 Regime 1; D1 Regime 2; D2 Regime 1; D2 Regime 2;(×) D3 Regime 1; (Δ) D3 Regime 2;(+) D4 Regime 1; (+) D4 Regime 2;(τ) D5 Regime 1;  D5 Regime 2
| Mass Loss Regime 1 | Mass Loss Regime 2 | ||||||||||||||||
|---|---|---|---|---|---|---|---|---|---|---|---|---|---|---|---|---|---|
| Eqn. No. | Onset Temp 1 | Endset Temp 1 | Ea | A | R2 | Fraction Sample Mass Loss | Onset Temp 2 | Endset Temp 2 | Ea | A | R2 | Fraction Sample Mass Loss | Total Mass Fraction in E Calc | ||||
| (K) | (K) | (kJ/mol) | (s-1) | (K) | (K) | (kJ/mol) | (s-1) | ||||||||||
| Feed Corn | |||||||||||||||||
| D1 | 403 | 500 | 85.0 | ± | 0.6 | 7.40E+00 | 0.9983 | 0.036 | 703 | 838 | 9.1 | ± | 0.1 | 4.41E-06 | 0.9952 | 0.27 | 0.31 |
| D2 | 403 | 500 | 85.8 | ± | 0.6 | 4.51E+00 | 0.9981 | 0.036 | 703 | 838 | 16.7 | ± | 0.04 | 9.14E+04 | 0.9998 | 0.27 | 0.31 |
| D3 | 403 | 500 | 86.5 | ± | 0.6 | 1.22E+00 | 0.9978 | 0.036 | 703 | 838 | 28.7 | ± | 0.2 | 2.62E-05 | 0.9979 | 0.27 | 0.31 |
| D4 | 403 | 500 | 86.0 | ± | 0.6 | 1.07E+00 | 0.9980 | 0.036 | 703 | 838 | 20.6 | ± | 0.1 | 5.25E-06 | 0.9996 | 0.27 | 0.31 |
| D5 | 403 | 500 | 86.5 | ± | 0.6 | 1.22E+00 | 0.9978 | 0.036 | 703 | 838 | 28.7 | ± | 0.2 | 2.62E-05 | 0.9979 | 0.27 | 0.31 |
| P1 | 423 | 553 | 40.0 | ± | 0.3 | 1.50E-03 | 0.9984 | 0.16 | 709 | 835 | 4.9 | ± | 0.0 | 2.01E-06 | 0.9983 | 0.26 | 0.42 |
| P2 | 423 | 553 | 40.2 | ± | 0.3 | 1.05E-03 | 0.9983 | 0.16 | 709 | 835 | 7.8 | ± | 0.1 | 2.37E-06 | 0.9965 | 0.26 | 0.42 |
| N1 | 418 | 553 | 61.7 | ± | 0.4 | 1.21E-01 | 0.9987 | 0.16 | 709 | 790 | 4.4 | ± | 0.1 | 2.39E-06 | 0.9903 | 0.16 | 0.32 |
| N2 | 425 | 546 | 15.2 | ± | 0.1 | 3.38E-05 | 0.9991 | 0.12 | 632 | 899 | -7.5 | ± | 0.05 | 4.62E-07 | 0.9967 | 0.42 | 0.54 |
| N3 | 425 | 546 | 7.5 | ± | 0.04 | 8.74E-06 | 0.9988 | 0.12 | 632 | 899 | -9.2 | ± | 0.05 | 3.68E-07 | 0.9980 | 0.42 | 0.54 |
| N4 | 425 | 546 | 3.6 | ± | 0.03 | 4.44E-06 | 0.9982 | 0.12 | 632 | 899 | -10.0 | ± | 0.05 | 3.28E-07 | 0.9983 | 0.42 | 0.54 |
| N5 | 393 | 542 | 19.2 | ± | 0.3 | 1.17E-07 | 0.9812 | 0.12 | 632 | 866 | 45.3 | ± | 0.8 | 3.06E-10 | 0.9683 | 0.38 | 0.50 |
| N6 | 393 | 542 | 14.1 | ± | 0.2 | 2.60E-05 | 0.9884 | 0.12 | 632 | 866 | -0.1 | ± | 0.2 | 2.17E-06 | 0.0010 | 0.38 | 0.50 |
| N7 | 393 | 542 | 6.8 | ± | 0.1 | 7.51E-06 | 0.9824 | 0.12 | 632 | 866 | -4.1 | ± | 0.1 | 1.05E-06 | 0.9419 | 0.38 | 0.50 |
| N8 | 393 | 542 | 34.0 | ± | 0.9 | 4.40E-04 | 0.8546 | 0.12 | 632 | 866 | 30.5 | ± | 0.1 | 2.74E-04 | 0.9970 | 0.38 | 0.50 |
| 50:50 Blend | |||||||||||||||||
| D1 | 430 | 579 | 83.6 | ± | 0.4 | 2.49E+00 | 0.9978 | 0.17 | 629 | 1019 | 15.5 | ± | 0.1 | 4.96E-06 | 0.9941 | 0.56 | 0.73 |
| D2 | 430 | 579 | 84.3 | ± | 0.5 | 1.49E+00 | 0.9976 | 0.17 | 629 | 1019 | 20.5 | ± | 0.1 | 6.89E-06 | 0.9954 | 0.56 | 0.73 |
| D3 | 430 | 579 | 85.0 | ± | 0.5 | 3.99E-01 | 0.9973 | 0.17 | 629 | 1019 | 27.1 | ± | 0.2 | 5.58E-06 | 0.9878 | 0.56 | 0.73 |
| D4 | 430 | 579 | 84.5 | ± | 0.5 | 3.53E-01 | 0.9975 | 0.17 | 629 | 1019 | 22.7 | ± | 0.1 | 2.34E-06 | 0.9936 | 0.56 | 0.73 |
| D5 | 430 | 579 | 85.0 | ± | 0.5 | 3.99E-01 | 0.9973 | 0.17 | 629 | 1019 | 27.1 | ± | 0.2 | 5.58E-06 | 0.9878 | 0.56 | 0.73 |
| P1 | 439 | 611 | 39.5 | ± | 0.2 | 9.37E-04 | 0.9965 | 0.27 | 690 | 1021 | 5.9 | ± | 0.03 | 1.28E-06 | 0.9960 | 0.49 | 0.76 |
| P2 | 439 | 611 | 39.8 | ± | 0.2 | 6.74E-04 | 0.9962 | 0.27 | 690 | 1021 | 7.9 | ± | 0.04 | 1.23E-06 | 0.9943 | 0.49 | 0.76 |
| N1 | 414 | 596 | 62.4 | ± | 0.3 | 8.19E-02 | 0.9969 | 0.23 | 621 | 1055 | 8.0 | ± | 0.1 | 2.13E-06 | 0.9780 | 0.62 | 0.85 |
| N2 | 414 | 596 | 15.3 | ± | 0.1 | 2.89E-05 | 0.9946 | 0.23 | 621 | 1055 | -6.3 | ± | 0.1 | 4.43E-07 | 0.9781 | 0.62 | 0.85 |
| N3 | 414 | 596 | 7.4 | ± | 0.1 | 7.68E-06 | 0.9896 | 0.23 | 621 | 1055 | -8.7 | ± | 0.1 | 3.41E-07 | 0.9887 | 0.62 | 0.85 |
| N4 | 414 | 596 | 3.5 | ± | 0.1 | 3.96E-06 | 0.9718 | 0.23 | 621 | 1055 | -9.9 | ± | 0.1 | 2.99E-07 | 0.9913 | 0.62 | 0.85 |
| N5 | 414 | 596 | 22.8 | ± | 0.3 | 5.12E-08 | 0.9781 | 0.23 | 621 | 1055 | 44.6 | ± | 0.7 | 8.82E-10 | 0.9460 | 0.62 | 0.85 |
| N6 | 414 | 596 | 15.9 | ± | 0.1 | 3.38E-05 | 0.9938 | 0.23 | 621 | 1055 | -1.2 | ± | 0.1 | 1.20E-06 | 0.6907 | 0.62 | 0.85 |
| N7 | 414 | 596 | 7.8 | ± | 0.1 | 8.52E-06 | 0.9894 | 0.23 | 621 | 1055 | -5.3 | ± | 0.02 | 6.61E-07 | 0.9976 | 0.62 | 0.85 |
| N8 | 414 | 596 | 100.1 | ± | 3.3 | 4.36E-11 | 0.6532 | 0.23 | 621 | 1055 | 53.8 | ± | 1.5 | 1.29E-03 | 0.8786 | 0.62 | 0.85 |
| 80:20 Blend | |||||||||||||||||
| D1 | 439 | 558 | 80.5 | ± | 0.5 | 1.19E+00 | 0.9969 | 0.10 | 562 | 976 | 31.1 | ± | 0.2 | 4.13E-05 | 0.9918 | 0.72 | 0.83 |
| D2 | 439 | 558 | 81.0 | ± | 0.6 | 6.92E-01 | 0.9968 | 0.10 | 562 | 976 | 35.6 | ± | 0.1 | 5.15E-05 | 0.9964 | 0.72 | 0.83 |
| D3 | 439 | 558 | 81.6 | ± | 0.6 | 1.78E-01 | 0.9966 | 0.10 | 562 | 976 | 40.9 | ± | 0.2 | 3.40E-05 | 0.9967 | 0.72 | 0.83 |
| D4 | 439 | 558 | 81.2 | ± | 0.6 | 1.61E-01 | 0.9967 | 0.10 | 562 | 976 | 37.3 | ± | 0.1 | 1.64E-05 | 0.9971 | 0.72 | 0.83 |
| D5 | 439 | 558 | 81.6 | ± | 0.6 | 1.78E-01 | 0.9966 | 0.10 | 562 | 976 | 40.9 | ± | 0.2 | 3.40E-05 | 0.9967 | 0.72 | 0.83 |
| P1 | 439 | 571 | 36.8 | ± | 0.2 | 4.86E-04 | 0.9968 | 0.13 | 591 | 990 | 12.9 | ± | 0.1 | 3.20E-06 | 0.9919 | 0.70 | 0.82 |
| P2 | 439 | 571 | 36.9 | ± | 0.3 | 3.30E-04 | 0.9961 | 0.13 | 591 | 990 | 14.4 | ± | 0.1 | 2.89E-06 | 0.9946 | 0.70 | 0.82 |
| N1 | 435 | 547 | 57.4 | ± | 0.4 | 2.49E-02 | 0.9967 | 0.084 | 600 | 997 | 19.2 | ± | 0.2 | 9.68E-06 | 0.9782 | 0.70 | 0.78 |
| N2 | 435 | 547 | 13.7 | ± | 0.1 | 1.99E-05 | 0.9942 | 0.084 | 600 | 997 | -2.2 | ± | 0.1 | 7.80E-07 | 0.6890 | 0.70 | 0.78 |
| N3 | 435 | 547 | 6.4 | ± | 0.1 | 6.07E-06 | 0.9889 | 0.084 | 600 | 997 | -5.7 | ± | 0.1 | 5.12E-07 | 0.9556 | 0.70 | 0.78 |
| N4 | 435 | 547 | 2.8 | ± | 0.1 | 3.35E-06 | 0.9670 | 0.084 | 600 | 997 | -7.5 | ± | 0.1 | 4.15E-07 | 0.9779 | 0.70 | 0.78 |
| N5 | 435 | 547 | 20.5 | ± | 0.2 | 9.66E-08 | 0.9924 | 0.084 | 600 | 997 | 44.4 | ± | 0.6 | 1.05E-09 | 0.9629 | 0.70 | 0.78 |
| N6 | 435 | 547 | 14.1 | ± | 0.1 | 2.19E-05 | 0.9938 | 0.084 | 600 | 997 | 2.6 | ± | 0.03 | 1.96E-06 | 0.9667 | 0.70 | 0.78 |
| N7 | 435 | 547 | 6.7 | ± | 0.1 | 6.47E-06 | 0.9884 | 0.084 | 600 | 997 | 2.6 | ± | 0.02 | 9.47E-07 | 0.9806 | 0.70 | 0.78 |
| N8 | 435 | 547 | 75.3 | ± | 3.3 | 2.17E-02 | 0.7904 | 0.084 | 600 | 997 | 69.4 | ± | 2.4 | 1.06E-02 | 0.8792 | 0.70 | 0.78 |
| Ill. No. 6 Coal | |||||||||||||||||
| D1 | 453 | 565 | 49.5 | ± | 0.5 | 1.27E-04 | 0.9972 | 0.026 | 568 | 867 | 64.1 | ± | 0.2 | 2.85E-03 | 0.9993 | 0.47 | 0.49 |
| D2 | 453 | 565 | 49.6 | ± | 0.5 | 6.62E-05 | 0.9972 | 0.026 | 568 | 867 | 66.8 | ± | 0.2 | 2.41E-03 | 0.9996 | 0.47 | 0.49 |
| D3 | 453 | 565 | 49.8 | ± | 0.5 | 1.54E-05 | 0.9973 | 0.026 | 568 | 867 | 69.6 | ± | 0.1 | 9.43E-04 | 0.9996 | 0.47 | 0.49 |
| D4 | 453 | 565 | 49.7 | ± | 0.5 | 1.49E-05 | 0.9972 | 0.026 | 568 | 867 | 67.7 | ± | 0.1 | 6.47E-04 | 0.9996 | 0.47 | 0.49 |
| D5 | 453 | 565 | 49.8 | ± | 0.5 | 1.54E-05 | 0.9973 | 0.026 | 568 | 867 | 69.6 | ± | 0.1 | 9.43E-04 | 0.9996 | 0.47 | 0.49 |
| P1 | 432 | 509 | 27.2 | ± | 0.4 | 2.15E-05 | 0.9958 | 0.013 | 585 | 867 | 28.3 | ± | 0.1 | 2.09E-05 | 0.9992 | 0.46 | 0.47 |
| P2 | 432 | 509 | 27.2 | ± | 0.4 | 1.44E-05 | 0.9958 | 0.013 | 585 | 867 | 29.0 | ± | 0.1 | 1.61E-05 | 0.9994 | 0.46 | 0.47 |
| N1 | 429 | 581 | 38.3 | ± | 0.4 | 6.84E-05 | 0.9942 | 0.037 | 583 | 808 | ± | 0.0000 | 0.04 | ||||
| N2 | 429 | 581 | 7.2 | ± | 0.2 | 2.71E-06 | 0.9771 | 0.037 | 583 | 808 | 46.5 | ± | 0.1 | 3.60E-04 | 0.9998 | 0.33 | 0.37 |
| N3 | 429 | 581 | 2.1 | ± | 0.1 | 1.58E-06 | 0.8733 | 0.037 | 583 | 808 | 7.9 | ± | 0.0 | 3.08E-06 | 0.9992 | 0.33 | 0.37 |
| N4 | 429 | 581 | -0.5 | ± | 0.1 | 1.21E-06 | 0.4891 | 0.037 | 583 | 808 | -1.8 | ± | 0.0 | 9.36E-07 | 0.9801 | 0.33 | 0.37 |
| N5 | 406 | 681 | 17.7 | ± | 0.1 | 2.27E-07 | 0.9899 | 0.12 | 683 | 1052 | 50.5 | ± | 0.4 | 7.70E-10 | 0.9892 | 0.68 | 0.80 |
| N6 | 429 | 581 | 7.4 | ± | 0.2 | 2.80E-06 | 0.9784 | 0.037 | 583 | 808 | 9.6 | ± | 0.0 | 4.34E-06 | 0.9989 | 0.33 | 0.37 |
| N7 | 429 | 581 | 2.1 | ± | 0.1 | 1.62E-06 | 0.8834 | 0.037 | 583 | 808 | 2.6 | ± | 0.0 | 1.75E-06 | 0.9975 | 0.33 | 0.37 |
| N8 | 406 | 681 | 56.7 | ± | 1.1 | 8.30E-04 | 0.9529 | 0.12 | 683 | 1052 | 71.0 | ± | 1.8 | 4.96E-03 | 0.9391 | 0.68 | 0.80 |
Table 4: Solid State Reaction methods applied to pure fuels and blends at 100K/min, Ea presented with 95% confidence interval
In a particle diffusion reaction, the rate of product formation is dependent on the thickness of the barrier layer. Solid-state reactions commonly occur whereby molecules must permeate lattices, suffering restrictions upon movement. While our particles are not crystalline lattices- the biomass especially is quite amorphous - diffusion is surely a hindrance for oxidation reactions. Both coal and biomass are carbonaceous solids; upon heating their porous networks develop and surface areas increase. As the solids devolatilize, the gaseous products that form must diffuse to the surface of the particles, where, once entrained in the air, they can combust. It is this diffusion, rather than the combustion in excess oxygen, that likely limits the reaction rate. It is therefore not surprising that the multi-dimensional diffusion models (D2-5) are reasonable approximations for the activation energies for these solid fuels.
The Phase Boundary models, P1 and P2, likely underestimate the activation energy, especially in the second mass loss regime, yielding activation energies between 5 and 30 kJ/mole, as seen in Table 4. (Figure 5) illustrates this graphically; at higher temperatures the slope of the power law models for FC approach the horizontal. The inherent assumption behind these models-that the reaction interface moves at constant velocity - is hampered by the ongoing multi-step devolatilization and oxidation. Given the shape of the DTG and conversion curves and thus the transient nature of the reaction rates, the inability of P1 and P2 to accurately describe the activation energies of oxidation is understandable.
Finally, the Nucleation models vary in apparent applicability. Models N2-4, 6 and 7 yield negative activation energies in the second mass loss regime. It is highly unlikely that these decomposition reactions are a result of a spontaneous growth mechanism and thus we focus our immediate attention on other models. Model N1 likely under-predicts the activation energies in mass loss regime 2; it is an order of magnitude lower for some samples than N5 or N8 (Figure 7). The correlation coefficient for N5 is lower than the other models (ranging from 0.91 to 0.99), and the activation energies are likely also under-predicted (i.e. 19.2 kJ/mol for FC, regime 1.) Finally, for N8 we have a wide range of R2 values – ranging from 0.6532 to 0.9970, leading to questionable “fit” and applicability.

Figure 7: Activation energies of pure fuels and blends oxidized at 100K/min predicted by Power Law and Nucleation Models for mass loss regimes 1 and 2; P1 Regime 1; P1 Regime 2; D2 Regime 1; P2 Regime 2;(σ ) N1 Regime 1; (Δ) N1 Regime 2;(×) N5 Regime 1; (+) N5 Regime 2;(τ) N8 Regime 1; N8 Regime 2
Impact of blend ratio on oxidation kinetics
If the kinetics of oxidation of coal-biomass blends were simply an additive function of the two solid fuels present, then the weight loss curve of each blend would be the sum of the weight loss curves of both materials [3]. The kinetic parameters would also be described by such an assumption, leading to the prediction of activation energy such as:
Eapredict = yILEaIL + yFCEaFC (10)
Where yIL and yFC are the mass fractions of coal and feed corn (respectively).Yet, as seen in (Figure 8a), we find evidence for reaction synergism. Here we compare the activation energies for all four mass loss regimes as measured by the RRCM to values predicted from Equation (10), as well as for the two mass loss regimes from an average of Diffusion models D2-D5. Equation (10) under-predicts the lower-temperature mass loss regime activation energies for both the 50:50 and 80:20 blends for both the diffusion and RRCM models, and over-predicts at higher temperatures. As the residuals plot (Figure 8b) shows, the RRCM shows some possible evidence of an additive scheme at lower activation energies as some points are within 5-10 kJ/mol of predicted values; though put another way, errors for all the mass loss regimes range from -9% to +125%. Likewise for the Diffusion models, errors ranged from -30% to +89%.

Figure 8: Applicability of linear addition scheme to predict activation energies of FC:IL blends using  R1 and
  average of D2-D5
These findings support the idea that as the biomass oxidizes at lower temperatures, it may spur devolatilization and oxidation of the coal at lower temperatures. Despite the high fraction of coal in the 80:20 blend, its activation energy at lower temperatures is much closer to that of feed corn than an additive scheme would imply. Likewise, we see similar behavior for the 50:50 blend. At higher temperatures the activation energies are quite depressed. If all the biomass oxidized at lower temperature, leaving the coal to decompose separately at higher temperatures, we would expect activation energies upwards of 60-70 kJ/mol at higher temperatures. And yet, the blends display significantly lower activation energies, which suggests synergistic behavior.
Summary
The oxidation of coal, biomass, and their blends is a complex process of heterogeneous chemical reactions and competing transport limitations. A common assumption to understand their behavior, kinetically speaking, is that decomposition proceeds via independent parallel reactions. In this analysis, we find that a simple first order reaction Arrhenius assumption, or three-dimensional diffusion models, likely provide the best mechanistic descriptors for the activation energy of Illinois No. 6 coal, Feed Corn Stover, and their blends’ oxidation. Similarly [4] conclude that the RRCM is the “most effective solidstate mechanism for the first step of biomass oxidation and for coal combustion” but that for the second step of biomass combustion, diffusion mechanisms are the controlling factor. Both kinetic analysis methods suggest evidence of synergistic behavior, whereby the biomass promotes the oxidation of coal at lower temperatures, leading to lower activation energies at higher temperatures.
Whether viewed as a long-term solution to dwindling conventional fossil fuel resources or as a bridge between coal-fired power plants and an alternative energy future, second-generation biomass feed stocks are of keen interest to public and private enterprises alike. This work demonstrates that applicability of both a first order chemical reaction model (the Arrhenius equation) and of three-dimensional diffusion models to describe the oxidative decomposition of Illinois No. 6 coal, feed corn Stover, and their blends at 100 K/min using thermo gravimetric analysis. At lower temperatures, the biomass appears to promote the decomposition of coal when blended at ratios of 50:50 and 80:20 weight percent. Global activation energies calculated via both kinetic models show that activation energies are not an additive function of each blends’ composition, rather pointing to potential synergistic effects among the fuels. Given the highly heterogeneous nature of these reactions-both chemically and physically-the ability to describe the kinetics of such oxidations in simply models is attractive. Such descriptors provide insight into how the fuel blends will behave in a larger scale combustion apparatus and a useful basis of comparison among other fuel blends reported in the literature.
The authors thank the Coppal House Farm, NH, for providing the feed corn stover. This material is based upon work supported by the National Science Foundation under Grant No. NSF CBET-1127774.