Journal of Agricultural Science and Food Research
Open Access
ISSN: 2593-9173
ISSN: 2593-9173
Research Article - (2018) Volume 9, Issue 3
Chickpea is important as food and feed crop for farmers. The crop is also significant for generating income due toits high market demand. Guji Zone has potential of chickpea production, but the yield of chickpea is low due toabsence of improved seed and lack of knowledge on chickpea production. Thus, this study was instigated todemonstrate new varieties of chickpea to local farmers aligned to measure farmers’ knowledge on chickpeaproduction. To measure farmers’ knowledge on chickpea the issue of capacity building such as trainings, field visit,exchange visit and field days were organized to capacitate farmers’ knowledge on chickpea demonstrated varieties.36 items test were prepared on chickpea production and administrated to 24 farmers who were participants duringthe demonstration of chickpea on their land. Items contains yes or no, true or false and explain types. Each correctanswer was given ‘1’ score while wrong answer was awarded ‘0’ mark. Finally, 15 knowledge items test wereselected based on the difficulty index which ranges from 45 to 92, discrimination index above 0.20 and point bi-serialcorrelation coefficient significant at 0.1%, 0.05 and 0.001% level for final knowledge test. The reliability of theknowledge test was measured by split-half method and reliability coefficient (r=0.969) which indicates that thisknowledge test is quite reliable. The result of this study revealed that majority of farmers (83.33%) owned moderatelevel of knowledge on chickpea production. Farmers Training Center established in each Kebele should befunctioned to increase farmers’ knowledge on chickpea production.
Keywords: Knowledge; Reliability; Item analysis; Chickpea; Demonstration
Chickpea (Cicer arietinum L.) is an important pulse crops grown in Ethiopia because of its multiple functions. It is a key component of the daily diet, and thus important protein source for Ethiopian households who cannot afford animal products. In Ethiopia chickpea grain is widely used in different forms as green vegetable (green immature seed), “Kollo” (soaked and roasted) and “nifro” (boiled seeds) and “wot” (sauces) made up of “shiro” (powdered seeds) [1].
Chickpea cultivation produces straw that is used as livestock feed. This straw is mainly used when there is drought and green fodder is unavailable for livestock feeding. Recently, the studies of Megersa et al., Bereket and Abdirazak also stated that chickpea has a great economic merit in Ethiopia providing a cheap source of protein for human diet and animal feed, and as a source of alternative cash income to the farmers and foreign currency to the country [2-5].
Another attractive feature of chickpea is its ability to fix atmospheric nitrogen in symbiosis with rhizobia, contributing directly to grain protein and reducing the need for N fertilizer for subsequent crops. It thereby has great potential to improve soil N status [6]. Chickpea is often grown after wheat and tef are harvested on vertisols using residual moisture which extends the cropping season from September to December. As a result, growing chickpea allows the farmers to produce extra crop on the same land [7].
Chickpea is a less labor-intensive crop and its production demands low external inputs compared to cereals. The total land coverage and yield of chickpea in Ethiopia are estimated to be 225607.53 hectares and 444145.93 tons, respectively [8]. Despite its nutritional values, high economic importance, the national average yield of chickpea is still lower (1.97 t/ha; CSA, 2017) than its potential of up to 5 t/ha on experimental stations. Chickpea yields are limited by factors such as pests, diseases, drought and yield improvement require compatible resilient varieties adapted to different agro-ecological zones [5]. The low yield of chickpea in Ethiopia was due to various production constraints including: low yield potential of landraces, lack of superior varieties, their susceptibility to biotic and a biotic stresses and poor cultural practices are some the serious constraints in chickpea production [9].
Production of chickpea have not been yet under production in the potential areas of Guji zone [10]. In Adola Rede district of Guji Zone the production of chickpea is not known by farmers. Thus, we proposed new varieties (Dalota and Habru) to the farmers by demonstrating on the area of 100 m2 in 2017 and 2018 production years. After adaptation of the technologies or varieties demonstration is needed to create awareness and publicize for further adoption of technologies. Demonstration means small area on which research activities are implemented on farmers’ land with active participation of farmers, development agents and other stakeholders who facilitate the knowledge transfer on the use, application of improved and appropriate technologies from researcher to the empowered farmers. To implement this research activity, we gave two times training on the recommended packages of chickpea production for the selected farmers on demonstration of chickpea in the area. We also gave exchange visit and organized field days to capacitate the knowledge of farmers on the chickpea production. Thus, to see the impact of these trainings, exchange visit and field days this activity was initiated to measure the level of knowledge of farmers on the new demonstration of chickpea production.
Research Methodology
Description of study area
Adola Rede district is 468 km away from the Addis Ababa to the South. The district is bordered by Ana Sora district in the North, Wadera district in the South and Odo Shakiso in the West and Girja district in the East directions. The district has altitude range of 1350-2340 meter above sea level, annual mean of 1000 mm rainfall and annual average of 28°C of temperature. Mixed farming, mining and forest product production were the major livelihood of Adola Rede farmers. Adola district has diverse agro-ecologies which are suitable for production of different crops. The rainfall pattern of the study area is bimodal for lowland and midland areas and uni-modal for highland parts. Sandy, clay and silt are the major soils of Adola Rede district. The major crops produced in the area includes maize, tef, haricot bean, chat, coffee and the others. The black soil characteristics of the area make it potential for production of chickpea.
Development of knowledge test
Development of items: Items regarding chickpea production were developed by Agricultural Extension Researchers of Bore Agricultural Research Center. 36 items were prepared based on uncertainty, simplicity and representativeness. English and English defined knowledge as a body of understood information possessed by an individual or by a culture [11]. Knowledge is totality of understood information possessed by an individual. A knowledge test has been defined by Bloom et al. as a test which refers to those behavior and test situation which emphasized the remembering by the recall of ideas, material or phenomena [12]. For this study knowledge was operationalized as the amount of information owned, understood and applied by farmers on chickpea production.
Item analysis: The item analysis was done on the lines of technique used by Jha and Singh which yielded three kinds of information viz., index of item difficulty, index of item discrimination and index of item validity [13]. The index of item difficulty indicated the extent to which an item was difficult to understand while the index of item discrimination was to find out whether an item really discriminated a well-informed farmer from a poorly informed one. The index of item validity provided the information on how well an item measured or discriminated in agreement with rest of the test.
Sample size: Based on the area is convenient for monitoring and evaluation purpose and potential production of chickpea two Kebeles were purposively selected. The activity was conducted on two Kebeles (Gobicha and Dole) where demonstration of chickpea was conducted in 2017 and 2018 cropping season. From each kebele 15 farmers were selected and grouped as one Farmers Research Group. Farmers Research Group conducted demonstration of chickpea at three experimental farmers in their respective Kebeles. That mean for the two varieties of chickpea (Dalota and Habru) there were six replications on farmers land. However, we did not used local variety in our demonstration experiment since there was no local variety and chickpea production is new farming in the study area.
The 36 items were administered to 24 (17 male and 7 women) farmers. Items contains yes or no, true or false and explain types. Each correct answer was given ‘1’ score while wrong answer was awarded ‘0’ mark. Thus, total score secured by all individual farmers on 36 items for correct answers was the knowledge score on chickpea production. The scores obtained by 24 farmers were arranged in descending order and divided into six groups i.e., 4 farmers in each group. The groups were named as G1, G2, G3, G4, G5 and G6. The range of score obtained by the farmers of six groups were described in Table 1.
| Group number | G1 | G2 | G3 | G4 | G5 | G6 |
|---|---|---|---|---|---|---|
| Score range | 34-35 | 33 | 31-32 | 29-30 | 26-28 | 20-25 |
| Number of farmers | 4 | 4 | 4 | 4 | 4 | 4 |
Table 1: Chickpea knowledge range scores obtained by the farmers (N=24).
For item analysis, the middle two groups G3 and G4 were eliminated keeping four extreme groups with high and low scores. The data related to the correct response for all the items in respect of these four groups were tabulated for calculating the difficulty and discrimination indices. Selection of items for final format of the knowledge test was done based on the following criteria.
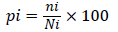
Item difficulty index-P: The index of item difficulty was worked out as the percentage of the respondents answering an item correctly. The assumption in this item index of difficulty was that the difficulty is linearly related to the level of farmer’s knowledge about chickpea production. When a farmer answers an item, it was assured that the item was less difficult than his/her ability to cope with it. It was calculated by following formula:
 (1)
(1)
Where, pi=Difficulty index in percentage of the ith item, ni= Number of respondents giving correct answer to ith item, Ni=Total number of respondents to whom the ith item was administered.
An example of calculation of Difficulty Index (Pi) of item no. 24 is presented below:

Note:
1. Range of P values for final selection of the item was 45 to 92 percent.
2. The P values for all items are listed.
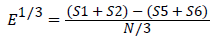
Calculation of discrimination index: Item discrimination index indicates the ability of the item to differentiate the well-informed farmers from the poorly informed ones. The E1/3 formula was used in the present study for calculating the discrimination index. The formula used was as follows:
 (2)
(2)
Where, S1, S2, S5 and S6 were frequencies of correct answer in the group of G1, G2, G5 and G6 respectively. N=Total number of farmers in the item analysis
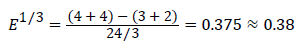
Example. Discrimination index of item 24 was calculated below
Note:
1. Discrimination index (E1/3) above 0.20 was considered for final selection of the item.
2. The E1/3 values for all items are listed.
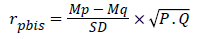
Point bi-serial correlation: The main aim of calculating point biserial correlation was to work out the internal consistency of items that is the relationship of total scores to a dichotomized answer to any given item. In a way, validity power of item was computed by correlation of individual item of whole test. Point bi-serial correlation for each of item to preliminary knowledge test was calculated:
 (4)
(4)
Where, rpbis=Point bi-serial correlation, Mp=Mean of the total scores of the farmers who answered the item correctly, Mq=Mean of total scores of farmers who answered item incorrectly, SD=Standard deviation of score of entire samples, P=Proportion of respondents giving correct answer to item, Q=Proportion of farmers giving incorrect answer to item.
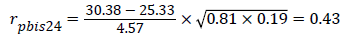
For example, let's apply the formula for rpbis to the data for Item 24 (which we would expect to correlate with the total scores), Mean of the total scores of the farmers who answered the item correctly was 30.38; Mean of total scores of farmers who answered item incorrectly was 25.33; the standard deviation was 4.57; the proportion of farmers answering correctly was 0.81 and the proportion answering incorrectly was 0.19.
P=395 [Summation of the scores obtained by 13 farmers passing the item (giving correct answer of item no. 24)]. Mp=395/13=30.38 (mean score). Proportion of P=number of farmers giving correct answers/ total number of farmers=13/16=0.81
Q=76 [Summation of the scores obtained by 3 farmers not passing the item (giving wrong answer of item no. 24)]. Mq=76/3= 25.33. Proportion of Q=3/16=0.19. The proportion passing and failing for item 24 was 0.81 and 0.19 respectively.
When we apply 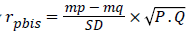 for item 24, we obtained
The calculated point bi-serial correlation was tested with (n-2) degree of freedom
 (4)
(4)
Where t=the t-value of correlation, r=point bi-serial correlation coefficient, n=number of farmers (n=24-2=22).
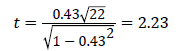
Since t-calculated (2.23) was greater than t-tabulated (2.07) at degree freedom of 22, it was significant at 0.05 level of probability. This meant that item 24 appears to be widely understood to the farmers out in the same way as the total scores understood by the farmers. In this sense, the point bi-serial correlation coefficient indicated that item 24 discriminates well among the farmers in this group (in terms of the way the overall test discriminates).
Reliability of knowledge test: Split-Half method was employed to calculate the reliability coefficient value as split-half method is conceived as best of the methods for measuring test reliability and the main advantage is that all data for computing reliability are obtained upon one occasion which helped to eliminate the variations brought about by differences between the two testing situations [14].
Validity of knowledge test: The validity of knowledge test was established through content validity. All possible care was taken in incorporation of the statements covering all aspects on full packages of chickpea production. All the statements were subjected to item difficulty, discrimination index and point bi-serial correlation before selection of the final statements. Hence it was logical to assume that the test satisfies representation as well as sensible method of test construction, the criteria for contest validity.
Method of data collection and analysis
Face-face interview was employed to collect the data. The collected data were analyzed by Microsoft excel and SPSS version 20.
Reliability of knowledge test
In this method, 36 items were divided into two equal halves with odd numbered in one half and even number in the other. The scores of odd and even numbered items were ordered from lower to higher. Items were administered to 24 farmers. Thus, two sets of knowledge score were obtained. Then, co-efficient of correlation between two sets of scores was computed and observed to be highly significant at 0.01 level (r value=0.969) which indicates that the knowledge test is highly reliable (Table 2). Therefore, this test had high internal consistency for measuring knowledge of farmers on chickpea production.
| Correlations | |||
|---|---|---|---|
| Odd knowledge of items | Even knowledge of items | ||
| Odd | Pearson Correlation | 1 | .969** |
| Sig. (2-tailed) | 0 | ||
| N | 18 | 18 | |
| Even | Pearson Correlation | .969** | 1 |
| Sig. (2-tailed) | 0 | ||
| N | 18 | 18 | |
** Correlation is significant at the 0.01 level (2-tailed).
Table 2: Reliability test on the knowledge test.
Knowledge level of farmers on chickpea production
The items having difficulty index between 45-92, discrimination index above 0.20 and the point bi-serial correlation significant at 0.1%, 0.05 and 0.001% level were finally selected for final knowledge test. Based on these criteria, 15 items become the knowledge test of chickpea production. Therefore, the item number 5, 6, 7, 13, 14, 16, 18, 19, 20, 21, 22, 24, 26, 28 and 31 were selected based on their respective difficulty index, discrimination index and point bi-serial correlation significant (Table 3).
| Item no | Frequencies of correct answers | Total frequencies of correct answers (G1+…+G6) |
Difficulty index-P (% of respondents giving the correct answers) |
Discrimination index (E1/3) |
Point bi-serial correlation (rpbis) |
t | |||
|---|---|---|---|---|---|---|---|---|---|
| in four extreme groups | |||||||||
| G1 | G2 | G5 | G6 | ||||||
| 1 | 4 | 3 | 3 | 3 | 21 | 87.5 | 0.13 | 0.26 | 1.27 |
| 2 | 4 | 4 | 4 | 3 | 23 | 95.83 | 0.13 | 0.13 | 0.61 |
| 3 | 4 | 3 | 3 | 3 | 18 | 75 | 0.13 | 0.19 | 0.91 |
| 4 | 4 | 4 | 4 | 3 | 23 | 95.83 | 0.13 | 0.13 | 0.61 |
| 5 | 4 | 4 | 2 | 1 | 18 | 75 | 0.63 | 0.34 | 1.69* |
| 6 | 4 | 4 | 3 | 3 | 21 | 87.5 | 0.25 | 0.36 | 1.81* |
| 7 | 4 | 4 | 4 | 2 | 22 | 91.67 | 0.25 | 0.56 | 3.17*** |
| 8 | 4 | 4 | 3 | 4 | 20 | 83.33 | 0.13 | 0.07 | 0.32 |
| 9 | 4 | 3 | 4 | 3 | 22 | 91.67 | 0 | 0.07 | 0.32 |
| 10 | 4 | 4 | 3 | 4 | 23 | 95.83 | 0.13 | 0.14 | 0.66 |
| 11 | 4 | 4 | 3 | 3 | 21 | 87.5 | 0.13 | 0.28 | 1.37 |
| 12 | 4 | 3 | 4 | 3 | 23 | 95.83 | 0.13 | 0.5 | 2.7* |
| 13 | 4 | 4 | 2 | 0 | 15 | 62.5 | 0.75 | 0.63 | 3.81*** |
| 14 | 3 | 4 | 2 | 2 | 18 | 75 | 0.38 | 0.56 | 3.17*** |
| 15 | 4 | 4 | 4 | 3 | 23 | 95.83 | 0.13 | 0.22 | 1.06 |
| 16 | 4 | 4 | 2 | 2 | 20 | 83.33 | 0.5 | 0.64 | 3.81*** |
| 17 | 4 | 4 | 4 | 3 | 23 | 95.83 | 0.13 | 0.27 | 1.32 |
| 18 | 4 | 4 | 3 | 1 | 16 | 66.67 | 0.5 | 0.63 | 3.81*** |
| 19 | 3 | 3 | 2 | 2 | 19 | 79.17 | 0.25 | 0.42 | 2.17** |
| 20 | 3 | 4 | 1 | 1 | 17 | 70.83 | 0.63 | 0.78 | 5.85*** |
| 21 | 4 | 4 | 4 | 1 | 20 | 83.33 | 0.38 | 0.72 | 4.87*** |
| 22 | 4 | 4 | 3 | 2 | 20 | 83.33 | 0.38 | 0.37 | 1.87* |
| 23 | 3 | 4 | 4 | 3 | 22 | 91.67 | 0 | 0.25 | 1.21 |
| 24 | 4 | 4 | 3 | 2 | 20 | 83.33 | 0.38 | 0.43 | 2.23** |
| 25 | 4 | 4 | 3 | 4 | 21 | 87.5 | 0.13 | 0.19 | 0.91 |
| 26 | 4 | 4 | 0 | 2 | 11 | 45.83 | 0.75 | 0.29 | 1.42* |
| 27 | 3 | 3 | 2 | 3 | 19 | 79.17 | 0.13 | 0.36 | 1.81* |
| 28 | 4 | 4 | 2 | 3 | 20 | 83.33 | 0.38 | 0.29 | 1.42* |
| 29 | 4 | 4 | 4 | 4 | 24 | 100 | 0 | 0 | 0 |
| 30 | 4 | 4 | 2 | 1 | 14 | 58.33 | 0.63 | 0.03 | 0.14 |
| 31 | 4 | 2 | 2 | 1 | 11 | 45.83 | 0.38 | 0.44 | 2.3** |
| 32 | 4 | 4 | 4 | 4 | 24 | 100 | 0 | 0 | 0 |
| 33 | 0 | 1 | 0 | 1 | 3 | 12.5 | 0 | -0.04 | -0.19 |
| 34 | 4 | 4 | 4 | 4 | 24 | 100 | 0 | 0 | 0 |
| 35 | 4 | 4 | 4 | 4 | 24 | 100 | 0 | 0 | 0 |
| 36 | 4 | 4 | 4 | 4 | 24 | 100 | 0 | 0 | 0 |
Table 3: Difficulty index, discrimination index and point bi-serial correlation of farmers on chickpea production. *, ** and *** significant at 0.1, 0.05 and 0.001 respectively. There was a significant difference (t at different level) between the criterion scores of farmers who got the item correct and those who got it wrong. This meant that the right farmer got the item correctly. Thus, the item could be accepted as a valid discriminator between high or clever and low or weak farmers. In addition, the item could be used to predict the overall performance of a farmers in the test.
Item 33 and 34 were not statistically significant but for further interpretation of farmers’ knowledge on chickpea production let’s see the rpbis items of 33 and 34 which were -0.04 and 0 respectively. The correlation between item 33 and the total scores was a negative value of -0.04, and this item appears to be widely understood to the farmers out opposite to the way that the total scores understood by the farmers. In other words, the point bi-serial correlation coefficient shows that item 33 discriminates in a different way from the total scores at least for the farmers in this group. The correlation between item 34 and the total scores was zero and item 34 did not appear to be understood by all the farmers in the same way as the total scores. This means item 34 was not discriminating at all among the farmers in this group because there was no variation in their answers (Table 3).
Categorization of farmers’ knowledge on chickpea production
The mean and standard deviation of all the farmers scores were computed for classifying the knowledge level in different categories. Based on the mean knowledge score and standard deviation three levels of knowledge of chickpea farmers were categorized under low, medium and high. The categorization was done according to Meena et al. Low knowledge level=Less than (Mean knowledge–Standard Deviation), Medium knowledge level=From (Mean knowledge +Standard Deviation) and High knowledge level=Above (Mean knowledge+Standard Deviation). From the Table 4 that majority of farmers (83.33%) owned moderate level of knowledge on chickpea production [15].
| Knowledge categories | Mean score of range | Frequency | Percent |
|---|---|---|---|
| Low | Less than 24.87 | 3 | 12.50% |
| Moderate | 24.87 up to 34.01 | 20 | 83.33% |
| High | Above 34.01 | 1 | 4.17% |
Table 4: Categorization of respondents based on their knowledge level (n=24).
Farmers have their own experienced knowledge on their farming activities. But they may lack knowledge when new technologies introduced to them. Knowledge is important for the increment of production and productivity of chickpea farmers. Different trainings and field days were organized each year to increase the knowledge of farmer on the technologies but there is no standard process of testing the knowledge of chickpea farmers. However, this study developed item test that measures the knowledge of chickpea producing farmers. It was observed that items constructed to test the knowledge of chickpea farmers was highly stable and dependable for measurement of knowledge of chickpea producing farmers. In addition, the findings of this item analysis revealed that majority of respondents owned moderate level of knowledge on demonstration of chickpea production. This indicated that demonstration of chickpea at Adola Rede increased the knowledge of farmers. There is a chance for the improvement of farmers’ knowledge on chickpea production. Farmers Training Center established in each Kebele should be functioned to increase farmers’ knowledge on chickpea production.
Authors would like to acknowledge Bore Agricultural Research Center for financial assistance. Farmers devoted to the demonstration of chickpea on their farm and their willingness to give response on the items were heartily acknowledged.