Journal of Clinical Chemistry and Laboratory Medicine
Open Access
ISSN: 2736-6588

ISSN: 2736-6588
Research Article - (2022)Volume 5, Issue 5
Background and objectives: Hypoxemic respiratory failure is a common mode of demise in COVID-19 disease. We aimed to describe the time course of SPO2 changes in COVID-19 patients treated with and without ivermectin.
Methods: This was a parallel group, prospective comparative study of propensity matched COVID-19 patients (Cycle threshold Ct<25, SPO2<94%). 21 of the patients received Ivermectin (IVM) inclusive regime at 12 mg daily for 5 days, while 26 others received Non-ivermectin Inclusive Regime (NIVM).
Results: The IVM group demonstrated earlier and greater increase in SPO2 (p=0.000) which paralleled greater and faster virological clearance (p=0.000) on Repeat measures Analysis of Variance RMANOVA. There was a significant correlation between absolute SPO2 and absolute Ct on day 5 (r=0.77) and day 7 (r=0.77) both p=0.000. Incremental SPO2 also correlated with incremental Ct. by day 5 (r=0.397, p=0.003) and day 7 (r=0.315, p=0.0002) relative to baseline. Increase in platelet count correlated with increased SPO2 (r=0.252, p=0.029) on IVM, but negatively with NIVM (r=-0.28, p=0.17). Inflammatory markers such as ESR, CRP or D-dimer showed no significant correlation with SPO2. Increase in SPO2 on IVM was magnified in males.
Conclusion: IVM regime appears to be associated with faster and greater increase in SPO2 paralleling faster viral clearance in COVID-19 patients.
Ivermectin; Arterial oxygen saturation; COVID-19; Viral load
The COVID-19 pandemic caused by SARS-CoV-2 has caused global disruptions in all spheres of life, as well as morbidity and mortality in excess of 6 million as of April 2022 [1].
A central feature of this disease, which is commonly the mode of demise, is the variable degree of hypoxemia/respiratory failure (Acute Respiratory Disease Syndrome) [2,3]. This is thought to arise from Immunothrombosis of small pulmonary micro vessels, caused by inflammation, hypercytokinenemia (raised IL-1 beta, IL-6, TNF-alpha) [4,5] and coagulation/microthrombosis, with platelet consumption and fibrinolysis [6,7].
There is also Ventilation/Perfusion (V/Q) mismatch, with perfusion of non-ventilated alveolar spaces in severe COVID-19, and this may contribute to the artetial hypoxemia and consequent reduction in blood oxygen saturation [8]. The SPO2% (arterial oxygen saturation) measured by digital arterial pulse oximeter, is further employed in the classification of the severity of COVID-19 patients into mild outpatient, mild in patient, moderate, severe or critical status [9]. Thus, the SPO2% is both a diagnostic and prognostic parameter in COVID-19 disease and is adopted by the World Health Organization [10] to classify COVID-19 severity.
In addition to vaccines, several novel and repurposed medications have been used to treat or prevent COVID-19 disease [11,12]. Ivermectin has been used both in chemo-prophylaxis, and as a repurposed active treatment of COVID-19, especially in Low and Middle Income Countries [13]. A critical goal of anti COVID-19 therapeutic regime is the reversal of pathophysiological basis of the disease, especially the systemic and pulmonary microthrombosis and cytokine-induced-inflammation, as adumbrated above [11-14].
In this regard, we have previously reported the beneficial effect of Ivermectin on SPO2% in a placebo-controlled double blind study [15], as well as in a single blind study comparing ivermectin alone with ivermectin combined with hydroxychloriquine and Azithromycin [16]. These observations have been confirmed by Stone, et al. [17], who reported a rapid onset of increase in SPO2% within 24 hours, in Zimbabwean and American patients with severe COVID-19, in a retrospective study.
A pharmacodynamic effect of ivermectin to increase arterial oxygen saturation (SPO2%) in an inflammatory disease, such as COVID-19, may also suggest possible utility in chronic non- infectious pulmonary diseases such as acute severe asthma or exacerbation of chronic obstructive Lung Disease which are also mediated by inflammatory cytokines [18,19]. It is therefore of great clinical importance to further evaluated the correlates and determinants of this salutary clinical effect. The aims of our present study were: (1) to examine the time course of SPO2% and change in SPO2% in patients treated with Ivermectin (IVM) and those not treated with Ivermectin (NIVM); (2) to examine the correlation of virological load of SARS-CoV-2 (measured as Cycle threshold (Ct) which is inversely proportional to the viral load) on SPO2%; (3) to determine the impact of age, gender, platelet count, Hemoglobin, D-dimer, and inflammatory parameters (C-Reactive Protein (CRP) and Neutrophil Lymphocyte Ratio) on the efficacy of Ivermectin to increase SPO2%.
This is a sister publication to Thairu, et al. [20] in which other parameters are compared between the IVM and NIVM group. This study focuses on changes in SPO2 and associated correlates. Thus, some of the tables and graphs are duplicated for ease of reference of the reader. The study was undertaken at COVID-9 Control Center, Gwagwalada, Federal Capital Territory, Abuja, Nigeria. The study received ethical review and approval from the University of Abuja Research and Ethics committee. The design of the study was a parallel group, non-randomized type. The studies were undertaken between April and November 2021. Group 1 (Ivermectin, IVM group) received a regimen inclusive of ivermectin 200 ug/kg/day for 5 consecutive days. This usually came to approximately 12 mg daily for 5 days. The patients in this group also received some concurrent medications: Out of a total of 61 IVM patients, 30 received only ivermectin 12 mg daily for 5 days while 31 received IVM 12 mg daily for 5 days together with Hydroxychloriquine HCQ 200 mg daily for 3 days and Azithromycin AZM 500 mg daily for 3 days. Additional medications received in this group were Zinc sulphate 50-100 mg for 7 days and Vitamim C 1000 mg daily for 7 days. In addition, 2 patients received lopinavir/ritonavir and 3 patients received Remdesivir. Group 2 patients did not receive Ivermectin in their regimen (Non-Ivermectin group, NIVM. n=26). They all received Zinc sulphate 50-100 mg daily for 7 days and Vitamin C 1000 mg daily for 7 days. 5 patients in this group received lopinavir/ritonavir combination (Alluvia) 200 mg twice daily for 5 days. Another 5 received Remdesivir, 200 mg stat and then 100 mg daily for 6-11 days, dependent on clinical response. All 26 patients in the group received Clexane (Enoxapramine). Inclusion criteria to study: Quantitative real time RT-PCR positivity for SARS- COVID-19 and clinical symptoms including cough or dyspnea. The N-gene (Nucleocapsid gene) and the E-gene (Envelope gene) Cycle threshold (Ct) of the virus were measured. To make the two groups comparable, the Ct was restricted to 25 and below at baseline (Propensity matching) [21]. Patients were also propensity matched to baseline SPO2 less than 94% for the purposes of the Repeat Measures Analysis of Variance assessment (RMANOVA). All patients included gave informed consent to participate in the study. Patients were excluded from the study, if they did not give consent, or were pregnant, had cardiovascular or pre-existing respiratory disorder, which might affect the digital pulse oximeter measurements.
Transmissive digital pulse oximetry
The partial pressure of pulsatile digital arterial oxygen saturation (SPO2%) was measured using medical/clinical pulse oximeters as we have described prior. The transmissive pulse oximeter was placed on the finger tip of a digit in the non-dominant hand [22].
The patients digits were alcohol cleaned before each measurement, which was daily and at about the same time of each day throughout the study. Fingers with nail polish or tight rings were avoided. No patient had hypotension, cold extremities or severe obesity which may affect pulsatile blood flow and hence the pulse oximeter reading. Pulse oximeter reading correlates well with arterial blood gases and has accuracy of within 2% [23].
Inflammatory and thrombotic/ hematologic parameters
Inflammatory markers such as the erythrocyte sedimentation rate (ESR), the C-reactive protein (CRP), lymphocyte count and Neutrophil Lymphocyte Ratio (NLR) and thrombotic/hematologic parameters such as platelet count and the D-dimer in the 2 groups were also measured.
Statistical analysis
Data were stated as mean +/-SD or SEM, or with 95% Confidence Intervals. Statistical analyses included Repeated Measures Analysis of Variance (RMANOVA) for time effect, treatment effect and time-treatment interactions. One way ANOVA, unpaired t tests, with 95% Confidence interval for the difference were quoted as appropriate. Using both absolute and change in SPO2% over time as dependent variable, the Linear regression analyses was computed against various parameters to assess possible significant Pearson’s correlations and P values. Appropriate graphs with line of best fit were displayed in certain instances. Box and whisker plots were employed where appropriate. The null hypothesis of no difference was rejected if p<0.05. This trial was registered with Pan African Clinical Trials Registry PACTR 202108891693522.
The baseline clinical and demographic parameters of the patients in the two groups are summarized in Table 1, after propensity matching as above. The two groups were statistically comparable. However, Lymphocyte count and D dimer were lower for the NIVM group, while number with cough, myalgia and headache were higher for the IVM group.
| Variable | IVM only | Non-IVM | Overall | P-value (test) |
|---|---|---|---|---|
| Total numbers | 21 | 26 | 47 | |
| Mean age (SD) years | 39.8 | 44.8 | 42.6 | 0.219 (test) |
| Sex (Male %) | 13(61.9) | 17(65.4) | 30(63.8) | 0.805 (chi2) |
| Oxygen use | 2(9.5) | 7(29.2) | 9(20) | 0.100(chi2) |
| Ventilator | 2(9.5) | 1(5.0) | 3(7.3) | 0.578 (chi2) |
| Vaccination | 0(0.0) | 7(53.9) | 7(31.8) | 0.008(chi2) |
| Hematology | ||||
| Hemoglobin g/dl | 12.03 | 12.49 | 12.3 | 0.49 |
| WBC × 109 cells/liter | 9.82 | 8.9 | 9.31 | 0.175 |
| Lymphocyte × 109 cells/liter | 32.67 | 45.65 | 39.85 | 0.001 |
| Neutrophils | 61.14 | 57.84 | 59.32 | 0.422 |
| × 109 cells/liter | ||||
| Neutrophil to lymphocyte ratio (NLR) | 2.9 | 1.21 | 2.01 | 0.0046 |
| Platelet count | 193.7 | 183.2 | 187.9 | 0.534 |
| × 109 cells/liter | ||||
| Viral load cycle threshold Ct. | ||||
| N-gene CT | 27.33 | 18.25 | 22.31 | 0 |
| E-gene CT | 21.18 | 15.5 | 18.03 | 0 |
| Inflammatory markers | ||||
| ESR ml/h Westergren | 12.62 | 12.15 | 12.36 | 0.442 |
| C-reactive protein mg/l | 15.13 | 11.51 | 13.13 | 0.01 |
| D-dimer ng/ml FEU (Fibrinogen equivalent Unit) | 218.9 | 207.5 | 212.6 | 0.067 |
| SpO2% | 89.1 | 87.1 | 88 | 0.961 |
| Symptoms at baseline (%) | ||||
| Diarrhea | 3(15.8) | 2(8.0) | 5(11.3) | 0.42 |
| Anosmia | 7(35.0) | 15(57.7) | 22(47.8) | 0.127 |
| Ageusia | 5(23.8) | 8(30.8) | 13(27.7) | 0.596 |
| Dyspnea | 3(15.0) | 4(15.4) | 7(15.2) | 0.971 |
| Headache | 12(60.0) | 6(23.1) | 18(39.1) | 0.011 |
| Cough | 17(80.9) | 7(26.9) | 24(51.1) | 0 |
| Myalgia scores | 1.57 | 2 | 1.8 | 0.0062 |
Table 1: Propensity matched baseline variables in the IVM and NIVM groups (SPO2% <94).
The comparative time course (IVM vs. NIVM) of the Cycle threshold (Inverse of SARS-CoV-2 viral load) for E-and N-gene are shown in Figures 1 and 2. Note that increase in Ct (and hence viral clearance) is statistically faster in the IVM group (P=0.0000) after allowing for time treatment interaction. Note that by day 5, most in the IVM group are already in the 35-40 Ct range, as opposed to NIVM group where the Ct counts are still hovering around the 30 or less mark. A Ct count of above 35 is regarded as ‘negative’ by most laboratories.
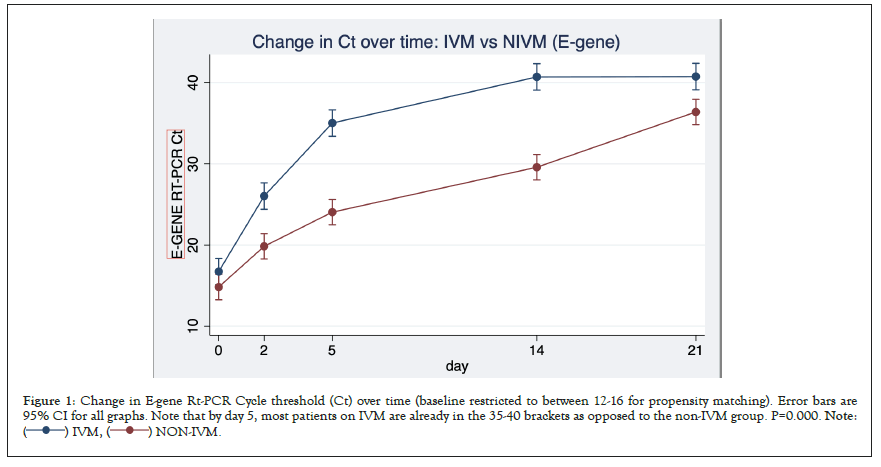
Figure 1: Change in E-gene Rt-PCR Cycle threshold (Ct) over time (baseline restricted to between 12-16 for propensity matching). Error bars are
95% CI for all graphs. Note that by day 5, most patients on IVM are already in the 35-40 brackets as opposed to the non-IVM group. P=0.000. Note: .
.
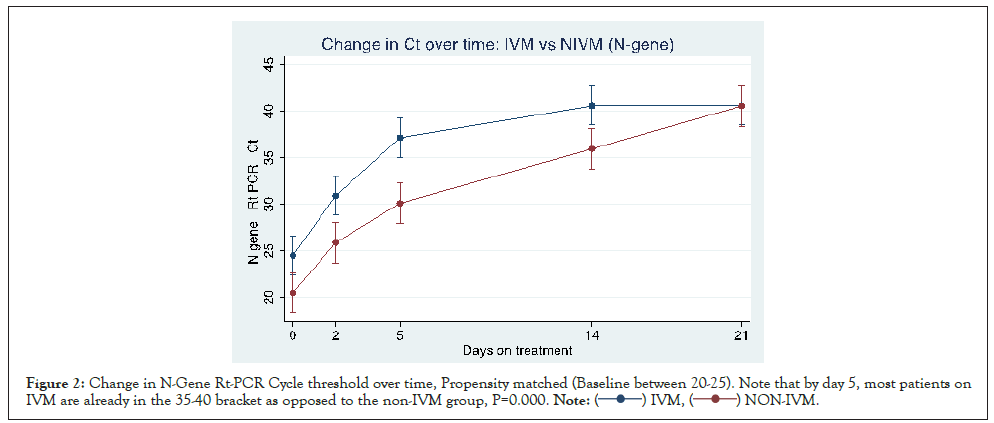
Figure 2: Change in N-Gene Rt-PCR Cycle threshold over time, Propensity matched (Baseline between 20-25). Note that by day 5, most patients on
IVM are already in the 35-40 bracket as opposed to the non-IVM group, P=0.000. .
.
Change in SPO2%: The comparative time course (IVM vs. NIVM) of the SPO2% (arterial oxygen saturation) is shown in Figure 3. Excluded are patients who received oxygen, so this was ‘room air only’ assessment. There was a statistically significant treatment difference between IVM and NIVM by repeated measures analysis of variance RMANOVA (p=0.000) By day 5, in the IVM group, the SPO2% increased to 97% (+7.9%) compared to only 89.3% (+2.2%) in the NIVM group. There was also a temporal correspondence with the changes in Ct mirroring the change in SPO2%.
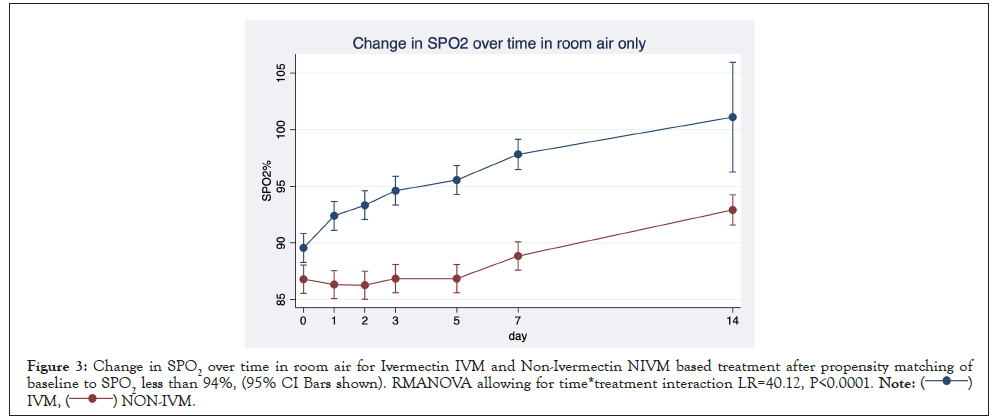
Figure 3: Change in SPO2 over time in room air for Ivermectin IVM and Non-Ivermectin NIVM based treatment after propensity matching of
baseline to SPO2 less than 94%, (95% CI Bars shown). RMANOVA allowing for time*treatment interaction LR=40.12, P<0.0001.
 .
.
Correlations with absolute SPO2% and change in SPO2% (Delta SPO2)
Table 2 explores linear correlations between absolute SPO2% on days 2, 5 and 7 and change in SPO2% (Delta SPO2%) on the one hand with selected variables. Pairwise correlation (r) between Day 5 SPO2, Day 7 SPO2, DeltaSPO2_Day 5 (Day 5 SPO2 minus baseline SPO2) and Delta SPO2_Day 7 (Day 7 SPO2 minus baseline SPO2) as well as other parameters (P values displayed). There were significant correlations between day 5 N_Ct, day 5 E_Ct, against Day 5 SPO2, Day 7 SPO2, Delta day 7 SPO2 and Delta day 5 SPO2. There was also a strong trend in association between change in Ct and change in SPO2. Strong associations are also seen between hemoglobin levels and ESR against SPO2%. Lymphocyte count correlated negatively with SPO2%. (The lower the lymphocyte counts the higher the SPO2%). There is also a weak and insignificant negative correlation between change in NLR and change in SPO2, suggesting that as NLR decreases, SPO2 increases.
| Parameter | Day 5 SPO2 | Day 7 SPO2 | Delta SPO2 (7) | Delta SPO2(5) |
|---|---|---|---|---|
| (Day 7-baseline) | (Day 5-baseline) | |||
| Day 5 N-Ct | 0.769(0.0000)* | 0.772(0.0000)* | 0.337(0.0031)** | 0.397(0.0002)** |
| Day 5 E-Ct | 0.646(0.0000)* | 0.620(0.0000)* | 0.315(00059)** | 0.401(0.0002)** |
| Delta N-Ct | 0.206(0.0758)# | 0.076(0.492) | ||
| (Day 5-baseline) | ||||
| Delta E-Ct | 0.207(0.0743)# | 0.225 (0.0396)** | ||
| (Day 5-baseline) | ||||
| Delta-CRP | -0.082(0.485) | |||
| (Day 7-baseline) | ||||
| Delta-ESR | 0.0071(0.952) | |||
| (Day 7-Baseline) | ||||
| Delta-DDimer | 0.129(0.269) | |||
| (Day 7-Baseline) | ||||
| Day 7 CRP | -0.034(0.773) | |||
| Day 7 D_Dimer | 0.0111(0.925) | |||
| Day 7 ESR | 0.388(0.0006)* | |||
| Day 7 Platelet | 0.076(0.5151) | |||
| Day 7 Hb | 0.0194(0.096)* | |||
| Day 7 Lymphocyte | -0.387 | |||
| (0.0006)* | ||||
| Delta platelet | 0.252(0.029)** | |||
| (Day 7-baseline) | ||||
| Delta Hb | 0.169(0.147) | |||
| (Day 7-baseline) | ||||
| Delta lymphocyte | 0.659(0.615) | |||
| (Day 7-baseline) | ||||
| Delta Neutrophil | 0.125(0.287) | |||
| (Day 7-baseline) | ||||
| Day 7 NLR | 0.208 | |||
| (0.073)# | ||||
| Delta NLR | -0.098 | |||
| -0.399 |
Note: *Significant association against SPO2 absolute values; **Significant association against change in SPO2 values; # Strong trend towards significant association.
Table 2: Linear regression table showing pairwise correlation (r) between Day 5-SPO2, Day 7-SPO2, Delta SPO2_Day 5 and Delta SPO2_Day 7 and other parameters (P values).
Figure 4 is a scatterplot showing a strong relationship between Nucleocapsid Gene Cycle threshold (Inversely proportional to viral load) and SPO2% on day 5. r=0.7689, P=0.0000. The results for Envelope gene are similar r=0.646, P=0.0000. The relationship is still strong by day 7.
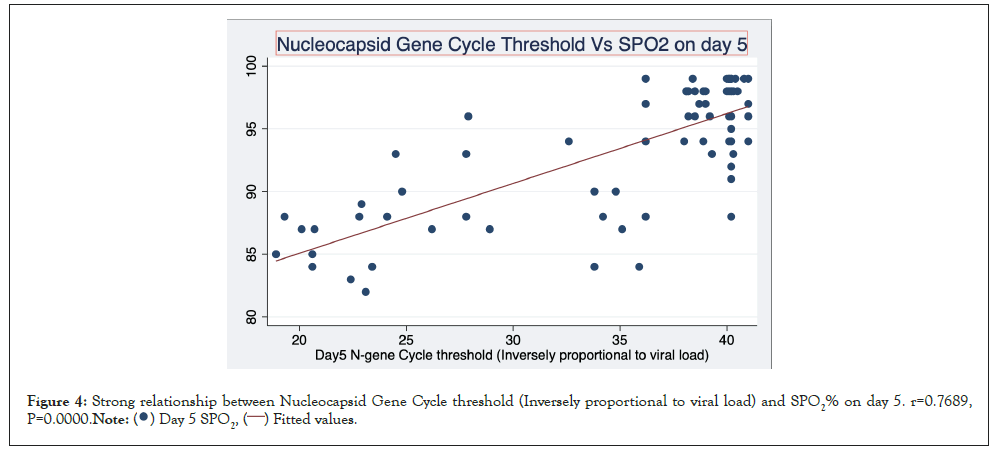
Figure 4: Strong relationship between Nucleocapsid Gene Cycle threshold (Inversely proportional to viral load) and SPO2% on day 5. r=0.7689,
P=0.0000. .
.
Figure 5 is a scatterplot depicting the significant relationship between change in E_Ct and change in SPO2 by day 5 (r=0.225, P=0.0396).
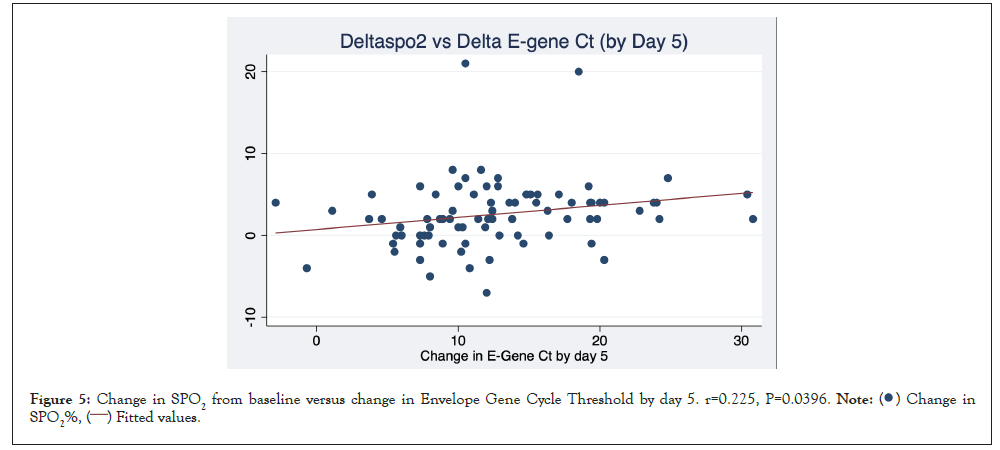
Figure 5: Change in SPO2 from baseline versus change in Envelope Gene Cycle Threshold by day 5. r=0.225, P=0.0396.
 .
.
Figures here explore the relationship between change in platelet count and change in SPO2%. A significant association was seen between increase in platelet count and increase in SPO2. (r=0.252 P=0.029). This trend is strengthened when restricted to patients who received IVM r=0.389 p=0.0056 and reversed when limited to patients who did not receive Ivermectin NIVM. r=-0.277 P=0.170 (Figures 6-8).
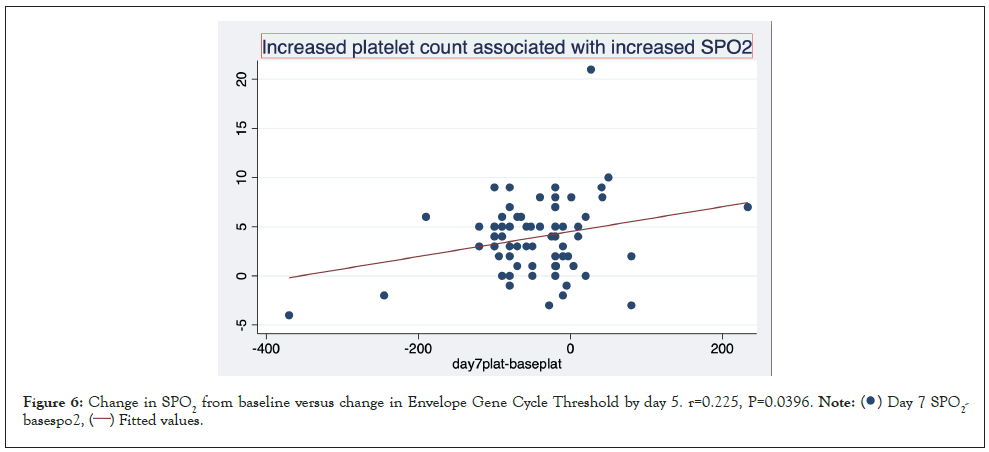
Figure 6: Change in SPO2 from baseline versus change in Envelope Gene Cycle Threshold by day 5. r=0.225, P=0.0396. .
.
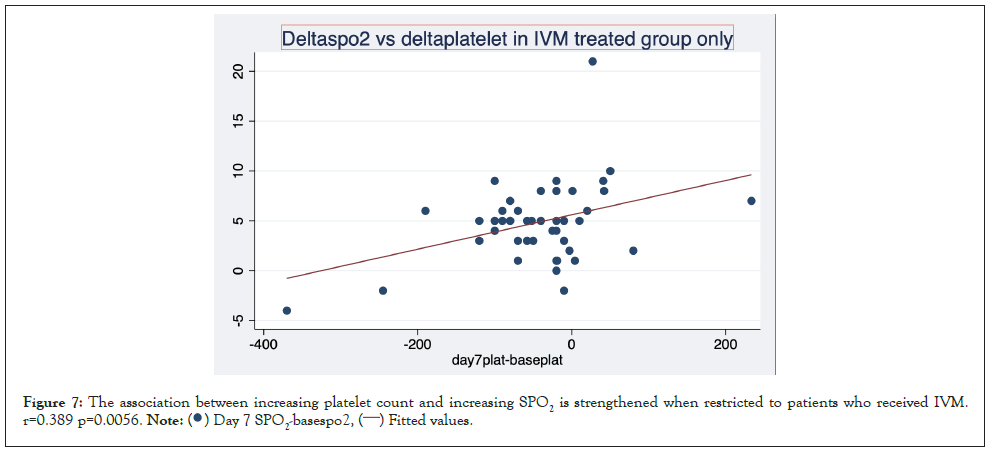
Figure 7: The association between increasing platelet count and increasing SPO2 is strengthened when restricted to patients who received IVM.
r=0.389 p=0.0056. .
.
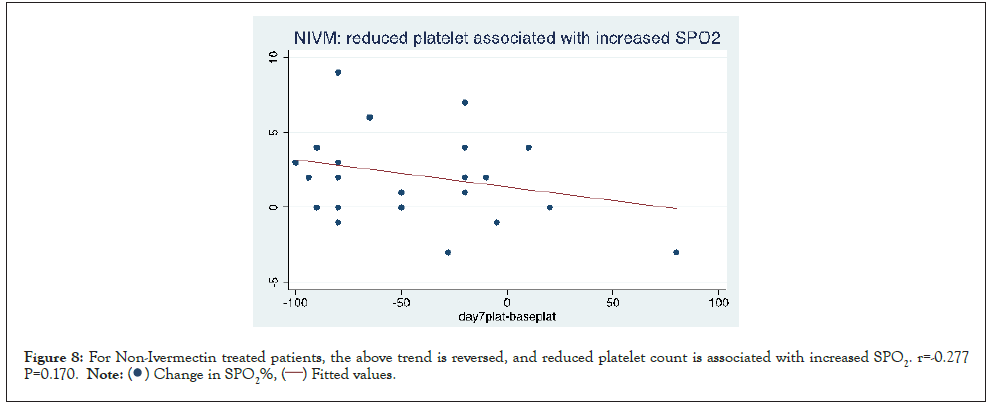
Figure 8: For Non-Ivermectin treated patients, the above trend is reversed, and reduced platelet count is associated with increased SPO2. r=-0.277
P=0.170.
Figures here explore the effect of sex on the increase in SPO2% with IVM (Day 2 and 7 respectively). Day 2 mean increase in SPO2=1.9% On IVM vs. -0.3% on NIVM where sex is female. (P=0.173). But Day 2 mean increase in SPO2=1.3% on IVM vs. -0.8% on NIVM where sex is Male. (P=0.010). It suggests that the increase is amplified where sex is male. From the graph, it can be seen that there are instances with dramatic increase in SPO2 on the IVM arm (Figures 9 and 10).
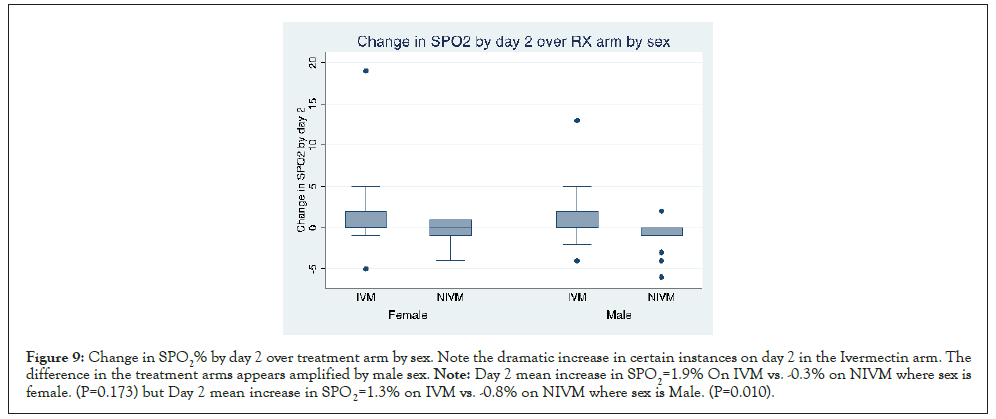
Figure 9: Change in SPO2% by day 2 over treatment arm by sex. Note the dramatic increase in certain instances on day 2 in the Ivermectin arm. The difference in the treatment arms appears amplified by male sex. Note: Day 2 mean increase in SPO2=1.9% On IVM vs. -0.3% on NIVM where sex is female. (P=0.173) but Day 2 mean increase in SPO2=1.3% on IVM vs. -0.8% on NIVM where sex is Male. (P=0.010).
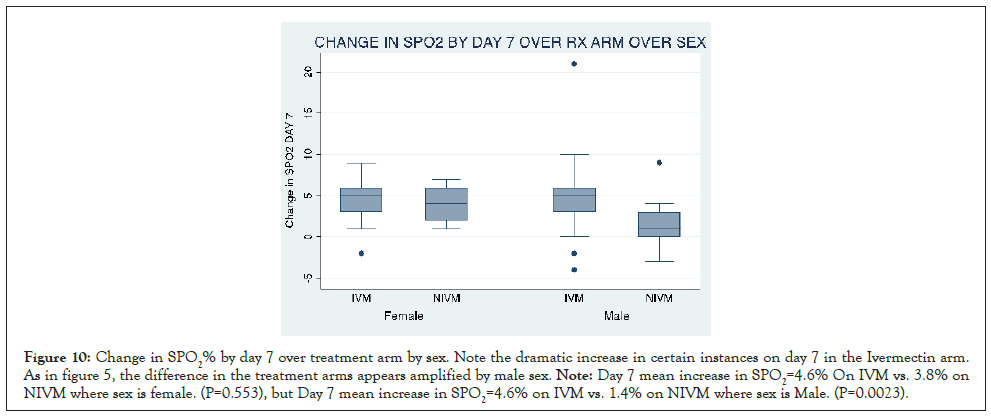
Figure 10: Change in SPO2% by day 7 over treatment arm by sex. Note the dramatic increase in certain instances on day 7 in the Ivermectin arm. As in figure 5, the difference in the treatment arms appears amplified by male sex. Note: Day 7 mean increase in SPO2=4.6% On IVM vs. 3.8% on NIVM where sex is female. (P=0.553), but Day 7 mean increase in SPO2=4.6% on IVM vs. 1.4% on NIVM where sex is Male. (P=0.0023).
The goal of this study was to investigate the time profile of arterial oxygen saturation in COVID-19 in IVM treated versus NIVM treated individuals. Secondly, we set out to explore correlates and determinants of change in digital arterial oxygen saturation measured by pulse oximeter in COVID-19 patients. In this propensity-matched study utilizing patients on room air with SPO2%<94, our results demonstrate a significantly greater increase inSPO2% in the IVM containing regime than the NIVM group. (P=0.000 RMANOVA).SPO2% increased from baseline by +7.9% on IVM but by only +2.2% on NIVM regimen by day 5. There was also a temporal correspondence between theSPO2% time profile, with the fall in viral load (increase in Cycle threshold Ct of genes E and N). These findings confirm our previous reports on ivermectin virucidal pharmacodynamics against SARS-CoV-2 and the concomitant increase in arterial oxygen saturation in COVID-19 disease. [15,16]. Other workers have also reported a rapid rise inSPO2% within 24 hours in severe COVID-19 patients, when treated with ivermectin in the US and Zimbabwe [17,24].
With the data at our disposal, we investigated statistically which factors may be associated with this increase in SPO2%. As above, absolute Cycle threshold Figures correlated strongly with absolute SPO2 Figures, and trends in both parameters also correlated, although less strongly. This suggests a quantitative relationship between the drug regimens induced virucidal effect and the increased arterial oxygen saturation in individual patients. To our knowledge, this is a novel report. Change in inflammatory indices such as C reactive protein; ESR, Neutrophil count and Neutrophil/lymphocyte ratio were poorly correlated with change in SPO2%. By contrast, there was a significant correlation between increased platelet count and increase in SPO2%. This change is accentuated when the analysis is limited to IVM using patients but reversed with NIVM patients. Change in D dimer levels did not significantly correlate with change in SPO2. Absolute day 7 hemoglobin correlates very weakly with day 7 SPO2, although delta hemoglobin did not correlate with delta SPO2. These results suggest that changes in hematological/thrombotic variables may play a role in the increase in oxygen saturation reported in this study. Gender may also contribute to the magnitude of the increase in SPO2%. Our findings suggest that the noticeable increase in SPO2 in the IVM arm is accentuated by male sex. It is established that female gender by innate immunological and or ACE2 or Transmembrane Serine Protease 2 (TMPRSS2) viral entry receptors, which are under androgenic regulation, are less prone to severe COVID-19 than men [25]. There was a significantly greater increase in SPO2% on NIVM in female than in Male patients, whilst this gender difference was not seen in the IVM group. Speculatively, this may indicate an interaction between IVM to mitigate the androgen mediated platelet hypercoagulability in men [26] and thus cause similar SPO2% increase. Collectively, our findings strongly suggest that diminution in SARS-CoV-2 viral load (inverse of Ct), platelet count changes and gender are significant contributors to the increased SPO2% in these patients. The molecular mechanisms of these findings, however, remain unexplained by this study. The hypoxemia and reduced SPO2% in COVID-19 patients follows SARS-CoV-2 viral invasion of alveolar macrophages, which cause elaboration of the NF kappa B transcription and production of the pro inflammatory cytokines (IL-1B and NLRP3 inflammasome) [27]. This is succeeded by a feed forward release of IL-6, Tumor Necrosis Factor TNF alpha, massive release of neutrophils and Neutrophil Extracellular Traps (NETs). The neutrophils cause activation of coagulation, platelet sequestration and thrombin activation, clot and fibrin formation, with virucidal activity [28]. The resultant cytokine induced "immunothrombosis" cause a bidirectional mutual activation of alveolar microvascular thrombosis and inflammation with inflammatory cell infiltrates, necrosis and perfusion of unventilated alveoli, V/Q mismatch and fall in arterial oxygenation [29]. A contribution from bronchial nicotinic cholinergic mediated inflammation has also been suggested [29].
The greater beneficial effect of Ivermectin Containing Regimen (IVM ) than IVM on SPO2% in COVID-19 may conceivably be attributed to the inhibition by ivermectin of pro-inhibitors cytokines by its suppression of the JAK-STAT pathway [30] , competitive interaction with SARS-CoV-2 spike protein S reducing viral binding and entry [31] and direct activation of neuronal acetylcholine receptor and the vagus nerve [32] causing reduced bronchial inflammation and dilation. A limitation of our study was the unavailability of inflammatory cytokine measurements. Although viral load (Ct) may serve as a surrogate for cytokines, the actual blood or breath levels of IL-1B, IL-6, TNF would have provided a direct assessment of their kinetics and oxygenation impact. Owing to the fact that ivermectin increases SPO2% at least in part by cytokine suppression, it is attractive to speculate that it might also enhance arterial oxygenation in non-infectious chronic respiratory disorders such as bronchial asthma or chronic obstructive pulmonary disease (COPD) where inflammation and cytokines also play a role [18,32]. This should be a subject of future inquiry.
Ivermectin regime (IVM) caused a more rapid onset and greater increase in SPO2%, than the NIVM arm, in hypoxemic COVID-19 patients breathing room air. The rise in SPO2% was concomitant with a fall in SARS-CoV-2 viral load (increased Ct) with a temporal correspondence and correlation. The SPO2% correlated significantly with changes in platelet count. Males not receiving ivermectin (NIVM) had a blunted increase in SPO2% compared to the females in the same group. By contrast, ivermectin (IVM) conferred similar increase in SPO2% in Males and females. Ivermectin may increase arterial oxygenation mainly through its virucidal action.
Funding was partially provided by the Central Bank of Nigeria Human Research Intervention and Development Scheme.
[Crossref] [Google Scholar] [PubMed].
[Crossref] [Google Scholar] [PubMed].
[Crossref] [Google Scholar] [PubMed].
[Crossref] [Google Scholar] [PubMed].
[Crossref] [Google Scholar] [PubMed].
[Crossref] [Google Scholar] [PubMed].
[Crossref] [Google Scholar] [PubMed].
[Crossref] [Google Scholar].
[Crossref] [Google Scholar] [PubMed].
[Crossref] [Google Scholar] [PubMed].
[Crossref] [Google Scholar] [PubMed].
[Crossref] [Google Scholar] [PubMed].
[Crossref] [Google Scholar].
[Crossref] [Google Scholar].
[Crossref] [Google Scholar] [PubMed].
[Crossref] [Google Scholar] [PubMed].
[Crossref] [Google Scholar].
[Crossref] [Google Scholar] [PubMed].
[Crossref] [Google Scholar].
[Crossref] [Google Scholar] [PubMed].
[Crossref] [Google Scholar] [PubMed].
[Crossref] [Google Scholar] [PubMed]
[Google Scholar] [PubMed].
[Crossref] [Google Scholar] [PubMed].
[Crossref] [Google Scholar] [PubMed].
[Crossref] [Google Scholar] [PubMed].
[Crossref] [Google Scholar] [PubMed].
[Crossref] [Google Scholar].
Citation: Babalola OE, Ajayi A , Yunusa T, Ndanusa YA, Ogedengbe J, Omede O (2022) Ivermectin is Associated with Increase in SPO2 in Hypoxemic SARS-CoV-2 Patients: Pharmacodynamic Profile and Correlates. J Clin Chem Lab Med. 5:222.
Received: 11-May-2022, Manuscript No. JCCLM-22-17450; Editor assigned: 16-May-2022, Pre QC No. JCCLM-22-17450 (PQ); Reviewed: 30-May-2022, QC No. JCCLM-22-17450; Revised: 06-Jun-2022, Manuscript No. JCCLM-22-17450 (R); Published: 13-Jun-2022 , DOI: 10.35248/JCCLM.22.5.222
Copyright: © 2022 Babalola OE, et al. This is an open access article distributed under the terms of the Creative Commons Attribution License, which permits unrestricted use, distribution, and reproduction in any medium, provided the original author and source are credited.