Journal of Physical Chemistry & Biophysics
Open Access
ISSN: 2161-0398
ISSN: 2161-0398
Research Article - (2022)Volume 12, Issue 4
This study investigated the relationship between measured and console volume computed tomography dose index (CTDIvol) in multislice CT scanners. The measured CTDI values were determined from kerma length product measured using pencil ionization chamber inserted in the holes of standard CT phantoms with diameters 16 and 32 cm, which respectively mimic adult head and body using the procedures recommended by International Electro-technical Commission. Significantly large deviations were observed between the measured and console CTDIvol values in multislice CT scanners.
CT (Computed Tomography); CTDI (Computed Tomography Dose Index); Phantom
Computed Tomography Dose Index (CTDI) was introduced for dose optimization and quality assurance in axial CT [1]. In the axial CT, this approach determined, to a good approximation, the average dose for a series of scans. However, the introduction of spiral and multislice CT made the use of this approach in the modern CT designs debatable. While some studies claim that the CTDI approach can also be used in multislice CT, others claim on the contrary. The later argue that as modern designs of multislice CT scanners tend to increase in the scan speed and beam widths, the 100 mm ionization chambers can no longer be used to characterize the entire beam from a single scan profile. The recent development of automatic tube current modulation systems that have been designed to compensate for changes in attenuation will not delineate whether or not the dose is being delivered appropriately over the scan length. In order to ensure confidence in the dose optimization and quality assurance the CTDI approach requires continuous modification to accommodate the technological advancements. This is possible because even after the introduction of spiral CT the CTDI was modified to take into account the effect of pitch [2-4].
The Computed Tomography Dose Index (CTDI) as the traditional quantity for dose estimation in CT examinations expressed in mGy, is calculated as described elsewhere [5]:
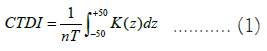
where nT is the total beam collimation (mm) with n the number of active detector rows, T is the nominal slice collimation (mm) and K(z) is the Kerma-Length Product (KLP), which is defined as the product of kerma and thickness of tomographic sections scanned for one gantry rotation. KLP is measured using a 100 mm-pencil ion chamber positioned free in the air or inside the centre and periphery holes of the standard CT phantoms. The phantoms are homogeneous cylinders of diameters 16 cm for head and 32 cm for body made of Polymethylmethacrylate (PMMA). Since the periphery CTDI values are approximately twice those at the centre, the weighted CTDI value (CTDIw) is of interest and is calculated as described elsewhere [5]:
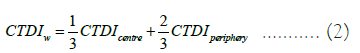
CTDIw gives estimate for the average dose delivered in a number of tomography sections exposed for a single axial scan mode. In order to represent radiation dose for spiral mode it is essential to take into account gaps or overlaps between the X-ray beams during consecutive rotations of the X-ray source. To do this, volume CTDIw denoted as CTDIvol is calculated as described elsewhere [5]:
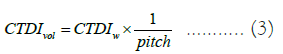
This quantity represents the average absorbed dose over the x, y and z directions of the scanned region within 100 mm length of the ion chamber. However, the CTDIvol remains unchanged whether the scan coverage is equal or greater than 100 mm [5].
To comply with the International Electro-technical Commission (IEC) recommendations all CT scanners display CTDI quantities such as weighted CTDI and volume CTDI for dose optimization and quality assurance [6,7]. CTDI was introduced as a dose descriptor in traditional axial CT scans. Some technological developments including spiral and multislice CT have opened a debate on whether the CTDI approach is still appropriate in the modern designs. In order to establish the suitability of the traditional CTDI approach in spiral multislice CT, this work conducted a validation study to compare the measured and console CTDIvol in spiral multislice CT scanners.
The study was conducted using six spiral multislice CT scanners acquired by six different hospitals. Information about the scanners types, models are summarized in Table 1. For the sake of simplicity in the presentation of data, the CT scanners have been coded.
| CT | CT type | Type and model of CT scanner | Manufacturer |
|---|---|---|---|
| SE6C | Siemens | Somatom Emotion 6 | Siemens (China) |
| PB64 | Phillips | Brilliance 64 | Philips (USA) |
| SE6G | Siemens | Somatom Emotion 6 | Siemens HealthCare (German) |
| SS16 | Siemens | Somatom Sensation 16 | Siemens HealthCare (German) |
| SP128 | Siemens | Somatom Perspective 128 | Siemens Medical (Shanghai China) |
Table 1: Summary of CT scanner types and models used in this study.
Determination of CTDI according to Equation 1 requires Kerma-Length Product (KLP) values, measured free in air or in standard CT phantoms. These measurements were conducted using SE6C, PB64, SS16, SP128 and SE6G CT scanners, based on hospitals’ routine protocols for one rotation of the gantry. These measurements were made using a 100 mm-pencil Unfors Xi CT ion chamber (Serial No. 177013) that was connected to Unfors Xi electrometer. The Unfors electrometer had the uncertainty of 5%, calibration beam quality was RQT, maximum relative deviation for kVp of 3% and energy dependence <5%. The calibration factors were traceable to the international measurement systems [8].
To conduct KLP measurements free in air, the ion chamber was mounted on its stand and positioned free in the air in the scan plane in such a way that the middle of the active region of the chamber, indicated by the shaded part in Figure 1a, was at the centre of the gantry as shown in Figure 1b. The topogram or surview of the ion chamber was then acquired, the scan range (in the middle of the active region of the chamber) selected, the routine head protocol selected, and the scan initiated. The scan parameters, console CTDIvol and KLP values were recorded in the CTDI data sheets such as shown in Figure 1. Additional free-in-air KLP measurements for routine chest, abdomen and pelvis protocols were made using similar procedures but with the automatic tube current modulation system deactivated (Table 2).
| TMJ routine protocol | Chamber position | Tube potential (kV) | Tube current (mAs) | Rotation time (s) | Beam collimation (mm) | Slice thickness (mm) | Table feed (mm) | Console CTDIvol (mGy) | KLP (mGy.cm) |
|---|---|---|---|---|---|---|---|---|---|
| Head | Free in air | 120 | 250 | 1 | 12 × 0.75 | 4.5 | 9 | 60.48 | 45.84 |
| 60.48 | 45.89 | ||||||||
| C | 120 | 250 | 1 | 12 × 0.75 | 4.5 | 9 | 60.48 | 42.45 | |
| 60.48 | 42.33 | ||||||||
| N | 120 | 250 | 1 | 12 × 0.75 | 4.5 | 9 | 60.48 | 49.19 | |
| 60.48 | 49.04 | ||||||||
| W | 120 | 250 | 1 | 12 × 0.75 | 4.5 | 9 | 60.48 | 46.96 | |
| 60.48 | 47.11 | ||||||||
| S | 120 | 250 | 1 | 12 × 0.75 | 4.5 | 9 | 60.48 | 44.71 | |
| 60.48 | 44.36 | ||||||||
| E | 120 | 250 | 1 | 12 × 0.75 | 4.5 | 9 | 60.48 | 48.06 | |
| 60.48 | 47.81 |
Table 2: CTDI data sheet for routine head protocol using SS16.

Figure 1: Ion chamber placed free in the air in the scan plane at the centre of the gantry.
Measurements of KLP in the head phantom, shown in Figure 2a right, was made using routine head protocol with the ion chamber inserted in five holes (one at a time) labeled center (C), North (N), East (E), South (S) and West (W) shown in Figure 2b. In each turn of the hole measurements, the four remaining holes had their inserts in place.

Figure 2: (a) Standard CT phantoms of diameters 32 cm for body and 16 cm for head and (b) insert holes labeled C, N, E, S, and W.
With the ion chamber inserted into one of the holes as shown in Figure 3a, the head phantom was placed in the scan plane as shown in Figure 3b. The topogram or surview of the phantom was then acquired, the scan range (at the middle of the phantom) selected, routine head protocol also selected and the scan initiated.

Figure 3: A phantom placed at the scan plane at the centre of the gantry with the ion chamber inserted in the centre hole.
The scan parameters used and the KLP values obtained were recorded in the CTDI data sheets such as shown in Table 2. The ion chamber was then replaced into another hole to acquire additional KLP values and the same procedures were repeated until measurements in all five holes were made. KLP measurements in phantom under routine chest protocol were made using the body phantom shown in Figure 2a. The same procedures, including the positioning of the phantom and ion chamber, the acquisition of the topogram or surview and the selection of routine protocol were made as described during KLP measurements in the head phantom. However, in the chest measurements, after the acquisition of topogram or surview and the selection of the scan range, the AEC system was deactivated then the scan initiated. The same procedures were repeated to obtain KLP values for routine abdomen and pelvic protocols.
The mean scan parameters used and KLP values obtained during different measurements were extracted from the CTDI data sheets and summarized in Table 3.
| Console Readings | Kerma-length product (mGy.cm) |
|||||||||||
|---|---|---|---|---|---|---|---|---|---|---|---|---|
| Protocol | CT | Tube potential (kV) | Effective mAs or mAs/slice | Rotation time (seconds) | Slice thickness (mm) | Beam collimation (mm) |
Table feed (mm) |
Pitch factor | Console CTDIvol (mGy) |
Air | Centre | Periphery |
| Head | SE6C | 130 | 350 | 1.5 | 4.9 | 16.3 | 16.3 | - | 79.1 | 168.5 | 54.3 | 120.6 |
| PB64 | 120 | 350 | 0.8 | 2 | 40 | - | 0.5 | 57.3 | 234.4 | 74.4 | 138 | |
| SE6G | 130 | 267 | 1.5 | 5 | 10.3 | 10 | - | 55.4 | 9.3 | 45.3 | 46.6 | |
| SS16 | 120 | 267 | 1 | 4.5 | 9 | 9 | - | 60.48 | 45.8 | 42.4 | 47.3 | |
| SP128 | 130 | 270 | 2 | 10 | 7.2 | 7.2 | - | 80.9 | 74.4 | 43.8 | 49.1 | |
| Chest | SE6C | 130 | 70 | 0.6 | 5 | 11.1 | - | 0.9 | 7.7 | 63.5 | 9.2 | 21.1 |
| PB64 | 120 | 300 | 0.8 | 0.9 | 40 | - | 0.5 | 18.3 | 86.4 | 33.2 | 40 | |
| SE6G | 130 | 100 | 1 | 1 | 1 | 10 | - | 1 | 2.8 | 0.6 | 1.2 | |
| SS16 | 120 | 100 | 1 | 1 | 2 | 10 | - | 8.4 | 2.7 | 0.8 | 1.7 | |
| SP128 | 130 | 100 | 1 | 1 | 2 | 2 | - | 12.6 | 7.4 | 1.4 | 2.9 | |
| Abdomen | SE6C | 130 | 120 | 0.6 | 5 | 12 | - | 0.9 | 13.1 | 122 | 23.3 | 45 |
| PB64 | 120 | 250 | 0.8 | 0.9 | 40 | - | 0.7 | 20.3 | 99.2 | 62.8 | 91.6 | |
| SE6G | 130 | 100 | 0.8 | 5 | 10 | 10 | - | 10 | 12.7 | 5.3 | 13.2 | |
| SS16 | 120 | 175 | 0.8 | 5 | 10 | 10 | - | 11 | 20.4 | 5.9 | 12.5 | |
| SP128 | 130 | 130 | 0.6 | 5 | 38.4 | - | 0.6 | 14.3 | 179.7 | 34.2 | 74.9 | |
| Pelvis | SE6C | 130 | 120 | 1 | 3 | 6 | - | 1.8 | 15.2 | 30 | 10.4 | 27.3 |
| PB64 | 120 | 250 | 0.8 | 0.9 | 40 | - | 0.7 | 20.3 | 99.2 | 62.8 | 91.6 | |
| SE6G | 130 | 105 | 1 | 5 | 12 | - | 1.5 | 11.9 | 58.5 | 19.1 | 39 | |
| SS16 | 120 | 200 | 0.5 | 5 | 24 | - | 0.5 | 14 | 84.2 | 23.8 | 49.9 | |
| SP128 | 130 | 120 | 1 | 5 | 38.4 | - | 1.2 | 13.2 | 242.3 | 35.3 | 59.9 | |
Table 3: Scan parameters used for routine protocols at different hospitals during CTDI determination.
The air, centre and periphery CTDI values presented in Table 4 were obtained according to Equation (1) using KLP and beam collimation values extracted from Table 3 as inputs to this equation. Furthermore, the CTDIw and CTDIvol values also presented in this table were obtained using Equations (2) and (3) respectively. The values of measured and console displayed CTDIvol are also presented in this table. It is evident from this table that for most hospitals and protocols, the periphery CTDI values were as expected about twice the centre CTDI values. The observed deviations in the head protocols could be attributed to scatter radiation that contributed to number photons detected by the ion chamber when inserted in the centre hole of the head phantom.
| Protocol | Hospital | CTDIair | CTDIcentre | CTDIperiphery | CTDIw | Measured CTDIvol (mGy) | Console CTDIvol (mGy) |
|---|---|---|---|---|---|---|---|
| Head | SE6C | 103.4 | 33.3 | 74 | 60.5 | 60.3 | 79.1 |
| PB64 | 58.6 | 18.6 | 34.5 | 29.2 | 55.9 | 57.3 | |
| SE6G | 9 | 44 | 45.2 | 44.8 | 46.2 | 55.4 | |
| SS16 | 50.9 | 47.1 | 52.5 | 50.7 | 50.7 | 60.48 | |
| SP128 | 103.4 | 60.9 | 68.2 | 65.8 | 65.8 | 80.9 | |
| Chest | SE6C | 57.2 | 8.3 | 19 | 15.4 | 18.2 | 7.7 |
| PB64 | 21.6 | 8.3 | 10 | 19.4 | 40 | 18.3 | |
| SE6G | 27.6 | 5.5 | 12.3 | 10 | 1 | 1 | |
| SS16 | 13.4 | 3.9 | 8.3 | 6.8 | 1.4 | 8.4 | |
| SP128 | 37.2 | 6.9 | 14.3 | 11.9 | 11.9 | 12.6 | |
| Abdomen | SE6C | 101.7 | 19.4 | 37.5 | 31.4 | 37 | 13.1 |
| PB64 | 24.8 | 15.7 | 22.9 | 20.5 | 30.6 | 20.3 | |
| SE6G | 12.7 | 5.3 | 13.2 | 10.5 | 10.5 | 10 | |
| SS16 | 20.4 | 5.9 | 12.5 | 10.3 | 10.3 | 11 | |
| SP128 | 46.8 | 8.9 | 19.5 | 16 | 26.7 | 14.3 | |
| Pelvis | SE6C | 50 | 17.4 | 45.5 | 36.1 | 20.1 | 15.2 |
| PB64 | 24.8 | 15.7 | 22.9 | 20.5 | 30.6 | 20.3 | |
| SE6G | 48.8 | 15.9 | 32.5 | 27 | 18 | 11.9 | |
| SS16 | 35.1 | 9.9 | 20.8 | 17.1 | 38.1 | 14 | |
| SP128 | 63.1 | 9.2 | 15.6 | 13.5 | 11.3 | 13.2 |
Table 4: Measured and console CTDI values for head and body using routine protocols.
It was also observed that despite using the same model of CT scanner, SE6C produced higher CTDI values than those obtained at SE6G for all routine protocols. This was attributed to fact that SE6C used higher effective tube loads of 350 mAs and 120 mAs for head and abdomen/pelvis protocols respectively as compared to 267, 100,105 mAs used at SE6G for head, chest/abdomen, and pelvic protocols, respectively. However, for the chest protocol, higher CTDI value observed at SE6C could be attributed to the use of spiral mode with thicker slices (5.0 mm) and wider beam collimation (11.1 mm) as compared to sequential mode used in SE6G with the slice thickness of 1.0 mm and beam collimation of 1.0 mm. Large variations of CTDIw values were observed among the hospitals. The CTDIw values for head protocol were the highest at SP128 and the lowest at SS16. The highest head CTDIw values at SP128 could be attributed to the use of high tube potential (130 kV), long rotation time (2 s), and large slice thickness (10 mm). The lowest values obtained at SS16 could be explained by the use of relatively lower tube potential (120 kV), shorter rotation time (1.0 s), and smaller slice thickness (4.5 mm).
The data presented in Table 4 for measured and console CTDIvol values for every CT scanners were compared and summarized for routine protocols in Figures 4-8. Generally, these figures present large deviation from the measured and console CTDIvol. It is evident from Figures 4a, 5a, and 7a that there are large deviations between the measured and console CTDIvol. Non- origin linear relationship observed in Figures 4b, 5b and 7b indicates that that there is no correlation between the quantities and therefore the measured and console CTDIvol do not match.

Figure 4: Comparison and correlation between measured and console CTDIvol obtained using SE6C
for routine protocols. 

Figure 5: Comparison and correlation between measured and console CTDIvol obtained using PB64
for routine protocols.

Figure 6: Comparison and correlation between measured and console CTDIvol obtained using SE6G
for routine protocols.

Figure 7: Comparison and correlation between measured and console CTDIvol obtained using SS16
for routine protocols.

Figure 8: Comparison and correlation between measured and console CTDIvol obtained using SP128
for routine protocols.
Unlike in SE6G, PB64, and SS16, Figures 6 and 8 show marginal comparison and correlation between the measured and console CTDIvol, although it is still not clear what causes these deviations.
The CTDIw values can be used to assess the relative risks associated with radiation dose by using the dose reference levels presented in the third quartiles and mean values. The third dose quartiles for different protocols set by the European Commission’s Radiation Protection Action represent the bounds of potentially unacceptable practice [9]. The third dose quartiles for different protocols and hospitals in Tanzania and the European Commission have been compared in Figure 9.

Figure 9: Comparison of third dose quartiles for different protocols and hospitals in Tanzania and
the European Commission. 
In general, the CTDIw values obtained in this study were comparable or less than the corresponding values obtained from the European Commission. Thus, based on the dose reference levels, the risks associated with the radiation dose in CT examinations in Tanzania is tolerable. However, higher CTDIw value for the head protocol observed in SP128 could be attributed to the use of the large slice thickest of 10 mm as presented in Table 3.
In order to make similar comparison, the CTDIw values for each protocol, were averaged to obtain the mean and third quartile CTDIw values for this study. These values were compared in Table 5 with the corresponding values obtained from other studies. It is evident from this table that, the mean and third quartile CTDIw values obtained in this study were comparable to those obtained from other studies.
| Routine protocol | This study | [10] | [11] | [12] | [9] | |||||
|---|---|---|---|---|---|---|---|---|---|---|
| Mean | Third quart | Mean | Third quart | Mean | Third quart | Mean | Third quart | Mean | Third quart | |
| Head | 50.2 | 60.5 | 42.9 | 53.8 | 55 | 62 | 22.5 | - | 50 | 60 |
| Chest | 12.7 | 15.4 | 16.5 | 18.4 | 20 | 21 | 12.6 | - | 20.3 | 30 |
| Abdomen | 17.7 | 20.5 | 17.1 | 18.4 | 22 | 23 | 11.3 | - | 25.6 | 35 |
| Pelvis | 22.8 | 27 | 18.5 | 22.6 | 22 | 23 | 11.3 | - | 26.4 | 35 |
Table 5: Mean and third quartile CTDIw values (mGy) for different protocols obtained in this study compared with different studies.
In order to facilitate CT performance tests, the International Electro-technical Commission recommended that that all CT scanners should display, on their consoles, the radiation dose quantities in terms of CTDIw or CTDIvol after patient examination [7-12]. In view of this requirement, this study was interested to compare the calculated and the console CTDIvol values presented in Tables 3 and 4, respectively. Large deviations were observed between the calculated and console CTDIvol values. These deviations could be attributed to different techniques used to obtain the calculated and console CTDIvol values. This is because, during KLP measurements, the CT scanners displayed the fixed CTDIvol values on their consoles for every KLP measurements made, despite the changes in the ion chamber positioning in the insert holes of the standard CT phantoms. As presented in Table 2, the console CTDIvol value was fixed at 60.48 mGy in all ion chamber positions during KLP measurements in the head phantom. For these measurements, this study calculated the CTDIvol value using Equation (3) to obtain 50.7 mGy as presented in Table 4. The unclear definition of CTDIw and CTDIvol by the CT manufacturers, could explain why there is limited standardization between the console and the calculated CTDIvol. It was difficult for this study, therefore, to establish the correlation between the console and the calculated CTDIvol.
The assessment of CTDI in computed examinations in different CT scanners showed that, on average, multislice CT scanners delivered comparable radiation doses are within the European Commission’s diagnostic reference levels and therefore tolerable. Despite the lower levels of radiation dose, there is significant deviation between the calculated and console CTDI in all spiral multislice CT scanners studied. This explains why the CTDI technique for quality assurance and dose optimization is no longer appropriate for modern spiral multislice CT scanners with high rotation speeds and wide beams as discussed elsewhere. The CTDI approach for dose optimization and quality assurance should be continuously modified to fit with the CT technology developments.
[Crossref] [Google Scholar] [PubMed]
[Crossref] [Google Scholar] [PubMed]
[Crossref] [Google Scholar] [PubMed]
[Crossref] [Google Scholar] [PubMed]
[Crossref] [Google Scholar] [PubMed]
[Crossref] [Google Scholar] [PubMed]
Citation: Mhagama AN (2022) Is there Correlation between Measured and Console CTDIvol in Multislice CT Scanners? J Phys Chem Biophys. 12:337.
Received: 03-Jun-2022, Manuscript No. JPCB-22-17744; Editor assigned: 06-Jun-2022, Pre QC No. JPCB-22-17744 (PQ); Reviewed: 20-Jun-2022, QC No. JPCB-22-17744; Revised: 27-Jun-2022, Manuscript No. JPCB-22-17744 (R); Published: 04-Jul-2022 , DOI: 10.35248/2161-0398.22.12.337
Copyright: © 2022 Mhagama AN. This is an open-access article distributed under the terms of the Creative Commons Attribution License, which permits unrestricted use, distribution, and reproduction in any medium, provided the original author and source are credited.