Journal of Clinical Trials
Open Access
ISSN: 2167-0870
ISSN: 2167-0870
Research Article - (2016) Volume 6, Issue 5
Objectives: The analysis of Adverse Events (AE) is an important aspect of the assessment of new treatments. Data on AE are often reported through individual frequency rates, ignoring potential sources of heterogeneity due to either treatment course or individuals. We aimed to illustrate how Bayesian modelling may achieve reliable information using data of a randomized clinical trial evaluating chemotherapies against acute promyelocytic leukaemia (APL2006 trial). Methods: We first performed in 2015 a medical literature search to illustrate the need for improvement in AE reporting. We then used the APL2006 trial data to apply Bayesian hierarchical models on AE counts. Results: Only five over the 10 intended journals were found to have published results from RCTs in the study period. Median trial sample size was 523, ranging from 50 up to 20,870 with efficacy results mostly positive (in 61%). Although 39 (89%) articles briefly report AE information in the abstract, the analysis of AE data was poorly reported or even performed. In the APL2006 trial, 522 (97%) of the 538 patients received a total of 4,203 chemotherapy courses. A total of 3,584 AEs were recorded on 2,242 (53.3%) courses in 520 (99.6%) patients, that is, in all but 2 patients from arm A. Therefore, the rate of patients experiencing AE was poorly informative while the mean AE counts per patient were preferred. Besides the randomization arm, the various exposures– as summarized by the number of administered courses and the type of chemotherapy course, appeared as potential sources of variability. Bayes analysis of these AE counts, using Poisson-Gamma models with non-informative priors allowed to depict the heterogeneity in AE count across arms. Conclusion: We showed the interests of Bayes modeling to provide information on the adverse events distribution in a randomized clinical trial. Trial registration number and trial register: APL2006, NCT00378365.
Keywords: Bayesian approaches; Adverse events; Randomized phase III clinical trials
Although they cannot detect rare harms, Phase III randomized clinical trials (RCT) offer the best approach for providing safety data besides efficacy data [1,2]. Indeed, clinical safety data, usually reported as clinically manifested adverse events (AEs) according to the Medical Dictionary for Regulatory Activities (MedDRA), are routinely collected during the course of the trial, and periodical monitoring of the safety events is often required to determine whether excessive occurrence of a set of AEs is associated with treatment.
However, though the extension of the CONSORT statement has been developed to provide detailed recommendations on the reporting of harms in randomized trials [3] it has been claimed repeatedly for the last decade that reports of RCTs mostly provide inadequate information on AE [3-5] with prevalence of inadequacy ranging from one-half of RCTs up to nearly two thirds [6,7]. This was similarly examined in systematic reviews, though only 6% of reviews appeared to focus on such a topic, [8] with poor report on definition and collection of adverse events [9].
Overall, the reported proportion of all reviews with data on adverse events ranges from 18% to 28% [10,11]. Nevertheless, all these papers pointed out that more consistency among authors and journals as to how these adverse events are described and analyzed with regards to the treatment arm is required. Actually, the predominant method for statistical evaluation and interpretation of safety data collected in a clinical trial is the tabular display of descriptive statistics.
However, other statistical methods could be used, including graphical approaches [12] or Bayesian methods [13,14]. The interests of Bayesian approaches in the modeling of AEs have been claimed in the setting of pharmacovigilance, as an aid in regulatory decisionmaking for analyzing post-marketing data [15,16].
Bayesian methods indeed allow signal detection, [17] but they can also accommodate the structure of reported AEs with the MedDRA system throughout hierarchical models, [18] and incorporate prior established medical or epidemiological knowledge [15]. However, in pharmacovigilance, these analyses, based on spontaneously-reported adverse events, are faced to truncation data issues. Indeed, besides the potential selection biases induced by self-reporting, only patients who experienced adverse events report.
We assumed that there is a great opportunity to enhance evaluation of drug safety through the use of Bayesian tools, on the basis of Phase III randomized clinical trial data. First, Bayesian methods are intuitively appealing in displaying probability distributions of the effects across arms. Second, Bayesian approaches allow incorporating all available information, that is, in the trial and beyond the trial from prior or outside studies evaluating the same treatment. Thus, as previously reported, [19,20] pooling results from RCTs and nonrandomized studies on adverse event using Bayesian methods appears promising. Also, consistent criteria for determining whether the drug is harmful or not could be based on posterior or predictive probabilities, similarly to those defined for promising drugs for instance in the Phase II setting [21,22].
Thus, the objectives of this paper were to propose Bayesian statistical methods for harmonization, thus achieving the comparability of previously collected data, which could be used in the context of randomized clinical trial summary data or individual participant data meta-analysis of AEs.
We first reported a literature search to describe the reported statistics for comparing AEs across randomized arms. Then, we detailed the use of Bayes approaches for the handling of such data, both in graphical displays and conclusions regarding the association of AEs with randomized arms.
Count data and multiple right censored data were considered. To illustrate the interests of Bayesian methods for summarizing clinical trial data with regards to AEs, we used individual data from the APL2006 Phase IIII randomized clinical trial that aimed at assessing the role of Arsenic Trioxide and/or ATRA during consolidation course in 538 newly diagnosed Acute Promyelocytic Leukemia (APL). Some discussion is lastly provided.
Literature review
We first assessed the handling of tolerance data in the 10 highimpact general medicine and subspecialty journals in 2015: New England Journal of Medicine (NEJM), Lancet, Journal of the American Medical Association, The Lancet Oncology, The Lancet Infectious Diseases, The Lancet Neurology, Journal of Clinical Oncology (JCO), Annals of Internal Medicine, British Medical Journal, Archives of Internal Medicine (See Appendix A for a detailed search strategy). Specifically for adverse events, and according to previous reports,11 we recorded the population under study (intention-to-treat, per-protocol, other); the unit of observation (event, cure, patient); whether adverse event rates and treatment discontinuations were reported overall and in each arm separately; whether grades or severity scales were defined or referenced; the summary statistics and the statistical tests (overall, per arm); the handling of time scale; the correction for multiplicity; the use of Bayes approaches.
From January, 2007, 9 to January, 2014, 16, a total of 538 patients aged 70 years or less with WBC<10,000/mm3, were randomly allocated to three parallel arms, differing in consolidation courses based on idarubicine associated with either Aracytin (AraC, n=170, control arm A), Arsenic trioxide (arm B; n=176) or ATRA (arm C; n=176), as allocated by randomization (NCT00378365).
We first focused on the counts of adverse events (AE) observed in units of observation (either the course or the patient), using Poisson- Gamma models. Briefly, this consists in estimating the mean count μ of AE on the units where individual counts are summarized, through Poisson likelihoods while some extra-information from outside the trial is introduced on the prior mean μ, using Gamma distributions, where α is the shape and β the rate of the distribution. The posterior mean of the AE counts is then given by a Gamma density, where denote the total number of observed AEs and the sample size. Note that the prior sample size in this model is just β (which makes sense given that 1/β is the scale parameter for the Gamma distribution), and the prior acts like a dataset consisting of β observations with mean α/β Hierarchical models were fitted, where previous priors were generated in Gamma distributions and hyperparameters’ priors also Gamma distributed, using inference summaries from Markov chain Monte Carlo (MCMC) methods. Effect of randomization was assessed on the posterior distribution of the difference in Poisson AE counts across randomized arms, also reported as a Skellam distribution [23].
Different amounts of extra-information were considered. First, noninformative prior on each parameter, was used. Then, we assumed that some increased count of AE in the Arsenic trioxide arm has been suggested, so that informative priors were affected to that arm only.
MCMC inference process was based on 3 chains of 10,000 values after a burn in of 20,000 discarded iterations. We analyzed the posterior mean, standard deviation, 95% credibility interval, CrI), and convergence criterion statistics. To check the goodness-of-fit of the model before applying the results, used Bayesian P-values [24].
Analysis was performed on R 3.2.2 (https://www.R-project.org/). The Bayesian framework was based on the JAGS software (http:// mcmc-jags.sourceforge.net/) and the R2jags package.
Literature review
The study selection process is summarized in Figure 1, while main characteristics of the 44 reviewed papers are summarized in Table 1. Only five over the 10 intended journals were found to have published results from RCTs in the study period, with three main journals summing up 86% of the articles, namely NEJM (36%), JCO and Lancet (25% each). Median sample size was 523, ranging from 50 up to 20,870 and efficacy results were mostly positive (in 61%).
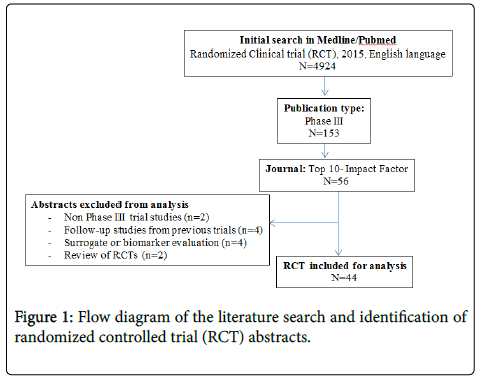
Figure 1: Flow diagram of the literature search and identification of randomized controlled trial (RCT) abstracts.
| Characteristics | n (%) |
|---|---|
| Journal | |
| New England Journal of Medicine | 16 (36%) |
| Lancet | 11 (25%) |
| The Lancet Oncology | 3 (7%) |
| The Lancet Infectious Diseases | 3 (7%) |
| Journal of Clinical Oncology | 11 (25%) |
| No authors: median [Interquartile range] | 20 [12.75; 23] |
| Sample size: median [Interquartile range] | 523 [349; 1051] |
| Reported information on AE in the abstract | 39 (89%) |
| Analyzed population for AEs | |
| All patients analyzed for efficacy (ITT) | 5 (11%) |
| Only patients who received treatment (PP) | 9 (21%) |
| Both ITT and PP | 4 (9%) |
| Unclear/not reported | 26 (59%) |
| Unit of observation | |
| Events | 2 (5%) |
| Patients | 33 (75%) |
| Both | 1 (2%) |
| Unclear/not reported | 8 (18%) |
| Summary Statistics | |
| Overall only | 6 (14%) |
| Per arm only | 27 (61%) |
| Both | 1 (2%) |
| Unclear/not reported | 8 (18%) |
| Test Statistics | 9 (20%) |
Table 1: Summary of Articles review regarding adverse events (AE) reporting.
By contrast, although 39 (89%) articles briefly report AE information in the abstract, the analysis of AE data was poorly reported or even performed. The most frequently reported statistics regarding AE occurrence were the observed rates of patients experiencing AE in each arm (reported in 27 articles, 61%), followed by treatment discontinuation due to SAE (in 7 articles).
None statistical analysis of AE data handled varying exposures in time, treatment courses or cycles, that is, either induction, consolidation, or maintenance cycles.
APL2006 trial: adverse events summary
Overall, 16 patients were untreated and 522 (97%) of the 538 patients received a total of 4,203 chemotherapy courses.
A total of 3,584 AEs were recorded on 2,242 (53.3%) courses in 520 (99.6%) patients, that is, in all but 2 patients from arm A.
Therefore, the rate of patients experiencing AE is poorly informative here while the mean AE counts per patient, of about 7 (7.3 in arm A, 7.4 in arm B and 5.9 in arm C), may appear to be preferred.
However, these figures also ignore the inter-individual variability in the occurrence of AE, as depicted in the Figure 2.
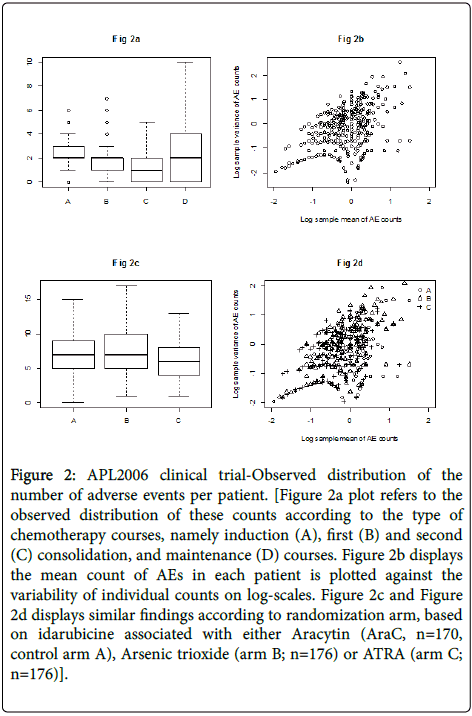
Figure 2: APL2006 clinical trial-Observed distribution of the number of adverse events per patient. [Figure 2a plot refers to the observed distribution of these counts according to the type of chemotherapy courses, namely induction (A), first (B) and second (C) consolidation, and maintenance (D) courses. Figure 2b displays the mean count of AEs in each patient is plotted against the variability of individual counts on log-scales. Figure 2c and Figure 2d displays similar findings according to randomization arm, based on idarubicine associated with either Aracytin (AraC, n=170, control arm A), Arsenic trioxide (arm B; n=176) or ATRA (arm C; n=176)].
Besides the randomization arm, the various exposures as summarized by the number of administered courses and the type of chemotherapy course appear potential sources of variability (Table 2).
| A | B | C | Total | |
|---|---|---|---|---|
| No patients | 170 | 176 | 176 | 522 |
| No courses | 1,328 | 1,446 | 1,429 | 4,203 |
| Induction | 170 | 176 | 176 | 522 |
| First consolidation | 162 | 170 | 169 | 501 |
| Second consolidation | 142 | 158 | 163 | 463 |
| Maintenance | 854 | |||
| No (%) patients with Adverse Events | ||||
| 168 (98.8%) | 176 (100%) | 176 (100%) | 520 (99.6%) | |
| No (mean) Adverse Events | 1,241 (0.93) | 1,296 (0.89) | 1,047 (0.73) | 3,584 (0.85) |
| Induction | 392 (2.3) | 414 (2.3) | 409 (2.3) | 1,215 (2.3) |
| First consolidation | 298 (1.8) | 339 (2.0) | 164 (1.0) | 801 (1.6) |
| Second consolidation | 220 (1.5) | 189 (1.2) | 110 (0.7) | 519 (1.1) |
| (Maintenance) | 331 (0.4) | 354 (0.4) | 364 (0.4) | 1,049 (0.4) |
| Mean ± SD Adverse Events per patient | ||||
| 7.30 ± 3.13 | 7.36 ± 3.60 | 5.94 ± 2.91 | 6.87 ± 3.29 | |
| Mean ± SD Adverse Events per course | ||||
| 1.18 ± 0.89 | 0.96 ± 1.05 | 0.91 ± 0.86 | 1.06 ± 0.94 | |
Table 2: APL2006-Observed distribution of adverse events after administered courses based on idarubicine associated with either Aracytin (AraC, n=170, control arm A), Arsenic trioxide (arm B; n=176) or ATRA (arm C; n=176), as allocated by randomization (NCT00378365).
Bayesian poisson-gamma modeling
Relationship between log-sample variance and log-sample mean over the patients was somewhat linear, with estimated slope of the least squares line at 0.7, suggesting that the Poisson-gamma distribution may be roughly appropriate here.
Thus, we then considered Bayes analysis of these AE counts, using Poisson-Gamma models with non-informative priors.
Rather than only summarizing AE information on mean count, this allows to depict the heterogeneity in AE count across arms in the shape of a distribution (Figure 3).
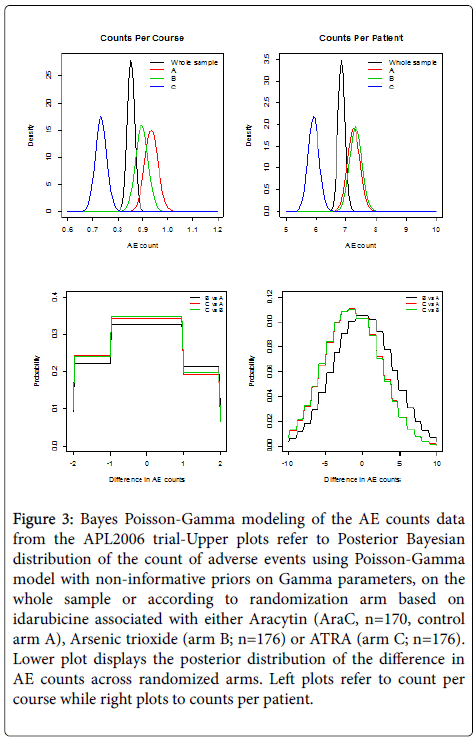
Figure 3: Bayes Poisson-Gamma modeling of the AE counts data from the APL2006 trial-Upper plots refer to Posterior Bayesian distribution of the count of adverse events using Poisson-Gamma model with non-informative priors on Gamma parameters, on the whole sample or according to randomization arm based on idarubicine associated with either Aracytin (AraC, n=170, control arm A), Arsenic trioxide (arm B; n=176) or ATRA (arm C; n=176). Lower plot displays the posterior distribution of the difference in AE counts across randomized arms. Left plots refer to count per course while right plots to counts per patient.
Moreover, differences according to randomized arms are highlighted with, whatever the observation unit related to either the chemotherapy course or the patient, a distribution shifted to the left in arm C while that of arm A are shifted to the right.
Nevertheless, accounting for courses instead of patient as the unit of observation modified the mean count in arm B that was closer to the control arm A (Table 3).
| AE Count per course | B against A | C against A | C against B |
|---|---|---|---|
| Mean | -0.038 | -0.202 | -0.163 |
| (95%CrI) | (-0.11; 0.034) | (-0.271;-0.134) | (-0.229;-0.098) |
| AE Count per patient | B against A | C against A | C against B |
| Mean | 0.064 | -1.352 | -1.416 |
| (95%CrI) | (-0.508; 0.636) | (-1.895;-0.810) | (-1.953;-0.876) |
Table 3: APL2006-Bayesian posterior estimates of mean count difference in AE occurrence based on idarubicine associated with either Aracytin (AraC, n=170, control arm A), Arsenic trioxide (arm B; n=176) or ATRA (arm C; n=176), as allocated by randomization (NCT00378365).
This was in agreement with the posterior distributions of differences in AE counts across arms (Figure 3).
In this paper, we showed the interests of Bayes modeling to provide information on the adverse events distribution in a randomized clinical trial. Such Bayesian modeling has been mostly used for detecting signals in clinical trials [30] or large databases of routinely collected data [15]. This should be used more widely to provide information on AE occurrence across randomized arms in RCTs. As reported in the literature review from 10 journals, there is a room for improvement in such a setting.
We first assumed that the AE counts were Poisson distributed, which is typically used for count data. In a Bayes framework, Poisson- Gamma distributions can be interpreted as a Poisson random variable denoting the number of courses with adverse events whose parameter is random and gamma distributed. Indeed, the gamma conjugate prior distribution is used to facilitate analytic calculations. However, there are two main consequences if the Poisson assumption does not hold: The first is that standard errors of the parameter estimates, which are based on the Poisson, are wrong. This could lead to wrong conclusions when doing inference. The other consequence happens when the Poisson distribution is used to make predictions, with probabilities assigned to each number of AE to be predicted will be inaccurate However, when it comes to modeling and predicting AEs using the Poisson, a good thing would be if the data were actually underdispersed. That would mean that the probabilities for the predicted number of AE would be higher around the expectation, and it would be possible to make more precise predictions. Alternatives to the Poisson model that are suitable to model count data and that are capable of being underdispersed could have been considered. Except for the negative binomial model there seems to have been little focus on more flexible Poisson-like models in the literature. The mostly used alternative to the Poisson model is the negative binomial distribution, but it cannot be used to model underdispersion. Two distributions that can handle both under- and over-dispersion are particularly noteworthy. One is the Conway–Maxwell–Poisson (COM-Poisson or CMP) distribution [25-27] that provides additional insight into the relative effects of different covariates, not only on the mean of the counts but also on the variance of the counts, and the other is the double Poisson (DP) distribution [28] that has been shown easily estimated to model count data [29]. They could appear promising alternatives for such modeling.
French Institute of Cancer, Inca, SHSESP - Recherche en Sciences Humaines et Sociales, Epidémiologie et Santé Publique 2014 (#SHSESP14-064) ; Agence Nationale de Sécurité des médicaments (ANSM) 2015.