Journal of Agricultural Science and Food Research
Open Access
ISSN: 2593-9173
ISSN: 2593-9173
Research Article - (2023)Volume 14, Issue 2
The use of improved agricultural technologies has been reported as the major strategy to increase agricultural production, increased household incomes and addressing poverty. However, adoption of such improved technologies by smallholder coffee farmers has been slow and this has contributed to the low coffee productivity in the country and the poor performance of the coffee sub sector. The study was meant to examine the effect of institutional factors including extension services, access to market and access to credit on technology adoption among smallholder coffee farmers in Kanungu District, Uganda. The study collected both quantitative and qualitative data from 289 smallholder coffee farmers and 8 key informants respectively in major coffee growing sub counties in Kanungu district. The study revealed that access to extension services and access to market have a positive significant influence on agricultural technology adoption while access to market has no significant influence on agricultural technology adoption. The study concluded that there is a positive significant relationship between institutional factors and technology adoption among smallholder coffee farmers in Kanungu district.
Technology; Adoption; Agriculture; Coffee; Smallholder; Extension; Credit; Market; Access
Globally, smallholder farmers are at the heart of the agricultural sector in most developed and developing countries since they represent roughly 85 percent of the world’s farms [1]. Of the 1.4 billion extremely poor, 75 percent are smallholder farmers who live in rural areas practicing traditional agriculture [2-4]. Half of them do not use improved technologies like fertilizers, improved planting materials and tractors [5,6]. Coffee is one of the leading traded commodities on the global market in both volume and value [7]. The world coffee production is estimated at approximately 8.75 million tons which account for about 23.4 billion US dollar in export value [8]. The largest coffee producers in the world are Brazil, Vietnam, Colombia and Indonesia because of the improved soils and use of improved technology.
In the developing world, the coffee sub-sector is one of the areas where productivity has been much low to serve steady national and international demand [9]. Approximately 125 million people depend on coffee for their livelihoods and 70% of them are smallholder farmers who produce on a small scale and sell in the neighboring traders at lower prices, low quantity and quality [10-13]. The poor quality and quantity of coffee has affected marketing linkages and pricing of coffee at national and international levels hence resulting to low incomes among smallholder farmers [14]. If this trend continues, it will limit the potential of coffee to enhance poverty reduction and retard the capacity of developing countries to meet the sustainable development goals since more than 70% of Africans in developing countries depend on agriculture for their livelihoods [15,16].
Increased technology adoption which broadly include adoption of improved agricultural practices, crop varieties, inputs, and associated products such as crop insurance, has the potential to contribute to improved coffee yields, household incomes and poverty alleviation amongst the poor, particularly in sub-Saharan Africa because of its capacity to reduce spoilage and risk, and improve the nutritional quality of the coffee plantation [17].
Many proven technologies and improved farming practices hold great promise for boosting agricultural production and reducing poverty in developing countries, but the adoption of such technologies by smallholder farmers, particularly in sub-Saharan Africa, has been slow and has lagged far behind that of other continents such as Asia and Europe [18,19]. The low technology adoption rates have resulted in persistent low agricultural productivity in sub-Saharan Africa [20]. Important identified culprits in low adoption include lack of knowledge, lack of access to markets, credit constraints, uninsured risks, and problems of coordination with neighbours.
Accounting for 75% of the labor force, 43% of GDP and 60% of exports in East African states, the agricultural sector is arguably the most important engine for achieving economic growth, development, job creation, and poverty reduction in East Africa. Nearly 70% of the East African population, and about 90% of the region’s poor, rely heavily on agricultural production. Unfortunately, agricultural sector growth has remained insufficient to address poverty, achieve food security, and lead to sustained economic growth. Technology adoption has been touted as the key to improving productivity and addressing poverty and food insecurity. However, as in the rest of sub-Saharan Africa, East Africa has low adoption rates of agricultural technology and smallholder farmers remain poor and largely concentrated in rural areas. While low adoption rates might seem irrational when looking at promised yields, they may well be a result of the various constraints farmers face such as lack of credit, lack of access to extension services and low market for inputs and outputs.
In Uganda, smallholder farmers still dominate coffee production, with average coffee farm sizes estimated at 0.33 ha per household with an estimated average yield of 369 kg/ha, compared to the experimental yield of 3,500 kg/ha. Uganda is the largest producer of Robusta coffee in Africa and coffee is the country’s most important cash crop that generates more export income than all other agricultural export commodities combined. However, over the last 20 years, coffee production in Uganda has stagnated at an average of 3 million 60 Kgs. bags per annum. The country’s ability to fully utilize its agricultural production potential depends on the innovativeness of actors in the agricultural sector, particularly adoption of improved agricultural technologies such as fertilizer use, improved seedlings, irrigation, pest and disease control and pruning.
The government and development agencies have focused on the dissemination of improved agricultural technologies including improved crop varieties, land management, and agronomic practices to enhance productivity [20]. Development agencies and government programs often provide farmers with technical knowledge and skills regarding the application of these technologies. Unfortunately, the Ugandan agricultural sector is characterized by low level of technology adoption and this has contributed to the low agricultural productivity in the country and the poor performance of the coffee sub sector. If this trend continues, it will limit agriculture’s potential to enhance poverty reduction and retard the capacity of Uganda to meet the sustainable development goals since more than 70% of Ugandans depend on agriculture for their livelihoods.
Therefore, an assessment of the factors that influence farmers’ decisions to adopt or not to adopt modern agricultural production technologies is critical for unravelling the reasons for low technology adoption among smallholder farmers in Uganda and improving the productivity of the coffee subsector.
As an institution, the coffee sub-sector is faced with various institutional factors which influence the behavior of farmers and the way they live. The term ‘institutional factors’ refers to the particular system under which land is owned and managed. The ownership and management have a direct bearing on agricultural productivity and efficiency. The major institutional factors facing agriculture sector and coffee sub sector in particular include farmers’ access to credit, access to market for agricultural inputs and outputs and access to extension services through which information is passed on to farmers.
Studies have been done on the influence of institutional factors (extension services, access to markets and access to credit) and technology adoption and a wide range of literature have shown a link between these institutional factors and technology adoption. However, most studies have been limited on technologies in other crops such as maize and sweet potatoes, bananas, maize and cassava. Ideally, considering the fact that crops such as maize, sweet potatoes and cassava are usually annual crops covering less than 2 years, technologies used in such crops usually differ from those used in perennial cash crops such as coffee. Similarly, it is more likely that factors such extension services, market access and credit access may not affect adoption of technologies of food crops such as sweet potatoes, cassava and bananas as in cash crops such as coffee and tea. Hence it is necessary to understand the levels of access to extension services, credit and market and how these factors influences adoption of improved coffee technologies among smallholder coffee farmers. Little remains known on the extent to which institutional factors affect the quality of seedlings as well as adoption of improved coffee technologies in the Ugandan coffee subsector, hence the need for the study.
It is against the above background that the study sought to examine the extent to which institutional factors such extension services, access to market and access to credit influence farmers’ decisions to adopt modern agricultural technologies among small holder coffee farmers in Kanungu District.
Study area
The study was conducted from Kanungu district in Kigezi sub region of Western Uganda. The district is bordered by Rukungiri district to the north and East, Kabale district to the South-East, Kisoro district to the South-West, and the democratic republic of the Congo to the West. The district headquarters are approximately 60 kilometers (37 mi), by road, north-west of Kabale, and the largest town in the subregion. This location is approximately 420 kilometers (260 mi), by road, south-west of Kampala, Uganda's capital with coordinates of the district is: 00°57'S, 29°47'E. The district comprises two counties; Kinkiizi East and Kinkiizi West with the twelve sub-counties of Kihihi, Kambuga, Nyamirama, Rugyeyo, Rutenga, Kayonza, Mpungu, Kinaaba, Katetete, Nyakinoni, Nyanga, and Kanyantorogo, and the four town councils of Kanungu, Kihihi, Butogota, and Kambuga.
Agriculture is the mainstay of the district's economy, as is the case with the majority of other Ugandan districts. The fertile soils and good climate allow for adequate coffee production. However, because of the remoteness of the district and the mountainous terrain, bringing the produce to market remains a challenge and a constraint to increased production. The CHIFCOD coffee factory supports 1,000 farmers, training them to create high value produce then processing and exporting it.
Research design
This study used cross sectional design which enabled the investigator to collect both quantitative and qualitative data at a point in time. This design involved analysis of data collected from a population or representative sub set at a point time that is cross sectional data and it is usually relational because they are designed to scientifically investigate associations between two or more research constructs. Cross section design facilitated collection of data on agricultural extension services in relation to agricultural technologies among small holder coffee farmers in Kanungu district. Quantitative and qualitative approaches were used in data collection and data processing to enable the research to have both numerical and narrative data for holistic understanding of study variables.
Study population
The study population consisted of smallholder coffee farmers in four major coffee growing sub counties in Kanungu district. The district has approximately 10,989 farmers in coffee production and marketing considering the household heads as owners of the coffee fields. Whereas the study targeted all smallholder coffee farmers, only 1,162 Robusta coffee farmers from major four coffee growing sub counties in Kanungu district was considered. In addition, the study also included 08 key informants in the coffee subsector which included the sub county extension staff in each of the four sub counties as well as the district agricultural officer, district commercial officer, district production and marketing officer and regional coffee extension officer.
Sampling procedure
The Table 1 below presents the sample size and how it was selected from different categories of the study population.
| Study population | Category of respondents | Population size | Sample size |
|---|---|---|---|
| Smallholder farmers | Rugyeyo coffee farmers | 403 | 100 |
| Kayonza coffee farmers | 231 | 58 | |
| Kanyatorogo coffee farmers | 242 | 61 | |
| Nyakinoni coffee farmers | 278 | 70 | |
| Sub total | 1,154 | 289 | |
| Key informants | Sub county extension officers | 4 | 4 |
| District agricultural officer | 1 | 1 | |
| District commercial officer | 1 | 1 | |
| District production and marketing officer | 1 | 1 | |
| Regional coffee extension officer | 1 | 1 | |
| Sub total | 8 | 8 | |
| Grand total | 1,162 | 297 |
Table 1: Sampling frame.
The sample size included 289 coffee farmers who were sampled from four major coffee growing sub counties in Kanungu district. Eight (08) key informants including 04 sub county extension officers, 01 district commercial officer, 01 district agricultural officer, 01 district production and marketing officer and 01 regional coffee extension officer were considered. The sample size was determined scientifically using the Krejcie and Morgan's table of random numbers.
Stratified sampling was used to categorize coffee farmers according to the major coffee growing sub counties in Kanungu district that is Kayoza, Nyakinoni, Rugyeyo and Kanyatorogo. The respondents from each sub county were selected using random sampling technique to allow all prospective respondents to have equal chances of being considered in the study. Lottery random sampling method was employed where papers with names of prospective respondents were put in a box and the required number of respondents selected without being replaced back.
Data collection methods
The researcher used a questionnaire method of data collection specifically on small holder coffee farmers in Kanungu district since this makes it easy to answer within a short time. A questionnaire is a method of data collection where open-ended and close ended questions are drafted on paper with spaces to be filled by the respondents without the aid of the researcher. Respondents read, interpreted and made a well informed decision of the appropriate answer to fill on the paper. This method was also used because questionnaires were easy to be filled and given to the respondent adequate time to make an informed decision compared to interviews which are immediate.
Key informant interviews was also used to collect data key informant interviews about the influence of institutional factors in influencing technology adoption among smallholder farmers. The key informants included the sub county extension officers, district agricultural officer, district commercial officer, district production and marketing officer and regional coffee extension officer. The major aim of using key inform-ant interviews is to seek open-ended thoughts and feelings from participants. Interviews were preferred because they are useful in obtaining detailed information about personal and group feelings, perceptions and opinions, they also provide a broader range of information, provide opportunity to seek clarification and useful narrative statements. The interviews were held from an organized place that favors each participant to explain and express his/her feelings freely and each interview took 30 minutes-60 minutes.
Data collection instruments
The study used structured questionnaires to collect data from the coffee farmers. The questionnaire was made up of both open ended and close ended questions. This is to reduce on time requirement for respondents to give responses. This helped the researcher to collect data from subjects with busy schedules. The questionnaire tool was used because it is good in a sense that it generates reliable data from respondents even in the absence of the researcher and it helped the researcher to cover many respondents in a relatively short time.
The study also used an interview guide to collect first-hand information for the sought key informants. The interview guide was made of opened ended questions to allow the researcher probe respondents. The interview guide was employed in the study because it generates first-hand information. This data was collected both physically by conducting some focused group meetings and via the telephone for respondents who are very busy and in distant places.
Data analysis
Quantitative data analysis: Quantitative data was compiled using SPSS V20.0 computer package and was presented in frequency tables, pie charts and others suitable means for easy interpretation. The study first calculated the adoption behavior of coffee farmers using an adoption quotient formula given by Sengupta. Adoption quotient for an individual farmer was computed from the adoption scores gained by the farmer for the adoption of improved recommended practices.
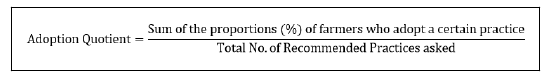
On the basis of adoption quotient, the farmers are classified into 4 categories as per Sengupta. High adopters (66.67 to 100), medium adopters (33.34 to 66.66), low adopters (1 to 33.33) and non-adopters (0).
The study then ran a multiple linear regression to establish the level of access to extension services, market and credit and how these variables influences technology adoption. In this case, responses on levels of access to extension, markets and Credit was the independent/predictor variables (Xi) of the regression model while responses on the 10 statements about adoption of technology was the dependent variable/outcome variable (Y) of the regression model. Descriptive statistics like frequency distribution, percentage and mean were also used to analyze the data.
Qualitative data analysis
The study used thematic content analysis during data analysis where the researcher read all the explanations of respondents in their languages, transcribe them and then extract meaningful statements that was used to support the quantitative data.
Demographic characteristics of the respondents
This section presents the background information of the respondents including gender, age range, and marital status, number of children and level of education. This information is relevant to the study because it influences the level of technology adoption among smallholder small holder farmers. The findings on this are detailed on Table 2 in the following page.
| Bio-data of the respondents | Frequency | Percentage | |
|---|---|---|---|
| Gender | Male | 174 | 69.6 |
| Female | 76 | 30.4 | |
| Total | 250 | 100 | |
| Age range (Av.ag.=47 years) | Below 18 years | 3 | 1.2 |
| 18 years-34 years | 71 | 28.4 | |
| 35 years-54 years | 126 | 50.4 | |
| 55 years+years | 50 | 20 | |
| Total | 250 | 100 | |
| Marital status | Single | 31 | 12.4 |
| Married | 204 | 81.6 | |
| Widowed | 10 | 4 | |
| Separated/Divorced | 5 | 2 | |
| Total | 250 | 100 | |
| No. of children (Av.=6) | None | 36 | 14.4 |
| 1 children-3 children | 76 | 30.4 | |
| 4 children-6 children | 110 | 44 | |
| 7 children and above | 28 | 11.2 | |
| Total | 250 | 100 | |
| Level of education | No formal education | 10 | 4 |
| Primary | 79 | 31.6 | |
| Secondary | 99 | 39.6 | |
| Post-secondary | 62 | 24.8 | |
| Total | 250 | 100 |
Table 2: Background information of the respondents.
Gender: According to the findings in Table 3, the results on the gender of the respondents revealed that 174 (69.6%) of the respondents were males while 76 (30.4%) were females. This implies that men do more of coffee growing compared to the females as seen from the response rate regarding gender. This is could be because of men’s rights to land ownership and accessibility when compared to their counterparts. It can also be explained by lot of responsibility which men have compared to women in terms family management, meeting the financial needs of the family among others. In addition, most females who had coffee plantation projects were obtained from their deceased husbands.
Age range: While assessing the respondents’ age, majority 126 (50.4%) of the study respondents were between 35 years-54 years, 71 (28.4%) of the respondents were between 18 years-34 years, 50 (20.0%) of the respondents were 55 years and above while the least 3 (1.2%) of the respondents were below 18 years. This indicates that majority of the coffee farmers in Kanungu district are adults who are still in productive age blanket. This could be attributed to a lot of responsibilities which these people have which motivate them to work hard. Furthermore, they are believed to have a lot of energy compared to those above the age of 55 years.
Marital status: While assessing the respondents’ marital status, majority 204 (81.6%) of the study respondents were married, 31 (12.4%) of the respondents were single, 10 (4.0%) of the respondents were widowed while 5 (2.0%) of the respondents were separated/divorced. This indicates that majority of the coffee farmers in Kanungu district were married which implies that marriage accrues along with responsibilities which also trigger them to improve on the family projects such as coffee plantations. The single follow the married ones in coffee farming and this could because they sustainably planning for their future income to handle responsibilities.
Number of children: Furthermore, while assessing number of children of the respondents, majority 110 (44.0%) of the study respondents had 4 children-6 children, 76 (30.4%) of the respondents had 1 children-3 children, 36 (14.4%) of the respondents had none while the least 28 (11.2%) of the respondents had 7 children and above. This on average indicates that majority of the coffee farmers in Kanungu district have many children, this portrays high dependence among coffee households and therefore limited financial resources devoted for coffee production and marketing activities.
Level of education: While concluding the bio data of the respondents, the study in regard to the level of education, the study findings revealed that, majority 99 (39.6%) of the study respondents had at least attended secondary level, 79 (31.6%) of the respondents had attended primary level, 62 (24.8%) of the respondents had attended at least post-secondary level while the least 10 (4.0%) of the respondents had no formal education. This indicates that majority of the coffee farmers in Kanungu district have reasonable literacy levels to sup-port them in acquiring required knowledge for production and marketing activities.
Farm information
The study also examined the coffee farm information including land area under coffee cultivation, period spent in coffee farming, main customers for coffee and earnings per annual from coffee. The results on this are shown in the Table 3 below.
| Farm information | Frequency (N=250) | Percentage (%) | |
|---|---|---|---|
| Acres of coffee | Below 2 acres | 92 | 36.8 |
| 3 acres-5 acres | 115 | 46 | |
| 6 acres-8 acres | 38 | 15.2 | |
| Above 9 acres | 5 | 2 | |
| Period spent in coffee farming | 2 years and below | 40 | 16 |
| 3 acres-5 years | 79 | 31.6 | |
| 5 acres-10 years | 69 | 27.6 | |
| 10 years and above | 62 | 24.8 | |
| Main customers for coffee | Cooperative society | 6 | 2.4 |
| Individual coffee traders | 158 | 63.2 | |
| Coffee Factories | 80 | 32 | |
| Others | 6 | 2.4 | |
| Earnings per annum | Below 1 million | 111 | 44.4 |
| 1 million-2 million | 94 | 37.6 | |
| 3 million-4 million | 29 | 11.6 | |
| 5 million and above | 16 | 6.4 |
Table 3: Farm information.
Acres of coffee: The study results concerning this section shows that 92 (36.8%) were coffee farmers with less than 2 acres of land, 115 (46.0%) were farmers with 3 acres-5 acres of land, 31 (15.2%) were coffee farmers with 6 acres-8 acres of coffee and 5 (2.0%) were farmers with 9 acres and above of coffee. This implies that the majority of the coffee farmers in Kanungu district have coffee plantations occupying 3 acres-5 acres of land as shown by 115 (46.0%). This is a reasonable acreage when you compare it with average land size per household of 0.5 acres in the district. This is mainly because coffee is one of the major sources of income for households in Kanungu district hence devoting much of their land to this economic activity.
Period spent in coffee farming: Results concerning period spent in coffee growing showed that the majority of the respondents had spent 3 years-5 years as shown by 79 (31.6%), followed by those that had spent 6 acres-8 acres as shown by 69 (27.6%), then spent 10 years and above as shown by 62 (24.8%) and the least being those who had spent less than 2 years as shown by 40 (16.0%). The findings revealed by the study indicates that respondents had for quite long grown coffee in Kanungu district. The long period spent in coffee growing can be due to several factors such as increased profits generated, fertile soils, availability of coffee specific advisory services and among other factors.
Main customers for coffee: The study also asked respondents about who their main customers for coffee are, in which majority respondents 158 (63.2%) said their coffee is bought by individual traders, followed by 80 (32.0%) who sell coffee to coffee factories and the least being 6 (2.4%) respondents that sell coffee to cooperatives and other groups. Most coffee growers in Kanungu district were found to largely be selling their coffee to individual coffee traders who traverse the area looking for coffee. More so, few of the coffee growers have been able to form cooperatives through which they are able to their sell. This therefore mean that majority of the coffee farmers have not enjoyed the benefits of collection actions that accrue from collective marketing including but not limited to the following; High bargaining power, access to extension services, market accessibility and among others.
Earnings per annum: It was found out that majority of the respondents earn 1 million and below as shown by 111 (44.4%), followed by respondents that earn 1 million-2 million shillings as shown by 94 (37.6%), then respondents that earn 3 million-5 million shillings as shown by 29 (11.6%) and the least being respondents that earn more than 6 million shillings as shown by 16 (6.4%). Most coffee growers in Kanungu district are still reaping low from coffee yields. This could be attributed to low coffee prices and lack of value addition. The low returns from coffee could also due to lack of collective bargaining power as most coffee growers independently sold their coffee to individual coffee buyers hence being exploited.
Institutional factors and adoption of agricultural technologies in coffee farming
In this study, ‘institutional factors’ refers to the particular elements of the system under which land under coffee cultivation is owned and managed. The ownership and management have a direct bearing on agricultural productivity and adoption of coffee technologies. The major institutional factors facing coffee sub sector in particular include farmers’ access to credit, access to market for agricultural inputs and outputs and access to extension services through which information is passed on to farmers. In this study, each of the above factors is assessed as follows;
Access to extension services: The researcher started by analyzing the level of access to extension services among smallholder coffee farmers in Kanungu district and results are shown in the Figure 1 below.

Figure 1: Access to extension services among smallholder coffee farmers.
As shown by the results from Figure 1 above, the descriptive statistics indicate that more than 50% of the smallholder coffee farmers in Kanungu had received extension services regarding coffee technologies through farmer group discussions (72%), extension visits (70%), practical training (56%), and agricultural exhibitions (44%) and written training manuals on coffee (22%). More than 90% of the farmers reported that they have received extension services for free. However, much as 54% of the farmers reported extension services to have been effective in boosting coffee production, only 30% of the small holder farmers reported that they possess enough knowledge on coffee farming including adoption of coffee technologies. Besides 65% of the farmers reported that a farmer cannot do coffee farming effectively without the aid and advice from extension service providers. This implies that extension services have a significant influence on adoption of coffee technologies.
Market access among smallholder coffee farmers: The researcher analyzed the level of market accessibility among smallholder coffee farmers in Kanungu district and results are shown in the Figure 2 below.

Figure 2: Market access among smallholder coffee farmers.
As shown by the results from Figure 2 above, the descriptive statistics indicate that most (64%) of the smallholder coffee farmers in Kanungu district sell their coffee in the local market mainly to local buyers. Only 24% sold coffee to cooperatives dealing in coffee since they have sought membership in those cooperative. On the other hand, only 12% sold their coffee, to coffee factories in their locality. Most (64%) of the farmers reported to have sold their coffee in dry form (Kiboko) in order to optimize a high price that accrue with value addition.
As regards to market accessibility, the results on Figure 3. Show that most farmers (56%) travelled short distance of about less than 2 km to access the nearby market while only 15% travelled 3 km-4 km. At least 70% of the smallholder coffee farmers said that information on prices and agro inputs is readily available which implies that they can easily make decisions of when and where to sell coffee or buy inputs depending on the prevailing prices. Radio was reported as the major source of information on prices of coffee and prices of agro inputs as reported by 64% and 75% respectively.
Level of credit access among smallholder coffee farmers: The researcher also analyzed the level of credit access among smallholder coffee farmers in Kanungu and results are shown in the Figure 3 below.

Figure 3: Access to credit among smallholder coffee farmers.
As shown by the results from Figure 4 above, the descriptive statistics indicate that most (62%) of the smallholder coffee farmers in Kanungu district have a bank account where they save and borrow money. However, only 28% of the farmers reported that they have acquired a loan within the last 12 months while 20% applied for the loan but was denied/ restricted an opportunity of a loan. This is attributed to high loan processing fees and stringent credit terms such as collateral security, interest rate and guarantors. The findings indicate that only 43% of the farmers reported that the loan processing fees are affordable while majority 57% could not afford the loan processing fees. Over 70% of the farmers reported that they were asked to present guarantors to get the loan, have been asked to pay collateral security in form of land and buildings and agreed to pay an interest rate ranging from 3%-5% per month on the loan principle. In fact, 60% of the factors reported that the credit terms charged by financial institutions on loans are stringent with only 40% reporting that the credit terms are lenient. Besides, only 40% of the respondents reported that they had adequate knowledge on use of credit in coffee while 60% had little knowledge on credit usage. The above issues are expected to have a significant influence on technology adoption.
Level of technology adoption among smallholder coffee farmers
In this study, the level of technology adoption has been determined by computing the average percentage response on the Eight (8) statements on technology adoption including type of coffee grown, fertilizer application, cutting/stamping old coffee trees, pruning/de-suckering, use of recommended holes, pesticide usage, cutting or burning of infected coffee trees and dying of coffee. The percentages in the figure below are those that answered ‘yes’ on each of the above technologies. The results are shown in Figure 4 below.

Figure 4: Level of technology adoption among smallholder coffee farmers.
According to the results in the Figure 4 above, it is revealed that the 86% of the farmers plant Elite Robusta/Arabica coffee while the rest 14% plant other types of coffee including commercial clones CWDr, and Corona coffee. As regards to fertilizer usage, the findings show that 68% of the smallholder farmers in Kanungu district use fertilizers in coffee plantation. Of these, 49% use organic fertilizers only, 13% use commercial fertilizers only while only 6% use both organic and commercial fertilizers. On average, the findings indicate that the average level of technology adoption among smallholder coffee farmers is 76%. Hence, smallholder coffee farmers in Kanungu district are considered as high technology adopters (66.67 to 100) using a formula generated by Sengupta.
During interviews with the District Production Officer (DPO) Kanungu district, it confirmed existence of different coffee technologies among smallholder coffee farmers in Kanungu, including making appropriate holes for planting coffee, spacing, fertilizer application, mulching, stumping and other good agronomic practices. In D.P.Os’ opinion, he estimated the level of adoption of agricultural technologies at 65% and above. He explained as follows;
“Around 65% of the farmers have adopted improved technologies when it comes to the planting of coffee. Most of them are well informed about the proper and recommended planting methods and have adopted them. The technologies that lie in the 65% of the farmers are pumps for spraying, using pesticides to spray.”
He added that, “around 75% of the farmers have also adopted improved agricultural technologies when it comes to drying and harvesting of coffee. The major post harvesting techniques include drying coffee using tarpaulins and raised wire mesh and, wet processing”.
However, the DPO also confirmed that very few famers have adopted stumping, use of commercial fertilizer where he noted as follows; “At least 30% of the farmers try to individually apply organic fertilizers such as cow dung but many of them are still reluctant on using inorganic fertilizers and adopting other good soil and water conservational management practices like mulching, agroforestry, simple irrigation and soil erosion control. According to the DPO, farmers assume that their soils are still productive or fertile enough support coffee and growing of other crops without being supplemented with essential nutrients and that this negatively affected both productivity and production in Kanungu district.
Institutional factors and technology adoption among smallholder coffee farmers
The general objective was to examine the extent to which institutional factors such as access to extension services, market access and credit access influence the level of technology adoption among smallholder coffee farmers in Kanungu district. A regression analysis was established to identify the influence of each of these institutional factors on technology adoption as shown in Table 4 below.
| Variable | Zero-order correlation (2-tailed) | β | t | p | |||
|---|---|---|---|---|---|---|---|
| ExtSvsAcss | MktAcss | CrdtAcss | TechAdopt | ||||
| ExtSvs | 0.006 | 0.116 | 0.149* | 0.11 | 1.814 | 0.041 | |
| MktAcss | -0.01 | 0.03 | 0.031 | 0.549 | 0.584 | ||
| CrdtAcss | 0.363** | 0.345 | 5.91 | 0 | |||
| Constant (Intercept) | - | - | - | - | 0.929 | 6.168 | 0 |
| Av. lev of Accessibility | 53% | 56% | 28% | - | R=0.380*, R2=0.144*, Adj.R2=0.134, F=13.842, Sig.=0.000 | ||
| Av. lev of adoption | - | - | - | 73% | |||
*p<0.05,**p<0.01
a. Predictors: (Constant), credit access, market access, extension services
b. Dependent variable: Agricultural technology adoption
Table 4: Influence of institutional factors on agricultural technology adoption.
As shown in the Table 3 above, R is the correlation between the predicted values each independent variable (Extension services, Market access, and credit access) and the observed values of Y (Agricultural technology adoption). R-square (R2) indicates the percentage of variation explained by the regression line out of the total variation. The beta coefficient is the degree of change in the outcome variable for every 1 unit of change in the predictor variable. T and P values test for the level of precision with which the regression coefficient is measured while p-value is the probability value that the null hypothesis is true. As shown in the table above, it is shown that there is a positive significant relationship (R=0.380*) between institutional factors and technology adoption among smallholder coffee farmers in Kanungu district. The R-square (R2=0.144) which indicates that 14.4% of the variations in technology adoption is attributed to variations in institutional factors such as access to extension services, access to market and access to credit. The F, t and P values show a statistically significant relationship between institutional factors and technology adoption (i.e. p<0.05, F>p, t>p). The influence of each of these factors is discussed in the following subsections:
Extension services and technology adoption among smallholder coffee farmers: The first specific objective was to examine the influence of access to extension services on technology adoption among smallholder coffee farmers in Kanungu district. The correlation and regression results in Table 3 above revealed that there is a positive significant relationship (r=0.149*) between access to extension services and agricultural technology adoption. Since the p-value (Sig.=0.041) is less than the critical significance value (0.05) and F-statistic and T-statistic greater than the critical value (0.05), which indicates that the correlation is statistically significant. Therefore, it is confirmed from the results that access to extension services have a statistically significant influence on agricultural technology adoption among smallholder coffee farmers in Kanungu district. The B-value (β=0.110) indicates that a 1 unit increase in access to extension services results to 0.110 increase in technology adoption.
During interviews, the D.P.O of Kanungu district asserted that extension services have a significant influence on coffee farmers’ ability to adopt technologies. The delivery of extension services according to D.P.O is mainly done through radio talk shows, individual farmer visits, training seminars and workshops and demonstration gardens which have been established in every parish. According to the D.P.O, the above initiatives have had a positive effect on the level at which farmers have adopted better coffee agronomic practices. He explained this as follows:
Extension workers sometimes do deliberate operations to enforce the adoption of technology amongst smallholder coffee farmers. So, conclusively, extension services have had a large impact on adoption of agricultural technologies amongst the farmers. Extension services put together with the policies that have been put in place have made the adoption of coffee technologies much more increased although the ratio of extension worker to farmer is every low.
According to the D.P.O, there are very few extension workers compared to the number of farmers which limits the number of extensions visits in a year and the amount/content taught to farmers during extension visits. Hence, most extension services have been provided via the mass media especially through radios to reach many farmers. Generally, extension workers usually visited farmers once in a year or even in two years.
Market access and technology adoption among smallholder coffee farmers: The second specific objective was to examine the influence of access to market on technology adoption among smallholder coffee farmers in Kanungu district. On this issue, the correlation and regression results in Table 3 above revealed that there is no significant relationship between access to market and agricultural technology adoption. Since the correlation (r=0.03) is very close to zero and p-value (Sig=0.584) is greater than the critical significance value (0.05), it also indicates that the beta coefficients (0.031) and t-statistic (0.549) are not statistically significant. Therefore, it is confirmed from the results that access to market has no statistically significant influence on technology adoption among smallholder coffee farmers in Kanungu district.
However, qualitative responses with the D.P.O revealed that market access influences technology adoption in two ways as follows; “First, when farmers know that there is market for their coffee, they are motivated to adopt better agricultural technologies to increase their yields and earn more money. On the other hand, farmers get demotivated to adopt agricultural technologies when they are not sure of the market for their coffee products. Some farmers argue that they used to earn more from coffee when the technologies they used were still rudimentary in nature”. Basing on these assertions therefore, there is no defined conclusion that market access has a positive or negative influence on technology adoption.
Credit access and technology adoption among smallholder coffee farmers: The third specific objective was to examine the influence of credit access on technology adoption among coffee farmers in Kanungu district.
The correlation and regression results in Table 3 above revealed that there is a positive significant relationship between access to credit and agricultural technology adoption. This is because of the moderate positive correlation (r=0.363*) and the p-value (Sig=0.000) that is less than the critical significance value (0.05). The Table 3 also indicates that the beta coefficients (0.345) and tstatistic (5.910) are statistically significant. Therefore, it is confirmed from the results that access to credit have a statistically significant influence on agricultural technology adoption among smallholder coffee farmers in Kanungu district.
During interviews with the D.P.O, it was reported that fair credit access indeed plays a big and positive contribution on technology adoption among smallholder coffee farmers. He explained as follows;
“Fair credit access initiatives especially from private sector like NGOs such as Farm Africa have enabled farmers to easily access better and improved technologies especially for coffee postharvest handling activities such as modern coffee hullers for hulling Kiboko or dry coffee, tarpaulins and raised wire mesh for coffee drying. He added that coffee guarantees such as post bank have enabled coffee farmers to access credit easily which have enabled farmers to have enough funds to use on their coffee farmers to adopt improved agricultural technology”.
The discussions are made according to the specific objectives as shown below;
Extension services and technology adoption among smallholder coffee farmers
As regards to whether access to extension services influence technology adoption among smallholder coffee farmers in Kanungu district, the findings revealed that there is a positive significant relationship (r=0.149*) between access to extension services and agricultural technology adoption. The regression also indicates that access to extension services have a positive influence on agricultural technology adoption. This indicates that an increase in access to extension services results to a significant increase in technology adoption. The above findings are in agreement with prior studies which also revealed that there is a positive relationship between accesses to extension services on technology adoption among farmers.
In agreement with findings, a study by Tefera, et al. in Ethiopia revealed that farmers who had more frequent contact with extension agents were more likely to adopt wheat technology as compared to farmers who had low frequent contact. Also, in line with the findings, Anderson and Feder reported that agricultural extension has the potential to facilitate technology transfer and management at low cost to the farmer, and can also relay farmer needs back to innovators and policymakers to ensure that innovations meet local needs. Malinga and Nampungu in Uganda supports the findings with their findings that agricultural advisory services communicate information on improved technologies that farmers should adopt to increase yields and earn higher incomes. Without any difference to the findings, Byamukama in Bushenyi Uganda also revealed that agricultural advisory services have positively affected access to agricultural information and adoption of new and improved technologies which increased crop yields and incomes. Similarly, Farrington, et al., revealed that extension and advisory services play an important role in increasing adoption of improved technologies and enhancing markets’ capacity to serve the poor.
Contrary to the above findings, Diiro found a negative relationship between access to extension services and technology adoption. In the same way, the findings disagree with who reported that extension services may be inversely related with adoption of agricultural technologies. According to Weir, et al., the information delivered by extension workers may be disconnected from farmer needs, and certain types of farmers may be underserved by extension workers which would pose a negative impact on technology adoption.
Market access and technology adoption among smallholder coffee farmers
As regards to whether access to market influences technology adoption among smallholder coffee farmers in Kanungu district, the findings revealed that there is no significant relationship between access to market and agricultural technology adoption. The regression also indicates that access to extension services have no significant influence on agricultural technology adoption. The above findings are in disagreement with prior studies. For example, Tefera, et al., revealed that maize and technology package adoption improved as the farmers became closer to market while the reverse held true for wheat technology package adoption. This is not the case with coffee technology. Gebresilassie and Bekele and Ogada, Mwabu, and Muchai found that distance to market centers was negatively and significantly related to adoption of fertilizer technology which was not the case with the findings of this study.
In addition, Bagamba revealed that farmers in Uganda can become technically efficient if farmers can access ready market for their commodities. In this study, Bagamba findings are false as there is no significant influence of market access on technology adoption. In addition, the findings do not agree with Ainembabazi, et al., who revealed that distance to the nearest market is one of the factors that affected adoption of improved agricultural technologies. Jack revealed that farmers who would benefit from adoption of agricultural technologies may be unable to access or to pay for the technology due to inadequate infrastructure, missing supply chains, or unprofitably high prices. While this assertion might be true in theory, it is not true in practice as per the findings of the current study.
Credit access and technology adoption among smallholder coffee farmers
As regards to credit access and technology adoption, the correlation and regression results revealed that there is a positive significant relationship between access to credit and agricultural technology adoption. The findings imply that access to credit have a statistically significant influence on agricultural technology adoption among smallholder coffee farmers in Kanungu district. The above findings are in agreement with prior. For example, Kafle in Ethiopia revealed that farmers who have access to credit service had more probability to adopt the agricultural new technologies than otherwise. Daniel and Kafle confirms access to credit can increase the probability of adoption of agricultural new technologies by offsetting the financial shortfall of the households. The same findings were revealed by Ogaba, et al., who posited that financial resources were necessary to finance the uptake of new technologies. In their study, households who had more access to formal and/or informal sources of credit significantly adopted technology.
The findings also agree with Minai, et al., in Kenya whose findings show that 76.52% of the farmers needed credit to farm their coffee and adopt improved coffee technologies. Okoedo- Okojie and Onomolease also observed that credit enables farmers to adopt new technologies more readily since they are able to plan ahead. Croppenstedt, et al. reported that farmers often cite lack of capital as a major reason for not adopting a technology that could improve their productivity. In their study, if farmers can access credit, technology adoption would improve. This study agrees with the findings of Croppenstedt, et al. According to Matiya, et al. access to credit helped the farmers to buy/hire transport equipment buy manure, hire labor to apply manure among other things which increased on the level of use of cattle manure as an inorganic fertilizer in coffee. This agrees with the findings.
The above findings however disagree with Diagne, et al. who in their findings revealed that even when credit was made available to the farmers, they would not adopt a given set of technology. The findings also disagree with Feleke and Zegeye who found that about 68% of the farmers did not use credit in their operations although the physical distance between farms and credit centers such as bank, finance company and cooperatives were not more than 5 kilometers-7 kilometers. In this current study, level of credit usage was as low as 72%. However, the findings agree with Feleke and Zegeye on issues limiting credit usage including unfavorable credit policies and higher interest rate which caused high cultivation cost and period of repayment. If these issues can be resolved, easy access to credit may possibly influence the farmer’s decision to adopt technology.
The study generally sought to examine the influence of institutional factors (Extension services, Market access, and credit access) and agricultural technology adoption amongst small holder farmers in Kanungu district. From the correlation and regression statistics, the study concludes that there is a moderate positive significant relationship (R=0.380*) between institutional factors and technology adoption among smallholder coffee farmers in Kanungu district. The results postulate that 14.4% of the variations in technology adoption is attributed to variations in institutional factors such as access to extension services and access to credit but not access to market. Amongst all the institutional factors assessed, it is only access to extension services and access to credit that have a significant influence on technology adoption while access to market does not influence technology adoption. 85.6% variations or changes in technology adoption amongst smallholder coffee farmers are contributed by other factors like cultural beliefs, political factors, and economic factors.
Conceptualization, E.N.; methodology, E.N.; software, E.N. and B.M.; validation, E.N., E.S. and R.M.K; formal analysis, B.M and E.N.; investigation, E.N.; resources, E.N.; data curation, E.N.; writing original draft preparation, B.M. and E.N.; writing review and editing, E.N., E.S. and R.M.K.; visualization, E.N.; supervision, E.S. and R.M.K.; project administration, E.N.; funding acquisition, E.N. All authors have read and agreed to the published version of the manuscript.
This research received no external funding.
Institutional review board statement: The authors of this article ensured all the ethical considerations and the original proposal, data collection tools and dissertation were approved by the Institutional Review Board of Bishop Stuart University.
Not applicable.
Great thanks are extended to Dr. Edward Semakula and Ms. Rebecca M. Kalibwani for their contribution ass supervisors. Their academic advice and guidance contributed significantly to the accomplishment of the original study from which this article has been developed. In addition, the efforts of Mr. Boaz Mujuni and company of Datamine Research Centre, Mbarara is also greatly acknowledged. The agricultural extension officers at Kanungu district also played a significant role in availing the necessary information and identifying farmers. Hence, their efforts are greatly acknowledged.
The authors declare no conflict of interest.
[Crossref] [Google Scholar] [PubMed]
Citation: Nabaasa E, Kalibwani RM, Semakula E (2023) Institutional Factors and Technology Adoption amongst Smallholder Coffee Farmers in Kanungu District South-Western Uganda. Agri Sci Food Res. 14:149.
Received: 14-Oct-2022, Manuscript No. JBFBP-22-19603; Editor assigned: 17-Oct-2022, Pre QC No. JBFBP-22-19603 (PQ); Reviewed: 31-Oct-2022, QC No. JBFBP-22-19603; Revised: 10-Jan-2023, Manuscript No. JBFBP-22-19603 (R); Published: 01-Jun-2023 , DOI: 10.35248/2593-9173.23.14.149
Copyright: © 2023 Nabaasa E, et al. This is an open-access article distributed under the terms of the Creative Commons Attribution License, which permits unrestricted use, distribution, and reproduction in any medium, provided the original author and source are credited.