Journal of Tourism & Hospitality
Open Access
ISSN: 2167-0269
ISSN: 2167-0269
Research Article - (2017) Volume 6, Issue 6
In this study the Importance-Performance Analysis (IPA) of Tourism Destination Competitiveness (TDC) in Ethiopia was conducted from the tourists’ perspective. 384 inbound tourists to Ethiopia were taken as a sample. Mapping the scores of attributes regarding their importance and performance against the Iso-Priority Line gave a meaning that the distribution of attributes in the graph were more skewed to the importance of attributes than the performance which speaks that Ethiopia as a tourist destination has more of homework to catch up and maintain its global competitive balance than more of a competitive advantage. Based on the market behavior of inbound tourists to Ethiopia, the important market wise deviation was observed only on the importance of two TDC constructs (amplifiers and demand condition) on North Americans and Africans, respectively. Through the IPA four quadrant grid, entry points of Ethiopian TDC were found that show how to deploy scarce resources to where they are needed most through demand based and context based interventions or public spending. A set of robust indicators that are short and ready for immediate application in Ethiopian context were found with a point of caution that these should be directly aligned with the geopolitical policy priorities so it can help the country compete with global economies of mature tourism sector.
<Keywords: IPA; Tourism destination competitiveness; Ethiopia
The travel and tourism industry is one of the fastest growing industries in the world, with international receipts booming from US$ 2.1 billion in 1950 to US$ 682.7 billion in 2005 [1] and with arrivals dramatically rising from a 922 million in 2008 to a projected 1.6 billion in 2020 [2].
In spite of the rapid expansion of tourism worldwide, it is only recently that Ethiopia officially has acknowledged the benefit of the tourism sector to economic growth and prosperity. Up to the near past, the industry, for many reasons, has not received sufficient attention.
Quite recently, however, Ethiopia is managing to attract a big number of international inbound tourists; a total of 681,000 and770, 000 in2013and 2014, respectively, with international tourism receipts of USD 1,998,000,000.00 and 1,980,000,000.00 in 2011 and 2012, respectively, according to the World Bank [3].
Ethiopia is a country located in the in the East Africa with its vast natural, cultural and historical patrimonies. It has a total number of 10 UNESCO registered world heritage sites and 5 in the tentative list which the number together makes it the leading country in Africa, UNESCO [4].
Notwithstanding the diverse endowment of the country, the sector is dominantly based on mass cultural holiday tourism such as Meskel (Finding of the True Cross) and Timket (Epiphany) festivals, which make it substantively seasonal. The global market share is so low even far behind from its African counter parts, though the country’s pattern of attraction level is increasing. The country attracts only less than 1% of its population while countries like Malta manage to attract more than 300% of their inhabitants [5].
In addition to this, while the current emphasis on tourism sector of Ethiopia is appreciated, a mere acknowledgement does not play great role to its global competitive balance. All destinations put a disproportionally great effort to exploit this economically lucrative industry, maintaining tourism competitiveness becomes a formidable challenge as destinations struggle to differentiate their destination offerings while remaining price competitive [6,7].
The problem
Needles to mention that Ethiopia needs to develop, maintain and enhance the global competitiveness balance of its destinations in an attempt to slice a fair share of what the sector offers, the critical question is learning about how does a destination become competitive [7-9]?
There are so many postulates as to what and how determines TDC. However, all prescriptions remain rather partial in terms of comprehensiveness, exclusiveness, indicator measurability, weight and what apples in what context.
There is no final set of robust indicators that has been kept short and ready for immediate application needs of destinations.
In addition to this, the existing competitiveness propositions are centered on the advanced economies of mature tourism sector and, therefore, cannot be directly aligned with various developing economies’ (like Ethiopia) domestic policy priorities and contexts.
These all generally indicate that there is a need of confirmatory research peculiar for a specific destination.
Azzopardi [5] dictates that it is difficult to improve competitiveness unless there is a continuous assessment of the strengths, weakness, opportunities, shifting demands and performance of a destination. However, another question comes who has to evaluate performance of a tourism destination.
Among many, Croach [10] stipulates that tourists can be used to benchmark aspects of competing destination performance and are an obvious source of external ideas. It shows key strengths and weaknesses of a destination from the visitor perspective. It is argued that the satisfaction of tourists can appropriately measure the tourism competitiveness of a destination since, according to a consumers based view; quality is what is perceived quality by the consumers, and so the tourist’s evaluation is considered a proper tool to evaluate tourism competitiveness [11].
Laws [12] stated that tourists experience of other competing destinations affect their perceptions of quality as they implicitly or explicitly make comparisons between facilities, attractions and service standards of various destinations.
Similar to the Law’s assertion, Dwyer and Kim [9] suggested research gaps that need to be researched on future works as quoted in the following;
“Further research is needed on the importance of different attributes of destination competitiveness in determining tourism flows for visitors in different market segments.”
The current study has completely covered the above research gap by using tourists as a source of external idea on TDC evaluation through Importance-Performance Analysis (IPA).The IPA technique is known in facilitating the identification of attributes [9,13]. It is also helps the mobilization and deployment of scarce resources to where they are needed most [14]. Dwyer and Kim [9] explain the benefit of IPA as easy to interpret, it helps the development of local management strategies, derives practical suggestions and allows to directly compare the importance and performance within the same attribute.
Generally, the basis for undertaking Importance-Performance Analysis (IPA) of Ethiopian TDC from tourists’ perspective is; 1. Academically, it is believed that the academic debate on TDC needs to get depth and scale by adding destination based and tourists’ perspective fuels; 2. Practically, Ethiopia should follow the verified version of the ideas that the scientific community has theoretically agreed which will help the country make demand and context based interventions and public spending.
The general objective of the study is to find out the country specific determinants of Ethiopian TDC.
Research questions
1. What are the common and market specific important attributes of TDC for Ethiopian visitors of different market segments?
2. What attributes is Ethiopia, as a tourism destination, performing well and lagging behind its competitors from the users/tourists perspective.
This part of the paper indicated the prior models, theories, empirical studies and the operationalization of TDC in this paper.
Definition
In this paper, TDC is understood in the widely accepted definition suggested by Ritchie and Crouch [15] i.e. “a destination’s ability to increase tourism expenditure, to increasingly attract visitors while providing them with satisfying, memorable experiences, and to do so in a profitable way, while enhancing the well-being of destination residents and preserving the natural capital of the destination for future generations” (p. 2).
The Dupeyras and MacCallum stipulation on TDC: Dupeyras and MacCallum [16] have developed more comprehensive indicators for measuring competitiveness in tourism.
In a more narrowed sense, they claim that the decision making process of tourists in making choices can be distilled down into three dimensions:
“A set of options the tourist mentally appraises, the attraction (or distraction) and the ability (or inability) of the destination to provide for them…” (p.11).
Considering these distilled dimensions, they have provided input and output indicators. The output indicators are not important here. The following paraphrased indicators are the input indicators of tourism competitiveness stipulated by the authors;
Entry visa requirements: The time and cost for visa formalities can influence tourist choice and by reducing such impediments, a destination can position itself as more tourist friendly and welcoming.
Natural, cultural and creative resources: Countries with a large number of natural heritage sites, distinct cultural identity and range of creative activities can promote competitiveness.
Market diversification and growth markets: The breadth of source market coverage and growth into new generating regions reduces dependency risks and can raise competitiveness.
Air connectivity and inter-modality: The unconnected destination will be inaccessible to tourists. The availability of air routes, operators and frequency of flights affects tourism competitiveness
Better life index: The well-being of a nation (justice, governance, security, housing, income, jobs, education, health, work-life balance play a crucial role for destination attractiveness as the most competitive destination is ones which create well-being for its residents.
Government budget appropriations for tourism: Government financial commitment to the tourism sector can fill market failures, stimulate growth and low levels of commitment result in a sub optimal performance and long term loss of global competitiveness
Company mortality rate: A dynamic business sector will stimulate more business births than deaths. The relative level of business failures in the sector year-on-year speaks competitiveness.
E-tourism: The use of e-tourism services and presence on social media outlets and blogging sites contributes to their overall tourism competitiveness.
Structure of tourism supply chains: The use of tourism cluster mapping, strengths and size of firms by segment within the industry in each country are crucial for competitiveness.
Purchasing power parities (PPPs) and consumer price index for tourism: The measure of how many units of a common currency a given quantity of goods and services costs in different countries and the inflation rate of a country are also important indicators of competitiveness.
The Ritchie and Crouch’s model of TDC
According to Ritchie and Crouch model (2003), this conceptual model of TDC has about 36 attributes classified into six key factors. Core resources and attractors, Supporting factors and resources, Destination policy, planning and development, Destination management and Qualifiers and amplifiers
The variables in the model explain and measure more direct and immediate impact than the macro environment elements.
The Dwyer and Kim’s integrated model of TDC
Dwyer and Kim’s Integrated Model of TDC, developed in 2003, has four general attributes; core resources, destination management, demand conditions, situational conditions. The Model came up with a brand new generic variable called Demand Conditions which recognized the demand condition as an important determinant of TDC. This model also separates between tourism infrastructure and general infrastructure which are under the label “superstructure” of the Core Resources and Attractors in the Crouch-Ritchie model.
The WEF travel and tourism competitiveness index (TTCI)
This is the major well organized undertaking of developing tourism competitiveness at international level.
This has fourteen pillars that measures countries TDC under three sub-indexes. Sub-index A: The travel and tourism regulatory framework; Sub-index B: The travel and tourism business environment and infrastructure and Sub-index C: The travel and tourism human, cultural and natural resources
The WEF has magnificently devoted into going beyond the listing of indicators to methodological development for analysis and policy purpose. It has also a data base for the indicators setout beginning from 2007.
Empirical body of knowledge on TDC
Caber et al. [17] made study on the four major market segments (German, Russian, British and Dutch) to determine the most important competitiveness attributes. The data for the study were obtained from 41 accommodation facilities in the Side-Manavgat area of Antalya. Tourists were subjected to evaluate performance and importance of competitiveness attributes. They found that nightlife, interesting activities, museums and galleries are the ‘low-priority’ attributes of the destination for all respondents. Two attributes such as safety and price/performance ratio are the attributes that should be concentrated on for all respondents. Other attributes were differently important for different tourists, according to their finding.
Dwyer et al. [9] conducted a research to come up with tools for measuring destination performance with particular focus on Importance-Performance Analysis (IPA) of Slovenia.
Their findings reveal that the most important issues for Slovene tourism stakeholders were those related to sustainable development and climate change, followed by tourism education, marketing, innovation and product development. The largest gap between importance and performance was identified as relating to tourism education.
Erbaşa and Perçinb [18] conducted an Importance-Performance Analysis on Turkish thermal tourism destination. The results suggested that natural hot springs, sound local transportation network, availability of sufficient accommodation, hygiene standards for hot springs spa equipment, public interest in health-leisure activities are important factors for the competitiveness of thermal tourism destinations.
Sampling technique
Questionnaire were developed for the purpose of this study and administrated to 384 inbound tourists to Ethiopia. This is by the formula of infinite population; the number of tourists who come to Ethiopia cannot be determined because at infinite time infinite tourists can come. Therefore, to penalize this problem Gomm [19] suggested the following formula and is used in this paper (Annexure);
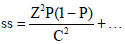
SS=Sample size
Z=Given z value (e.g. 1.96 for 95% confidence level)(tells how sure one can be. It is expressed as a percentage and represents how often the true percentage of the population who would pick an answer lies within the confidence interval. For example, 95% confidence level means that if one had conducted the same survey 100 times, 95 times out of 100 the survey would have yielded the same results.).
p=ideal percentage of population one wants to approach (20% in this case); C=Confidence interval (0.4). For example, if one use a confidence interval of 4 and 95% of the sample picks an answer one can be “sure” that if one had asked the question of the entire relevant population between91% (95-4) and 99% (95+4) would have picked that same answer.
Steps to increase response rate
The concept of sample penalty was dully applied here as some rigidity is required that data from384 should be collected excluding incomplete answers and unfilled questionnaires. According to Jamess et al. [20], it can be assumed that about 75 percent of the distributed questionnaire would be collected back correct and therefore in this study it is decided that 25% more be distributed. 25% 384 is 96 and 25% of 96 is 24, 25% of 24 is 6 and 25% of 6 is approximately 2. Then the total is 384+94+24+6+2=512.
Therefore, 512 questionnaires were distributed raised from 384 by 128 and collection was conducted up to the needed correct amount is gained. Response rate is100% as collection is stopped after complete 384 is collected.
Data collection tool: Questionnaire that track respondents’ perceptions about the importance and performance of the destination attributes were assessed on a 7-point scale with endpoints of (1) “Extremely Unimportant” and “Extremely Underperforming” to (7) “Extremely Important” and “Extremely Performing”.
Questionnaires were distributed to five hotels and two Tour Operators in Addis Ababa selected by their tendency to accommodate inbound tourists and capacity to get enough informants as stipulated in the sampling technique. For the hotel, the aim and details of the questionnaire were explained to receptionists and front office managers of the selected hotels and get them filled in the lobby area or else keep it in guests’ room to be filled. For the tour operators, tour guides were asked to get it filled on the completion of a tour itinerary with tourists. After the collection of the required quantity of completely filled questionnaires, analysis was mad using IPA technique. To proceed with the IPA, the 1 to 7 interval scale of data was rescaled into 0 to 100 where 0 is the worst and 100 the best outcome. Rescaling all the data to a 100 point scale keeps relative positions of bubbles consistent relative to the static four quadrant background. Rescaling was done like this:
Data point rescaled=(data point-MIN value)/(MAX value-MIN value) × 100
On a 1 to 7 scale, a 4 would for example become (4-1)/(7-1) × 100=50.
An excel MAX and MIN functions were used to find the maximum and minimum values of Importance and Performance indicators, respectively. The MAX and MIN formulas are=MAX (Range of cells) and=MIN (Range of cells).
Table 1 presents the rescaled mean value of attributes’ scores. To do this, the response of each informant was summed up on each attribute and divided to 384 cases. To proceed with the IPA, the 1 to 7 interval scale of data was rescaled into 0 to 100 where 0 is the lowest and 100 the highest outcome. Rescaling all the data to a 100 point scale keeps relative positions of bubbles consistent relative to the static four quadrant background. This summarized data is used to compute the IPA Generic Iso-Rating/Iso-Priority Line and the two dimensional grid of the IPA quadrant presented in the subsequent parts.
| Constructs | Indicators | Rescaled Mean Value of Importance N=384 | Rescaled Mean Value of Performance N=384 | Label in the Grid |
|---|---|---|---|---|
| Core Resources and Attraction | Unique culture | 81.86 | 53.73 | A |
| Notable history and heritage | 75.09 | 75.35 | B | |
| Notable natural beauty or country’s stock of natural assets | 90.54 | 80.16 | C | |
| Museums and galleries | 72.74 | 70.75 | D | |
| Tourism activities (Sport tourism and special events | 68.32 | 64.71 | E | |
| Demand Conditions | Price of accommodation | 33.07 | 93.71 | F |
| Price of transportation | 27.30 | 86.46 | G | |
| Dollar to birr conversion rate | 80.82 | 75.61 | H | |
| Complementary Conditions | Shopping Facilities | 28.26 | 36.15 | I |
| Accommodation facilities | 79.56 | 37.54 | J | |
| Health and wellness offers | 63.98 | 34.38 | K | |
| Air Infrastructure (carriers, air routes, flight frequency from main markets) | 77.21 | 70.75 | L | |
| Ground Infrastructure | 67.10 | 56.68 | M | |
| Destination Management | Human resource development | 76.48 | 41.71 | N |
| Structure of tourism supply chains, systems and institutional capacity | 73.57 | 48.18 | O | |
| Destination development on product diversification, differentiation and uniqueness | 80.51 | 34.46 | P | |
| Language service | 67.27 | 41.97 | Q | |
| Crisis management Legal environment | 75.30 | 82.29 | R | |
| Urbanization | Aesthetics of urban areas (Building designs, road and railway designs) | 73.39 | 22.35 | S |
| Nightlife | 33.07 | 43.84 | T | |
| Urban Facilities (Sanitation, clean water, telecommunication and electricity) | 80.03 | 27.43 | U | |
| Qualifiers | Safety/security | 90.32 | 88.89 | V |
| Awareness/image/brand positioning | 75.22 | 26.82 | W | |
| Visa bureaucracy or methods of visa issuance | 84.24 | 81.34 | X | |
| Climate | 74.96 | 88.06 | Y | |
| Amplifiers | Geostrategic proximity or centrality distance from major generating countries | 45.66 | 67.23 | Z |
| Service Philosophy | 74.83 | 37.89 | α | |
| Hospitality | 82.60 | 86.11 | β |
Table 1: Rescaled Mean Value of Attributes' Scores. Source: Own Computation.
Conducting the importance-performance analysis was started by performing the IPA Generic Iso-Rating/Iso-Priority Line determination. The IPA Generic Iso-Priority Line is a line that divides the graph in to two at 45 degree where importance equals performance. Mapping the scores of attributes regarding their importance and performance against the Iso-Priority line gives a meaning of whether the scarce resources of a destination are being used efficiently/wasted/ deployed adequately/in adequately or over adequately, as well as whether they are distributed evenly/unevenly or equitably/inequitably (Figure 1).

Figure 1: Iso-Priority Line.
In the IPA graph, all bubbles below the Iso-priority line represent bubbles where importance of an attribute exceeds performance which indicates the destinations need to concentrate on them. Whereas, points above the line indicate that performance on an attribute exceeds the importance which shows that there is waste of resources deployed in areas of relatively low importance.
Now, if one sees Figure 1, one can find that it is not that all variables’ importance is higher than their performance counterpart; neither is true in its other way round look. The distribution in the graph shows that there are three destination attributes where their importance is exactly the same as their performance which fall exactly on the Iso- Priority Line. On the other hand, there are other five variables that are found with marginally higher performance than their importance counterpart. The rest twenty variables are found more important than their performance in the eye of inbound tourists to Ethiopia. What not to be forgotten is that some bubbles in the graph are overlapping to each other.
Generically, the graph is more skewed to the importance of attributes than the performance one. This kind of distribution of attributes in the graph speaks that Ethiopia as a tourist destination has more of home work to catch up and maintain its global competitive balance than more of a competitive advantage.
As the above presentation is more generic, the next question comes now as what are the specific attributes that will be useful for immediate application with various types of market behaviors? The following four quadrants IPA grid answers this question with specific illustration of each attribute of the destination competitiveness measure with their specific position in the quadrant.
The above IPA grid matrix, Figure 2, shows key strengths and weaknesses of the Ethiopian Tourism Sector from the tourists’ perspective. The result displayed in the Northwest of the grid, dictates that three indicators are depicted to lay in this quadrant. The indicators are price of accommodation, price of transportation and geographic position of the destination from main tourist generating countries. This quadrant holds items that are low in importance but relatively high in performance. The quadrant is often labelled as ‘Overkill’ as some of the resources invested in enhancing performance of attributed that fail in that quadrant may be ‘wasted effort’ and can be better if diverted elsewhere given the relatively low importance of the performance of a destination on these items. Specifically speaking, the fact that the price of accommodation and transportation is low doesn’t give much satisfaction for inbound tourists to Ethiopia. It can be that inbound tourists to Ethiopia are less sensitive to such prices mainly because tourists have the experience of highly expensive cities which makes them expect the same pricing here in Ethiopia which is a great competitive opportunity for accommodation and transportation providers to expand their margin of profit by increasing the price of their product as providing cheap service is not a factor of satisfaction. Besides, it shows it is a great west of resource in providing low priced transportation and accommodation service for those price insensitive customers while in fact they could enjoy a great margin of profit per sale and therefore these areas should be a point of opportunity for maintaining competitive balance at marginally better pricing. With regards to geographic position, it is found the fact that a destination has an advantage of proximity or centrality doesn’t help in maintaining competitiveness.

Figure 2: Result of the Two-Dimensional Grid of the IPA Quadrant on Ethiopian TDC.
The second result is presented in the South West quadrant. The Southwest quadrant identifies attributes of relatively low importance and also where the destination is performing relatively poorly. Two variables night life and shopping facilities were found to be in the Low Priority section indicating that the typology of inbound tourists to Ethiopia is those who are less concerned about these attributes and the destination is not also providing them well. This result leads to the conclusion that these items should keep receiving a ‘low priority’ in resource allocation decisions and divert such resources to other priority areas.
The third analysis is on variables that lay in the Southeast quadrant. Variables that lay here are depicted as their importance is high but their relative performance is low. This quadrant is often labelled as “Concentrate Here”. In this part, ten indicators were found to fall to this quadrant. These indicators are health and wellness offers, language service, structure of tourism supply chains and systems and institutional capacity, service philosophy, human resource development, destination development on product diversification, differentiation and uniqueness, accommodation facilities, awareness/image/brand positioning, urban facilities (sanitation, water, telecommunication and electricity), aesthetics of urban areas (Building designs, road and railway designs). While inbound tourists to Ethiopia were found to need these services highly, in the ground the services provided by Ethiopia as a destination were found underperforming or uncompetitive which is the main challenge in maintaining competitiveness. Such a placement would indicate that the destination needs to focus on improving its performance on these particular attributes, as their neglect could exacerbate strategic drift. The destination (Ethiopia) should divert it resources falling in the Northwest quadrant to this (Southeast) quadrant as the items in this quadrant play great role to its global competitive balance which is a typical of deploying scarce resources to where they are needed most.
Generally, the destinations should put a disproportionally great effort to exploit this economically lucrative industry, beating the formidable challenges through these entry points which are both demand based and context based interventions and public spending. This identification of what apples in what context with these set of robust indicators that are short and ready for immediate application should be directly aligned with the domestic policy priorities so it can help it compete with advanced economies of mature tourism sector in the global tourism arena.
The final quadrant of the analysis is the North East. Items in the North East quadrant indicate items of high importance and in which the destination performs relatively well. There are thirteen competitiveness attributes found in this quadrant. They are unique culture, notable history and heritage, notable natural beauty or country’s stock of natural assets, museums and galleries, tourism activities (sport tourism and special events), Dollar to Birr conversion rate, air infrastructure (carriers, air routes, flight frequency from main markets), ground infrastructure, hospitality, climate, visa bureaucracy or methods of visa issuance, safety/security, as well as crisis management and legal environment. These variables were praised to be very good performing or good standing by the inbound tourists to Ethiopia which indicate that those are the areas where the country needs same and steadily continuous efforts to ‘keep up the good work’’ or at least to maintain the status quo.
Generic construct of IPA for different market segments
As can be shown in Figure 3, IPA of the generic constructs of TDC for different market segments was made for visitors in different market segments. The common important attributes of TDC for Ethiopian visitors of different market segments were explained in the above. Now the market specific important constructs of TDC for Ethiopian visitors of different market segments are presented. Attributes are the specific items or indicators of measurement while constructs are the generic predictors that summed up similar items together and it is computed as summing up the mean score of the inner attributes and dividing the total to the number of attributes in that construct. Accordingly, the constructs of TDC taken in this study are core resources and attraction, demand conditions, complementary conditions, destination management, urbanization, qualifiers and amplifiers.

Figure 3: Generic Construct IPA for Different Market Segments.
Prior to making the analysis, it was found critical to study the market behavior of the permanently dominant and substantial tourism markets to Ethiopia rather than the total respondents as their sample size was marginal higher than the emergent markets. It also makes much more sense to policy makers to hear about the substantial market than the emergent. In so doing, creating a pattern of inbound tourist arrivals by taking time series data was found crucial. Accordingly, four years (2006 to 2009) inbound tourist arrivals data, found in the ministry of culture and tourism unpublished bulletin, of different regions of the world was computed. Subsequently, Africa with leading countries Kenya, Sudan, and Nigeria was found taking on average 33% of the total inbound tourists to Ethiopia. Then, Europe with UK, Germany and Italy as leading countries took 26%, and America with leading countries of USA and Canada took 20% followed by Middle East with leading countries of Saudi Arabia, UAE and Yemen which took 10% of the total inbound tourists to Ethiopia. Asia with leading countries of China and India took 10% and Oceania with leading country of Australia was found taking 1% of the total inbound tourists to Ethiopia.
So, the permanently dominant and substantial tourism markets to Ethiopia are Africa, Europe and America. Hence, IPA on TDC constructs for these permanently substantial markets was made. The result depicts that in the Amplifiers construct, on average, tourists of three of the regions rated the country as slightly performing and Africa and Europe rated the construct as slightly important while tourists from North America rated it as important.
In the qualifiers construct, the tourists from all regions rated the construct as important but all the tourists rated the destination as slightly performing, on average [21-23].
The urbanization construct was found slightly underperforming for all while regarding the importance Europe and North American tourists evaluated it as slightly important and the African counter parts were of neutral evaluation to the importance of the construct, on average.
For the destination management latent variable, tourists from three of the regions were of neutral judgment of Ethiopia’s performance of the construct but all of them rated the construct as slightly important to them, on average.
The destination’s performance on the complementary conditions was rated as neutral on average, while the construct’s importance was slightly important for all tourists from all regions, on average.
Important market wise difference on the importance of the demand conditions construct was between Africa and the rest two regions. On this regard, while Europe and North America rated the construct as they have neutral judgment, the African counterpart rated as slightly important, on average. Regarding the performance of the attribute all tourists from all regions rated as slightly performing, on average.
For the Core Resources and Attractions, all tourists from all markets rated the destination as slightly performing and the construct was important for all tourists from all the market.
All in all, the important market wise deviation was observed only on the importance of two constructs. The first deviation is the importance of the amplifiers construct where, on average, the North American tourists rated it as important and the rest as slightly important. This indicates that the North American tourists to Ethiopia are more sensitive for hospitality of host community, service philosophy of the destination and geographical proximity to their point of departure than the African and European inbound tourists to Ethiopia counter parts. The second observation of market wise deviation was found on the importance of the construct demand condition where Europe and North America rated the construct as they have neutral evaluation while the African counterpart rated as slightly important. This indicates more price sensitivity of the African Inbound tourists to Ethiopia than the rest.
The following conclusions are drawn from the study; items such as price of accommodation, price of transportation are found low in importance but relatively high in performance. Therefore, some of the resources invested in enhancing performance of attributes that fall in that quadrant are ‘wasted effort’ and can be better if diverted elsewhere given the relatively low importance of the performance of a destination on these items. It can be that inbound tourists to Ethiopia are less sensitive to such prices mainly because tourists have the experience of highly expensive cities which makes them expect the same pricing here in Ethiopia which is a great competitive opportunity for accommodation and transportation providers to expand their margin of profit by increasing the price of their product as providing cheap service is not a factor of satisfaction and therefore these areas should be a point of opportunity for maintaining competitive balance at marginally better pricing.
In the “Concentrate Here” quadrant, ten indicators such ashealth and wellness offers, language service, structure of tourism supply chains and systems and institutional capacity, service philosophy, human resource development, destination development on product diversification, differentiation and uniqueness, accommodation facilities, awareness/image/brand positioning, urban facilities (sanitation, water, telecommunication and electricity), aesthetics of urban areas (building designs, road and railway designs where needed highly but were found underperforming. Therefore, the destination (Ethiopia) should divert its resources falling in the low in importance but relatively high in performance to these indicators as these indicatorsplay great role to its global competitive balance via these entry points which is a typical of deploying scarce resources to where they are needed most through demand based and context based interventions and public spending. This identification of what apples in what context with these set of robust indicators that are short and ready for immediate application should be directly aligned with the domestic policy priorities so it can help it compete with advanced economies of mature tourism sector in the global tourism arena.
There are thirteen items of high importance and in which the destination performs relatively wellThese variables were praised to be very good performing or good standing by the inbound tourists to Ethiopia which indicates that those are the areas where the country needs same and steadily continuous efforts to ‘keep up the good work’’ or at least to maintain the status quo. The variables found to be in the Low Priority section indicating that the typology of inbound tourists to Ethiopia is those who are less concerned about these attributes and the destination is not also providing them well. This result leads to the conclusion that these items should keep receiving a ‘low priority’ in resource allocation decisions and divert such resources to other priority areas.
Based on the market behavior of inbound tourists to Ethiopia, important market wise deviation was observed only on the importance of two constructs. The first deviation is the importance of the amplifiers construct where, on average, the North American tourists rated it as important and the rest as slightly important. This indicates that the North American tourists to Ethiopia are more sensitive for hospitality of host community, service philosophy of the destination and geographical proximity to their point of departure than the African and European inbound tourists to Ethiopia counter parts. The second observation of market wise deviation was found on the importance of the construct demand condition where Europe and North America rated the construct as they have neutral evaluation while the African counterpart rated as slightly important. This indicates more price sensitivity of the African Inbound tourists to Ethiopia than the rest.
Mapping the scores of attributes regarding their importance and performance against the Iso-Priority Line gave a meaning of whether the scarce resources of a destination are being used efficiently, deployed adequately, as well as whether they are distributed evenly or equitably. The distribution of attributes in the graph were more skewed to the importance of attributes than the performance which speaks that Ethiopia as a tourist destination has more of homework to catch up and maintain its global competitive balance than more of a competitive advantage.
The fact that the research design inhabits some characters of exploratory nature, meaning such kind of study was not conducted in Ethiopia before, there is no enough reason to prescribe anything before further confirmatory research is conducted. This paper assumes that one research project should not be the beginning and the end of an idea. The fact that this paper has come up with certain level of conclusions should, therefore, not lead to a fast and hard prescription to the public and business community before further extended (with longer spanning period of time) and extensive (with broader scope of the study) research is conducted on the issue. Therefore, it requests the scientific community to augment this study through comprehensive, exhaustive, extensive and extended works of enquiry to get a refined set of items for immediate application.