Fungal Genomics & Biology
Open Access
ISSN: 2165-8056
ISSN: 2165-8056
Research - (2023)Volume 13, Issue 4
Plant disease can cause reduce quality and quantity of agriculture crops. In some countries farmers spend considerable time to consult with plant protection, while the time is an important factor to controlling of disease. Due to the fact that Powdery Mildew and Anthracnose fungal diseases cause the most damage in cucumber greenhouses, in this study, by presenting a non-destructive method based on image processing technique and artificial neural network, these two types of fungal diseases have been diagnosed. The steps related to the implementation of the proposed method are divided into three parts: Segmentation, separation of damaged parts from the leaf and classification of the disease type class. After color and texture features were extracted from cucumber leaf samples, a multilayer perceptron neural network with error post-diffusion learning algorithm was used to separate different classes of images. Network input is the average of the main color components Red, Green and Blue (R, G, B) of the images and the output is zero as a healthy leaf, number one as Powdery Mildew and number two as Anthracnose. The structure of this network was 24-3-4-3, which uses the tansig transfer function for the hidden and output layer and among the educational functions. So Back Propagation (BP) algorithm in neural network by using Lovenerg Marquart (LM) function training has been successfully to diagnosis and classifies plant diseases in 6 second with 99.95% accuracy.
Anthracnose; Artificial intelligent; Cucumber disease; Feature extraction; Powdery mildew
Plant disease is a major cause of economic losses in agricultural products worldwide, so monitoring the health and diagnosis of plants and trees is critical to sustainable agriculture [1]. Due to the high costs and harmful environmental effects of toxins, it is necessary to use a regulatory, accurate and time-saving method [2]. Nowadays, computer tools based on image processing knowledge in agriculture have been widely developed to monitor crop growth and the diagnosis of pests and plant diseases can have many benefits for those who do not have sufficient knowledge about crop cultivation [3,4]. Image processing in agriculture has applications such as diagnosing leaf, stem and fruit diseases, examining the area damaged by the disease, determining the color of the affected area, etc [5,6]. The amount of Area Under Cultivation (AUC), production and yield of greenhouse cucumber in the country according to the Jahad- e-Keshavarzi in 2013 is equal to 22805654 m², 1702491 tons and 23 kgm-², respectively. Among greenhouse crops, fungi cause the most diseases in cucumber greenhouses. Important fungal diseases that attack cucumber and mainly its leaves include Anthracnose, Powdery Mildew and internal blight [7]. In fact, the appearance of the products is affected by many diseases. One of the most common methods used by scientists is to estimate the extent of plant disease damage using human vision, grading and determining the percentage of contamination. Diagnosis and severity of the disease play an important role in disease control. Although there is a general standard for calculating the severity of the disease, since the severity of the disease is determined using the naked eye, it is not possible to accurately and standardly measure the severity of the disease. Among the problems of the ocular method is the different knowledge and perception of different people, which causes the severity of the disease in similar samples to be estimated differently by several experts. Thus, the measurements made are dependent on the individual and are not accurate [8]. In phytosanitary science, the principles and methods of diagnosing plant diseases are possible by using two methods of disease symptoms, which are mostly obtained from plant observations and disease symptoms, which are based on laboratory observations.
In the last decade, various researchers have used image processing techniques to study disease in plants. In 2009, they proposed a method based on support vector machines for the diagnosis of rice disease. In the method proposed by them, the shape and color features of the symptoms were used to classify the diseases [9]. In a method based on examining the histogram of the image layer and applying morphological filters, as well as examining the histogram of the images in the HSV color model to prevent the spread of internal measles in cucumber greenhouses with 90% accuracy was used [10] . In a novel algorithm for separate the disease area from healthy part in K-means clustering automatically proposed [11]. In that study, the texture features of grape leaf diseases, i.e., black measles, black rot and leaf blight were extracted and Support Vector Machine (SVM) classification method was used. The accuracy of the designed algorithm was 98.71. Also, the proposed method was compared with two deep learning methods, i.e., CNN and GoogleNet, which achieved classification accuracies of 86.82% and 94.05%, respectively. In order to diagnose the disease, color features, morphological features or texture have been used separately and in neural network classification and diagnosis, a neural network-based method has not been used.
The aim of this study was to use two factors of color and texture features in order to identify the damaged parts and classify it by the neural network with higher accuracy to diagnose diseases of greenhouse crops. It is also possible to design systems with the help of disease diagnostic algorithms to build a leaf analysis machine as plant medicine equipment. Developing and learning to use a neural network requires less time and cost than using other classification methods, as well as higher accuracy.
In this study, 150 images of cucumber leaves were used for analysis, which include healthy and infected leaves by Powdery mildew and Anthracnose disease. Powdery mildew, scientifically known as Sphaerothecu and Erysiphe cichoracearum, is one of the most important plant diseases of the squash family, which is found in relatively dry temperate regions. The symptoms of this disease are in the form of powdery white spots on the leaves and stems that gradually cover its surface (Figure 1A). Anthracnose disease is common in greenhouses with high humidity and is one of the destructive diseases of cucumber that appears as brown spots with a yellowish border and gradually covers the entire leaf surface and will reduce the efficiency of the product (Figure 1B).

Figure 1: Main image of greenhouse cucumber leaf. A: Powdery Mildew fungal disease; B: Anthracnose fungal disease.
The images were captured by the Canon Power Shot SX150 camera at 14 pixels magnification from a cucumber greenhouse with an area of 9600 square meters in light conditions and stored in the same format. The image size was 1000 × 1000 and the vertical distance between the lens and the sample surface was about 30 cm, which is the best distance for indoor photography [12]. The processing steps are shown in the block diagram (Figure 2).

Figure 2: Block diagram of image processing steps.
Image preprocessing
In the preprocessing operation in order to separate the leaf from the background, the images are automatically examined in addition to the RGB color space (the initial images are prepared from the leaf surface in this color space). The color components in the Hue, Saturation, Value (HSV) and l * a * b * color spaces are also examined. In addition to reducing the diagnostic error of the disease, this will reduce the image size and increase the image processing speed by removing additional image information. RGB color space model requires a large storage space, so in image processing we have to process in three different channels that will take a lot of time, so in order to reduce processing time, RGB color image to gray color space as shown in Equation (1) [13].
I (x, y) = 0.2989 **G + 0.1140R + 0.5870 *B ………… (1)
Due to the fact that the dimensions of 1500 × 1000 are very large for image processing and analysis and require a high computational memory, so a lot of time will be spent on image processing, so it is necessary to reduce the image size, so by applying the image size reduction command, The dimensions will be reduced from 1500 × 1000 to 750 × 500 pixels and will increase the processing speed of the algorithm on the images obtained from the cucumber leaf.
Image segmentation
One of the main factors for the success of the thresholding method is the specific shape of the histogram related to the color component, so that if the histogram shape has a peak, it can represent the product and the background and the image histogram needs to be balanced (Figure 3).

Figure 3: Histogram balancing. A: Main image; B: Image after histogram balancing; C: Histogram diagram main image; D: Histogram diagram image after balancing.
The most common color space model is the RGB model (Red, Green and Blue), which is frequently used to work with color images (Figure 4) [14].
Since the color space l* a* b* describes all the colors visible to the human eye and is designed almost similar to the human visual system, this color space has been selected for image segmentation. To segment the images, after removing the background of the images, the images were transferred to a color space independent of the lab device and then to remove the glow effect, the a* image component was removed and clustering commands were used only for the l * .b * components.

Figure 4: RGB color model. A: The main color component of Anthracnose disease; B: The main color components of Powdery Mildew disease.
The HSV color model describes all the colors visible to the human eye and is designed almost similar to the human visual system. The HSV color model identifies each color with three components: Color, saturation and value. In order to examine images in HSV color space, it is necessary to convert color space in the image processing toolbox, which is shown in Equations (2, 3, 4 and 5) convert RGB color space to HSV.
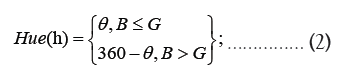
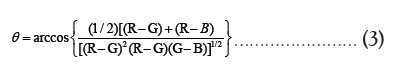
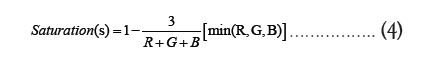
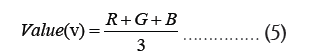
The image components in the HSV color space, it can be concluded that there is a large difference between disease and background spots in the V component of the image (Figure 5). While component V can be effective in reducing the penetration, which is caused by strong light noise. Examining the images prepared in the three color spaces, it was found that there is a big difference between healthy and infected parts of the leaf surface, so the average of color components in all three color spaces was used to segment the images.

Figure 5: Image component in the HSV model.
Color feature extraction
Since the performance of the algorithm depends on the features extracted from the image of cucumber leaf, so selecting a relevant and efficient feature from the set of color features extracted can increase the performance of the proposed algorithm for classifying cucumber leaf disease. In data mining issues, there are a variety of techniques for selecting better features including Sequential Feature Selection (SFS), factor analysis, Correlation based Feature Selection (CFS), genetic algorithm and sensitivity analysis [15]. In this study, the sensitivity analysis method, which is one of the most widely used methods for selecting superior features and has been used in many studies, was used, using this analysis, all 9 color components were selected (Figure 6) [16].

Figure 6: Sensitivity index analysis from different color component
of cucumber leaves. 

As can be seen, the color components R, G, B, H, S, V, L*, a* and b* have almost same high sensitivity values for leaf classes, so by applying a suitable threshold and converting gray images to binary was calculated the difference between the infected areas from the healthy part of the leaf to the division and extraction of the infected areas on the leaf surface. For segmentation, using the appropriate threshold, the damaged points were separated from the healthy points of the leaf surface and by converting color images to binary space and differentiating the damaged parts from the background, the position of the pixels of the damaged parts of the leaf surface was determined (Figure 7). In order to calculate the percentage of disease damage, the Equation (6), has been used:
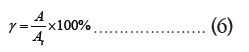
Where, A is the number of cucumber leaf pixels infected with the fungal disease and At is the total number of leaf pixels.

Figure 7: Segmentation of affected areas. A: Anthracnose disease; B: Powdery Mildew.
Textural features extraction
In recent years, the use of tissue features in the field of quality assessment of agricultural products has become common, this feature is used to classify and detect the affected areas of various agricultural products [17]. To analyze the texture of cucumber leaf samples in this study, the Co-Occurrence Matrix method is used, which is given in Equation (7), [18].
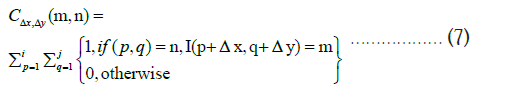
where, C is the perpendicular matrix, m and n are the values for the light intensity in the gray image, i and j are the image size, p and q are the spatial coordinates and finally Δx and Δy are the deviation parameters [19]. After applying this technique on the images of different classes of cucumber leaf disease and forming a Co-occurrence Matrix, the features listed are extracted from this matrix (Table 1).
| Equation | Mathematical equation | Co-occurrence matrix |
|---|---|---|
| Equation | 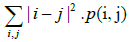 |
Contrast |
| Equation |  |
Energy |
| Equation | 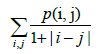 |
Homogeneity |
| Equation | 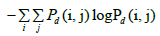 |
Entropy |
Table 1: Texture features obtained from the Co-occurrence matrix.
Design of artificial neural network model
In this study, the mean values of the main components of RGB, HSV and l* a* b*color and texture features (24 features in total) as network input and network output, zero as healthy leaf, number 1 as class I disease (Powdery Mildew) and Number two was considered as class II disease (Anthracnose). The neural network learning method used in this study was Back probagation and also the Sigmoid Tangent function (Tan-Sig) was used in the hidden layer and output of the network.
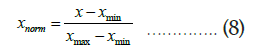
Trainlm, traingdm, traingd and trainscg training algorithms were used in network training and in creating each model, a fixed training algorithm is considered. In order to equalize the value of the data, all data is normalized before neural network training. There are different ways to normalize data given in Equation (8):
Results of segmentation and feature extraction
In order to segment the images and extract the background, the studied images were examined in three color spaces RGB, l*a*b and HSV. According to the studied images of greenhouse cucumber leaves, it was concluded that the intensity level of the gray surfaces of the pixels located on the Green component arrays has the largest value (Figure 8).

Figure 8: Intensity profile of gray surface values for red, green and
blue cucumber leaf arrays. 

Then, using the gray image histogram, the threshold was determined and the main component for image segmentation was determined. According to the individual histogram, the main components of the gray image show the differentiation of the G color component from the other color components and the histogram (Figure 9).

Figure 9: Histogram related to the colour components of the gray image. A: Component R; B: Component G; C: Component B.
As shown in Figure 8, the intensity distribution of the gray surfaces of the image pixels, the placement of the histogram peaks and the presence of deep valleys indicate that the gray surface images of the red, green and blue components are not suitable for other thresholding methods such as Otsu’s method. There are several modalities, so the threshold limit method has been used for this important. To select the most appropriate threshold limit, trial and error method was used. The threshold value was considered in the frequency range of 180-130 pixels. RGB Binary space was detected to detect the damaged part of the cucumber leaf surface, which is shown in Figure 6.
Results of selecting the best artificial neural network structure
To design the structure of the artificial neural network, in other words, to model the problem, a total of 150 images extracted from educational images were divided into three parts: Educational data (70% of images), validation data (20% of images) and finally evaluation data (10% of images).
The change in the number of latent neurons began with 3 neurons and continued up to a maximum of 10 neurons. As the number of neurons in these layers increased, the number of processors in the multilayer perceptron neural network increased, increasing the potential for processing this neural network. However, increasing the number of hidden layer neurons to more than a certain amount causes network error. After trial and error and according to 150 samples of two-layer perceptron neural network with 24-3-4-3 structure (input layer with 24, 2 hidden layers with 3 and 4 neurons in each layer and one layer Output with 3 neurons) was used. The 2 layers of the perceptron neural network simulated in Matrix Laboratory (MATLAB) software (Figure 10).

Figure 10: Single-layer perceptron neural network.
The training function used was Lunberg Marquat (LM) which was selected as the most desirable training algorithm. To select the best network structure, the statistical index of Mean Square Error (MSE) was used, based on which the value of MSE for a network with a hidden layer and 4 neurons in this layer (topology 3-4-13) was 0.0006, which was other neural network structures were more efficient (Table 2).
| Real class | |||
|---|---|---|---|
| Predicted | Healthy leaf | Disease number (1) (Powdery Mildew) | Disease number (2) (Anthracnose) |
| Healthy leaf | 17 | 12 | 14 |
| Disease number (1) (Powdery Mildew) | 0 | 0 | 1 |
| Disease number (2) (Anthracnose) | 1 | 0 | 0 |
| Accuracy | 1 | 1 | 99.95% |
Table 2: The confusion matrix obtained from the network.
In this research, using RGB images of three groups of cucumber leaves of greenhouse plants, including two disease groups of Powdery mildew and Anthracnose and one group of healthy leaves, in three color spaces RGB, HSV and l*a*b were studied. For this purpose, based on the thresholding of the images, the diseased part was separated from the healthy part and then the characteristics of the color and texture components were extracted from the images. Also, using artificial neural network by error propagation method and Lunberg Marquat (LM) training function with 24-3-4-3 (input layer with 24, 2 hidden layers with 3 and 4 neurons in each layer and one layer Output with 3 neurons) topology to classify and detect infected parts of leaf surface of every 150 leaf samples (healthy and unhealthy) with Performance accuracy was 99.95% in 6 s. According to the results of this study, as well as the speed of detection and reduction of economic costs, the proposed algorithms can be effective for the development and construction of testing and analysis of leaves in herbal medicine equipment or as control and monitoring systems in greenhouse units.
All authors contributed to the study conception and design. Material preparation, data collection and analysis were performed by [Author 1] and [Author 2]. The first draft of the manuscript was written by [Author 1, 2 and 3] and all authors commented on previous versions of the manuscript. All authors read and approved the final manuscript.
The authors declare that they have no conflict of interest.
Citation: Hosseini H, Zamani DM, Javidan SM, Arbab A (2023) Identify Fungal Diseases of Cucumber (Powdery Mildew and Anthracnose) Using Image Processing and Artificial Neural Network Approach. Fungal Genom Biol. 13:232.
Received: 15-Nov-2023, Manuscript No. FGB-23-28029; Editor assigned: 17-Nov-2023, Pre QC No. FGB-23-28029 (PQ); Reviewed: 01-Dec-2023, QC No. FGB-23-28029; Revised: 08-Dec-2023, Manuscript No. FGB-23-28029 (R); Published: 15-Dec-2023 , DOI: 10.35248/2165-8056.23.13.232
Copyright: © 2023 Hosseini H, et al. This is an open-access article distributed under the terms of the Creative Commons Attribution License, which permits unrestricted use, distribution and reproduction in any medium, provided the original author and source are credited.