Journal of Hematology & Thromboembolic Diseases
Open Access
ISSN: 2329-8790
ISSN: 2329-8790
Research Article - (2014) Volume 2, Issue 3
Background: Patients with neuropathy associated with anti-myelin-associated glycoprotein (MAG) antibodies are managed in part by the detection and whenever possible the measurement of IgM-component on serum protein electrophoresis (SPE). Hevylite™ is an immunoassay developed to quantify separately IgMκ and IgMλ and to calculate the IgMκ/IgMλ ratio (HLC ratio). We sought to determine whether HLC ratio can be used to assess diagnosis and to evaluate response to therapy in patients with anti-MAG neuropathy compared to the other currently available tests. Methods: In our tertiary care centre, we retrospectively studied a series of patients with anti-MAG neuropathy. Clinical data and serum samples were collected before treatment and between 6 months and one year maximum after treatment onset. Hevylite™ was performed in a second time after including all patients. Results: Forty-four patients were included (30 with monoclonal gammopathy of undetermined significance (MGUS) and 14 with Waldenström’s Macroglobulinemia (WM)). Thirty-nine patients (89%) had a monoclonal IgMκ and 5 patients had a monoclonal IgMλ (11%). Before treatment, all patients had abnormal HLC ratio and displayed a monoclonal IgM detected by SPE, with only 24 (55%) having a quantifiable IgM M-spike. Taking into account the 39 patients with monoclonal IgMκ, HLC ratio was significantly higher for patients with WM versus patients with MGUS (n=39; p=0.03). Before/after treatment comparisons revealed no significant variations of M-spike (p=0.13) and a trend to variations of HLC ratios (p=0.06) according to the clinical response. Conclusions: Our study confirms that HLC ratio using Hevylite TM assay is able to distinguish patients with WM versus patients with MGUS. It further provides numerical evaluation in patients with anti-MAG neuropathy, for who serum M-spike is no measurable or/and anti-MAG antibodies are also upper the quantifiable threshold.
Keywords: Anti-MAG neuropathy; Heavy/Light chain ratio; Monoclonal gammopathy of undetermined significance; Waldenström’s macroglobulinemia
M: Monoclonal; MAG: Myelin-associated Glycoprotein; SPE: Serum Protein electrophoresis; HLC: Heavy Light Chain; MGUS: Monoclonal Gammopathy of Undermined Significance; WM: Waldenström’s Macroglobulinemia; IFE: Immunofixation Electrophoresis; BTU: Bühlmann Riter Units; MRS: Modified Rankin Scale; CBL: Chlorambucil; RTX: Rituximab
Neuropathy associated with monoclonal (M) gammopathy represents 10% of patients with acquired neuropathy [1]. The incidence of these neuropathies increases among patients with IgM monoclonal proteins, as almost 50% of patients with IgM monoclonal gammopathy may have or will develop neuropathy [2]. Moreover, more than 50% of these patients have antibodies directed against myelin-associated glycoprotein (anti-MAG antibodies) [2,3].
Anti-MAG neuropathy associated with IgM monoclonal gammopathy constitutes a distinctive clinical syndrome characterized by male predominance, late age of onset, slow progression and predominantly sensory symptoms [3,4]. Neuropathy can be seen both in monoclonal gammopathy of undetermined significance (MGUS) or Waldenström’s macroglobulinemia (WM) and the therapy is depending from the lymphoproliferative disease.
Many assays can be used to monitor patients with neuropathy associated with anti-MAG antibodies, however each one has limitations. Measurement of serum M-spike on serum protein electrophoresis (SPE) is a valuable biomarker for clinicians in MGUS [5] or WM [6] but its resolution is sometimes inaccurate. The same applies to total IgM quantification by nephelometry (IgMneph) which inherently includes monoclonal and polyclonal immunoglobulins. Immunofixation electrophoresis (IFE) is a sensitive assay which identifies clonal IgMκ or IgMλ but it is not suitable to quantify M-component. Monoclonal IgM with anti-MAG activity can be also estimated by circulating anti-MAG antibodies with an ELISA assay but the level does not reflect the anti-MAG antibodies avidity on tissues [7].
The aim of this study was to evaluate the Hevylite™ immunoassay in patients with anti-MAG neuropathy associated with either an IgM MGUS or a WM. Patients were followed-up before and after chemotherapy to assess clinical and biological response.
Clinical data
Patients: We performed a retrospective analysis of patients treated for anti-MAG neuropathy in our tertiary care centre (Pitie-Salpetriere Hospital, Paris, France). These patients were recruited in our institution for a previous study assessing nerve conduction in patients with monoclonal gammopathy [8]. Diagnosis of anti-MAG neuropathy was established between 1991 and 2009 by neurologists. All patients had a complete neurological examination and underwent nerve conduction studies, as previously described [8]. Disability was measured using the modified Rankin Scale (MRS) [9]. They were all tested for monoclonal gammopathies and anti-MAG antibodies. The hematologic disease was confirmed by haematologists using criteria for MGUS and WM determined at the Second International Workshop on WM [10]. Complete blood count, search for cryoglobulinemia and bone marrow aspiration were performed in all patients to explore underlying lymphoproliferative disorder. This study was approved by our local review board and was performed in accordance with the declaration of Helsinki.
Follow up and response of therapy: Clinical data were collected before treatment and between 6 months and one year maximum after treatment onset. To evaluate the treatment response, we used the MRS. Improvement was defined as a > 1 point decrease in the MRS score, stabilization as an unchanged MRS and progression as a = 1 point increase. Clinical response was defined as neuropathies stabilization or improvement after chemotherapy [11].
Serum protein analysis
All serum samples were collected prior and after chemotherapy. M-protein was detected and quantified by SPE (Capillarys™, Sebia, Evry, France) then it was identified by IFE (Hydrasys™, Sebia, Evry, France). When monoclonal IgM was masked by other polyclonal immunoglobulins on SPE, the M-spike could not be quantifiable, this latter was reported without exact quantification. Nephelometry assay (BN™II, Siemens, Deerfield, USA) was used to measure total IgMneph. The reference intervals were categorized by gender and age according to the manufacturer recommendations.
Patient’s sera were kept frozen at -20°C until subsequent use for HevyliteTM. HevyliteTM was performed by turbidimetry on SPAPLUS™ (The Binding Site, Birmingham, UK) using heavy chain/light chain (HLC) reagents (The Binding Site). These reagents use polyclonal antibodies targeting unique junctional epitopes between the heavy chain and light chain constant regions of each intact immunoglobulin molecules. IgMκ and IgMλ were measured separately and the IgMκ/IgMλ ratio was calculated. The median and the 95th percentile ranges were obtained from 147 normal sera (blood donors). These ranges are intended for guidance purposes by the manufacturer. Median concentration IgMκ = 0.71g/L [95%CI: 0.19-1.63], IgMλ = 0.39 g/L [95%CI: 0.12-1.01] and HLC ratio = 1.81 [CI95%: 1.18-2.74]. A HLC ratio greater than 2.74 suggests a monoclonal IgMκ, and a HLC ratio lower than 1.18 suggests a monoclonal IgMλ.
Anti-MAG antibodies
Serum anti-MAG antibodies level was measured by ELISA (Bühlmann Laboratories AG, Basel, Switzerland) and was expressed as Bühlmann titer units (BTU) as per manufacturer’s instructions. The detection limit is 1 000 BTU and the measure is possible until 70 000 BTU.
Quantitative data were expressed as median values and range, and qualitative data as numbers and percentages. Comparison of quantitative values was performed using the non-parametric Mann-Whitney U test. Qualitative values were compared using Fisher’s exact test. Comparison of anti-MAG antibody titers before and after treatment was performed using the Wilcoxon sign-rank test. Correlations were analysed using the nonparametric Spearman’s test. All tests were bilateral and statistical significance was defined as p<0.05. A receiver operating characteristic (ROC) curve (a plot of sensitivity versus 1 minus specificity) was constructed to assess the diagnostic properties of the laboratory tests investigated in this study. Statistical analyses were performed using JMP8 (SAS institute, Cary, NC). Patients with monoclonal IgMλ had HLC ratio which vary inversely compared to patients with IgMκ. To overcome this problem, we have excluded the 5 patients (11%) with a monoclonal IgMλ for a part of statistical analysis of HLC ratio. Moreover patients with anti-MAG activity more than 70 000 BTU could not assess performance of anti-MAG antibodies.
Patient’s characteristics
Forty-four patients (29 men (66%) and 15 women (34%)) were included in the study. The median age at diagnosis was 67 years (range: 37-81 years). Clinical data are presented in Table 1. According to the criteria of the Second International Workshop [10], patients had either polyneuropathy associated with MGUS (n=30) or with WM (n=14).
Results were assessed after a first line therapy for 35 patients (80%) and after a second line therapy for the 9 others (20%). Eighteen patients (41%) were treated with chlorambucil (CBL) and 26 (59%) with rituximab (RTX) alone (n=16) or in combination with CBL or fludarabine or dexamethaxone (n=10) [12]. CBL was given either 5 days per month at a median dose of 10 mg/m², or continuously at a dose of 4 mg per day. Median duration of treatment was 18 months (range: 5-36 months). RTX was administrated at 375 mg/m2weekly for a median duration of 1 month (range: 1-6 months) [13,14].
Thirty-eight of the 44 patients (86%) responded clinically (18 were stable and 20 were improved) and the six others were non-responders.
Analytical results before treatment
All 44 patients had monoclonal IgM detected by SPE and IFE with only 24 (55%) having an IgM M-spike quantifiable on SPE (n=12/30 (40%) and n=12/14 (86%) in the MGUS and the WM groups respectively). Thirty-nine patients (89%) had a monoclonal IgMκ and 5 patients had a monoclonal IgMλ (11%). Thirty-five patients (80%) had IgMneph measurement superior at the limit range. All patients had anti-MAG antibody level higher than 1 000 BTU and 22 (50%) had anti-MAG activity more than 70000 BTU (n=13/30 (43%) and n=9/14 (63%) in the MGUS and the WM groups respectively) (Table 1). All patients had abnormal HLC ratio using HevyliteTM assay.
| Total patients | MGUS IgM patients | WM patients | |
| Total n (%) | 44 (100) | 30 (68) | 14 (32) |
| Male | 29 (66) | 22 (76) | 7 (24) |
| Median Rankin scale | |||
| Motor neuropathy | 21 (48%) | 12 (40%) | 9 (65%) |
| Sensory neuropathy | 42 (95%) | 30 (100%) | 12 (86%) |
| Ataxia | 31 (70%) | 22 (73%) | 9 (64%) |
| Pain | 35 (80%) | 24 (80%) | 11 (79%) |
| Monoclonal IgM kappa | |||
| Patients, n | 39 | 27 | 12 |
| Total IgMneph, median (range) | 3.6 g/L (1.2-20.8) | 3.2 g/L (1.2-20.2) | 5.7 g/L (2.0-16.6) |
| HLC ratio > 2.74, median (range) | 18.2 (4.5-815.0) | 16.5 (4.5-444.1) | 33.5 (6.6-815.0) |
| Quantified M-spike on SPE, n (%) | 20 (51) | 10 (37) | 10 (83) |
| median (range) | 5.0 g/L (2.2-11.9) | 4.8 g/L (3.3-11.3) | 6.4 g/L (2.2-11.9) |
| anti-MAG antibodies > 70000 BTU, n (%) | 19 (49) | 12 (44) | 7 (58) |
| Monoclonal IgM lambda | |||
| Patients, n | 5 | 3 | 2 |
| Total IgMneph, median (range) | 6.9 g/L (6.9-24.6) | 6.7 g/L (5.7-6.9) | 21 g/L (17.4-24.6) |
| HLC ratio < 1.18, median (range) | 0.1 (0.0-0.5) | 0.1 (0.1-0.5) | 0,04 (0.03-0.05) |
| Quantified M-spike on SPE, n (%) | 4 (80) | 2 (67) | 2 (67) |
| median (range) | 8.4 g/L (7.3-17.1) | 6.4 g/L (5.5-7.3) | 13.3 g/L (9.4-17.1) |
| anti-MAG antibodies > 70000 BTU, n (%) | 3 (60) | 1 (33) | 2 (100) |
Table 1: Patient’s characteristics before treatment. MGUS: Monoclonal Gammopathy of Undetermined Significance; WM : Waldenström’s Macroglobulinemia; SPE : Serum Protein Electrophoresis; IgMneph: Measurement of total IgM by Nephelometry; MAG: Myelin Associated Glycoprotein; BTU: Bühlmann Titer Unit
Summed concentrations of HLC assays compared with IgM concentrations
From sera collected before and after therapy (n=88), summed concentrations of IgMκ and IgMλ correlated strongly with total IgMneph concentrations (ρ=0.97, p<0.0001) (Figure 1).
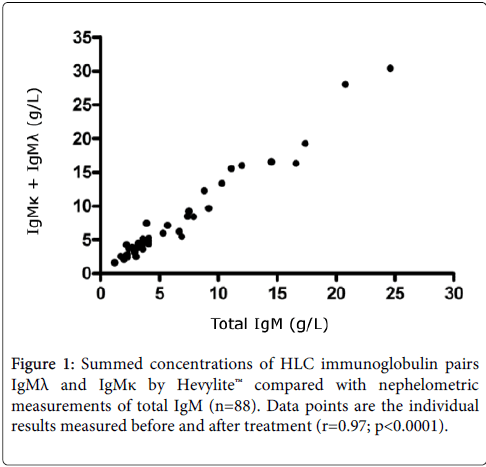
Figure 1: Summed concentrations of HLC immunoglobulin pairs IgMλ and IgMκ by Hevylite™ compared with nephelometric measurements of total IgM (n=88). Data points are the individual results measured before and after treatment (r=0.97; p<0.0001).
Clinical specificity of Hevylite™ for monoclonal IgM gammopathies
No significant difference was found for the IgM M-spike when quantifiable on SPE to distinguish patients with IgM MGUS or with WM (n=19; median M-spike MGUS 4.8 g/L, range 3.3-11.3 g/L versus median M-spike WM 6.4 g/L, range 2.2-11.9 g/L; p=0.74). Taking into account the 39 patients with monoclonal IgMκ, HLC ratio was significantly higher for patients with WM versus patients with MGUS (n=39, median HLC ratio MGUS 16.5 g/L, range 4.5-444.1 g/L versus median HLC ratio WM 33.5 g/L, range 6.6-815.0 g/L; p=0.03) (Figure 2).
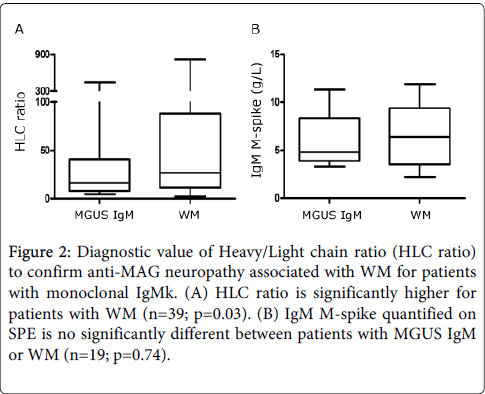
Figure 2: Diagnostic value of Heavy/Light chain ratio (HLC ratio) to confirm anti-MAG neuropathy associated with WM for patients with monoclonal IgMk. (A) HLC ratio is significantly higher for patients with WM (n=39; p=0.03). (B) IgM M-spike quantified on SPE is no significantly different between patients with MGUS IgM or WM (n=19; p=0.74).
For patients with monoclonal IgMκ, a ROC curve showed that HLC ratio using HevyliteTM assay had 89% specificity, 42% sensitivity and AUC of 0.72 to distinguish patients with WM from those with MGUS, for a cut-off HLC ratio of 60. Conversely, the IgM M-spike quantified on SPE (n=19) had 90% specificity, 22% sensitivity and AUC of 0.54, yielding a better diagnostic value of HLC ratio than that of the M-spike on SPE (Figure 3).
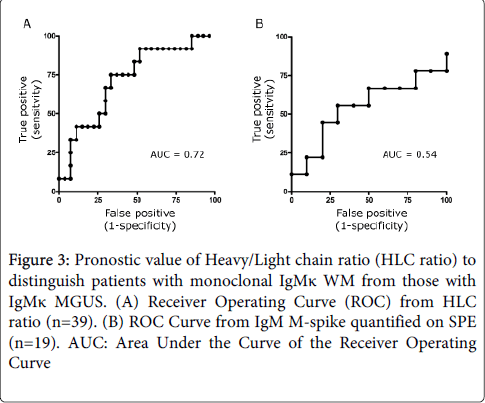
Figure 3: Pronostic value of Heavy/Light chain ratio (HLC ratio) to distinguish patients with monoclonal IgMκ WM from those with IgMκ MGUS. (A) Receiver Operating Curve (ROC) from HLC ratio (n=39). (B) ROC Curve from IgM M-spike quantified on SPE (n=19). AUC: Area Under the Curve of the Receiver Operating Curve
Prognostic value of HLC assays
Taking into account the 39 patients with monoclonal IgMκ, we found that neither HLC ratio (p=0.83) nor M-spike on SPE (p=0.74) were associated with disease course after chemotherapy. Only for patients with primarily an anti-MAG neuropathy associated with MGUS, one patient displayed normal SPE and IFE and 2 patients displayed a normal HLC ratio including the first patient and a second patient who developed a monoclonal IgGκ on SPE and IFE. In the other hand, there was a trend to variations of HLC ratios (p=0.06) within 3 distinct response groups (improved, stable, worse) (Figure 4). No significant variations of M-spike were found (p=0.13).
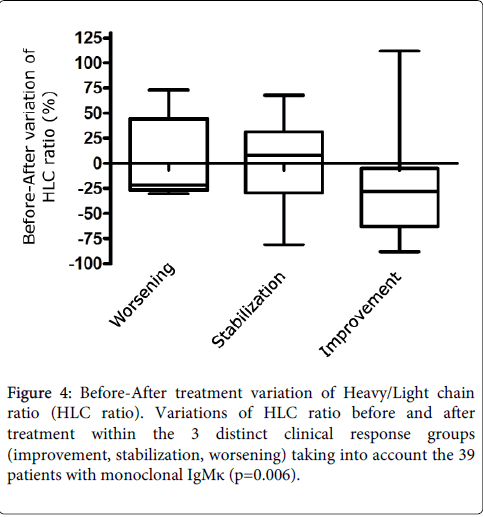
Figure 4: Before-After treatment variation of Heavy/Light chain ratio (HLC ratio). Variations of HLC ratio before and after treatment within the 3 distinct clinical response groups (improvement, stabilization, worsening) taking into account the 39 patients with monoclonal IgMκ (p=0.006).
Performance of anti-MAG antibodies
We found a moderate correlation between HLC ratio and anti-MAG activity (r=0.46; p=0.002). Among the 38 patients (86%) with clinical response, 16 (36%) had an anti-MAG activity above 70 000 BTU before and after treatment regardless M-protein and HLC ratio. Fifteen patients (34%), including 13 patients with MGUS and 2 with WM, had anti-MAG activity less than 70 000 BTU at the treatment onset and this activity was significantly lower after chemotherapy (p=0.04) (Figure 5). The 7 other patients (16%) had an anti-MAG activity greater than 70 000 BTU which did not allow reliable assessment of changes in anti-MAG activity after chemotherapy.
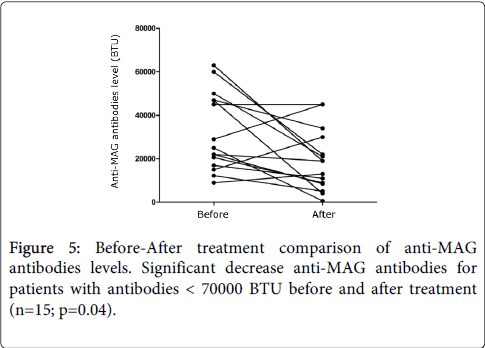
Figure 5: Before-After treatment comparison of anti-MAG antibodies levels. Significant decrease anti-MAG antibodies for patients with antibodies < 70000 BTU before and after treatment (n=15; p=0.04).
Anti-MAG neuropathy constitutes a rare distinctive clinical syndrome associated with monoclonal IgM gammopathy (MGUS or WM). Serum M-component is an important biomarker to help clinicians monitoring patients with anti-MAG neuropathy. SPE is not sensitive enough to quantify M-spike in particular in patients with IgM MGUS; which is masked by polyclonal gamma-globulins in 60% of cases. In our study, HLC ratio provided some advantages to accurately evaluate serum M-component. The measure of separately IgMκ and IgMλ using Hevylite TM is less informative, for example five patients (11%) after treatment and 1 patient (2%) before treatment had IgMκ and IgMλ in normal concentrations whereas HLC ratios were abnormal. One patient with biclonal disease (he had monoclonal IgMκ and IgMλ) displayed a HLC ratio of 0.52 showing that the clonal IgMλ is predominant. In the other hand, HLC ratio was significantly higher for patients with IgM WM than patients with IgM MGUS (p=0.03). In comparison before and after chemotherapy, there was a trend to variations of HLC ratio within the 3 clinical response groups (improved, stable, worse) but the differences were not statistically significant (p=0.06)
Many studies [15,16] mention that serum M-spike is not proportional to anti-MAG activity. ELISA assay measures circulating anti-MAG antibodies and cannot reflect the avidity of anti-MAG antibodies on tissues [7]. IgM pentameric immunoglobulins M form aggregates resulting in a lack of correlation with quantitative assay such as total IgM measurement or Hevylite™. Nevertheless, according with prior studies [17,18] we showed a decreased anti-MAG activity associated with clinical response. Yet, we were limited to rightly evaluate anti-MAG activity that was frequently above the limit of quantification. In this study, HLC ratios and anti-MAG antibodies level showed a similar degree of correlation with clinical assessments but for some patients the use of both assays might be complementary.
Our study has some limitations; we performed a retrospective design with a small sample size of patients. The assays in comparison with HLC ratios, including SPE, IFE, ELISA assay, also consist of some technical limitations. However, this work confirms that HLC ratio using HevyliteTM assay is able to distinguish patients with WM versus patients with MGUS [6]. It further provides numerical evaluation in patients with no measurable monoclonal gammopathy. Further work must be done to affirm the predictive power of the HLC ratio, and to understand the response to chemotherapy and subsequent tumor relapse rate.