Journal of Physical Chemistry & Biophysics
Open Access
ISSN: 2161-0398
ISSN: 2161-0398
Research Article - (2021)Volume 11, Issue 7
Polarimetric Synthetic Aperture Radar (PolSAR) image classification is one of the most important applications in remote sensing. In this paper, the goal is PolSAR image classification and also to introduce a method to obtain the best result for PolSAR image classification and recognition. In this article, we present the 3D-Gabor filters as a way in order to feature extraction of PolSAR images and get the best result with high accuracy for PolSAR image classification. Also, we prove that the 3D-Gabor filter approach can get higher accuracy than traditional methods for PolSAR images classification, but one of the most important challenges of 3D-Gabor filters is the number of features that are extracted from them. Therefore, by using 3D-Gabor filter we can't reach the optimal result because of the curse of dimensionality. So, to achieve the best results we propose a method to reduce the features that are extracted from 3D-Gabor filters. By using our proposed method, the features will be mapped to a new space with smaller dimensions. In the end, the experimental results indicate the superiority of the proposed method.
Classification; Polarimetric; Synthetic aperture radar; Features; Graph-based
Polarimetric Synthetic Aperture Radar (PolSAR) image classification is one of the most important applications in the remote sensing [1]. PolSAR images that are obtained by airborne and satellite sensors have a huge amount of rich information of the Earth’s surface. All of these tools need the quiet interpretation of PolSAR images [2]. Therefore, interpretation of PolSAR images is one of the most significant tools in remote sensing. During the past decade, land use classification of PolSAR images are one of the most important and challengeable researches because of PolSAR images include wealthy informatio of each target [3]. The Land Cover and Land Use (LCLU) classification can classify each kind of target to the different kinds of classes according to the definite rules. The usual targets in the PolSAR images contain buildings, urban areas, bridges, water, sand, road, vegetation, and so on. In PolSAR image classification, the features of each pixel should be extracted accurately in order to classify them accurately [4]. By developing the PolSAR image classification during the past decades, a large group of feature extraction methods has been introduced based on physical scattering mechanisms [5]. For example in [6] Tirandaz presented a PolSAR image segmentation based on feature extraction and data compression using weighted neighborhood filter bank and hidden Markov random field-expectation to extract PolSAR features. Also, in [7] B. Ren introduced a PolSAR feature extraction via tensor embedding framework for land cover classification to increase the accuracy of PolSAR image classification. In this article, by an iterative optimization process, the vector-based algorithms are gone from the tensor space in order to get the projection matrices in each mode, into a unified framework and based on the pair of matrices. In [8] Z.Wang presented a Semi-supervised tensorial locally linear embedding for feature extraction using PolSAR data for PolSAR feature extraction. In this paper, a feature extraction method is proposed to finding an optimal direction that can map features from the high-dimensional space into lower-dimensional. On the other hand, in [9] Han proposed an unsupervised classification for PolSAR images based on multilevel feature extraction to get the optimal result for PolSAR image classification. Their algorithm firstly starts with multi-level feature extraction to obtain an initial classification map. Then by using the Wishart classifier and they refine the initial classification map iteratively. Also, in [10] Zhao proposed a PolSAR image classification via D-KSVD and NSCT-domain features extraction in order to feature extraction of PolSAR images and obtain the high accuracy for PolSAR image classification.
In this paper, we propose a method in order to reduce the feature’s dimention that are extracted from 3D-Gabor filters [11]. So, at first, we use the PolSAR features that are extracted from scattering matrix of PolSAR images as the input of the 3D-Gabor filter and then we decrease the features that are obtained from 3D-Gabor filters in order to increase the accuracy of the PolSAR image classification. In our proposed method, we use a graph-based model to reduce the 3D-Gabor features. The experimental results on the real PolSAR data indicate that the classification accuracy of our proposed method is higher than other traditional methods.
The paper is formed as follows: In Section II we introduce PolSAR features extraction. In Section III the 3D-Gabor filter is presented. In Section IV, the proposed method named graph-based feature reduction is given. The experimental result is presented in Section V and also the conclusion of the paper is presented in Section VI (Table 1).
| Title of feature | Describe | Symbol | Number of feature |
|---|---|---|---|
| Raw features | Scattering matrix elements | S | 3 |
| Coherency matrix elements | T | 9 | |
| Covariance matrix elements | C | 9 | |
| Target Decomposition Features (TD) | Krogager | Krog | 9 |
| Huynen | H | 9 | |
| Barnes | B | 9 | |
| Cloude | C_1 | 9 | |
| Holm | Hol | 9 | |
| Van Zyl | V | 3 | |
| Coulde-Pottier | H/A/α | 19 | |
| Free man | Fd | 3 | |
| Yamaguchi | Y | 4 | |
| Tozi | Toz | 4 |
Table 1: Traditional PolSAR features.
Traditional polsar feature extraction
Polarimetric radars often measure the complex scattering matrix (S) produced by a target under study with the objective to infer its physical properties. Assuming linear horizontal and vertical polarizations for transmitting and receiving, S can be expressed as:
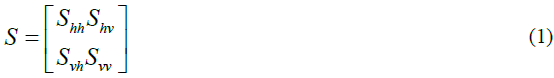
Polarimetric features of PolSAR image [1] can generally be divided into two categories: one is the features extracted directly from the polarimetric SAR data and its different transforms (the S Matrix) that is named raw features [12] and also the other is the features based on polarimetric Target Decomposition (TD) that is named TD features [13]. In order to separating and identifying contributions from different types of scatterers in PolSAR data, target decomposition techniques were proposed, which are separating target scattering matrix into independent components related to the respective scattering mechanism. Several decomposition techniques have been proposed. These techniques are based on two principal approaches known as coherent and non-coherent methods. These techniques split the scattering matrix into the sum of elementary scattering matrices, each one defining a deterministic scattering mechanism. These methods are: Huynen, Barnes, Cloude, Holm, Van Zyl, Cloude-Pottier, Freeman-Durden, Yamaguchi, Tozi and Krogager [13]. In this article, we use the extracted polarimetric features in order to evaluate our proposed method. As shown in Table 1, our extracted polarimetric feature is a 13-D vector representation of PolSAR data. The raw features are all extracted from the second-order 3 × 3 complex coherency polarimetric matrix or T and complex covariance polarimetric matrix or C, which is based on the Pauli basis of scattering matrix of PolSAR [1,14] (Table 1).
3D-gabor filter
A Gabor filter is obtained through modulating a normal (Gaussian) envelope by a sinusoidal function. For example, an illustration of a 3D Gabor filter in the radiance domain and a filter bank in the frequency domain are shown in Figure 1. A 3D Gabor filter in the spectral-spatial feature space is defined by:

Figure 1: A single 3D Gabor filter viewed with orientation (1, 0, 0) and two dimensions in the radiance domain (left) and 13 filters in three dimensions for a single scale in the frequency domain (right) [14].
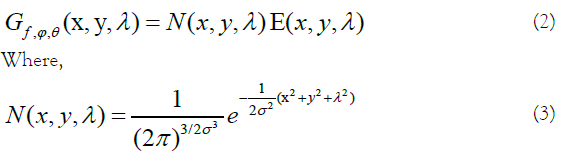
composes the Gaussian envelope component, and

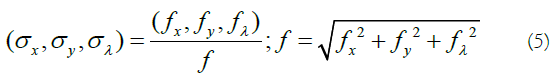
indicates the sinusoidal component. The pair (x,y) and λ are used as spatial and wavelength variables, respectively. The width of the Gaussian envelope and also the filter scale is determined by parameter σ. The frequency of component E(x, y, λ), i.e. (fx, fy, fλ), determines the central frequency of the 3D Gabor filter where it makes the orientation of the filter [15]:
The Gabor filter in radiance domain can be related to the one in the frequency domain according to the following geometry (Figure 2):

Figure 2: Illustration of θ and φ angles for 3D Gabor filter representation [14].

To have a sufficient characterization of the background and anomalous targets, a 3D Gabor filter bank containing I×J×K orientations and frequencies should be designed through a set of Gabor filters as follows [14]:
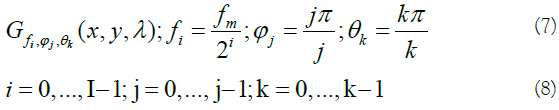
Where fiis the amplitude, ϕj , θk makes the orientation of the central frequency, and fm indicates the highest value of variable f. The half-peak orientation (B0) and radial (Br) bandwidths are defined by:
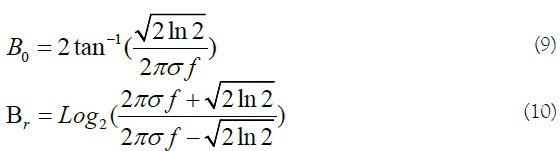
By having f and B0, the value of σ is calculated by (Figures 1 and 2):
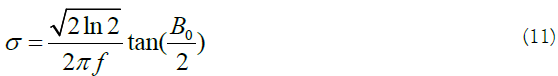
According to previous experiments [14], to provide a sufficient polarimetric-spatial characterization of PolSAR images, the parameters of 3D Gabor filter are selected as:
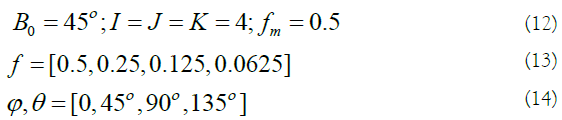
For each scale, 13 orientations are considered. Therefore, for 4
scales, a total of 4 × 13=52 Gabor filters are provided. Generally it
is assumed that the 3D Gabor filter is designed for applying to a R
× C × B cube with R=C=B. But, in practice, for a PolSAR image,
a region of PolSAR cube with R rows and C columns (R=C) has B
polarimetric bands where B≫R, C. Thus, the Gabor filter should be modified by substituting 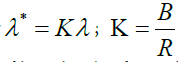 in equations 1-3 to provide stretching Gabor filters by the factor k along direction
λ . The output of each Gabor filter is a cube with the same size of
PolSAR image [14].
in equations 1-3 to provide stretching Gabor filters by the factor k along direction
λ . The output of each Gabor filter is a cube with the same size of
PolSAR image [14].
The goal of this paper is to reduce the polarimetric-spatial of PolSAR features that are extracted from 3D-Gabor Filters. In order to reduce features, we use a Graph-Based (GB) method that will be introduced in the following [15]. As we said in the previous section, 3D-Gabor Filter is one the most important methods that can extract features of PolSAR images more accurately than traditional methods such as [16,17]. But one of the most important and difficult challenges of these kinds of filters is the number of extracted features. The number of features that are extracted from 3D-Gabor filters is much more than traditional methods. On the other hand, if we use all of these extracted features to classify targets, it cannot obtain us the best result because of the curse of dimensionality phenomena [18]. So, in this article, we introduce a graph-based method in order to decrease the features that are extracted from 3D-Gabor filters. In the following, we present our dimension reduction method with details.
Proposed dimension reduction method
In this section, we introduce a Graph-Based (GB) method (Figure 3)
to reduce the features that are obtained from 3D-Gabor filters. We can suppose that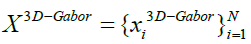 indicates 3D-Gabor features after normalizing their values to the same interval ([0, 1]), where
 with B the number of features and also N is the total number of pixels in a SAR image. So, the aim of
this article is to obtain a transformation matrix
with B the number of features and also N is the total number of pixels in a SAR image. So, the aim of
this article is to obtain a transformation matrix  that
can decrease the 3D-Gabor features (to d-dimensions) by the below equation:
that
can decrease the 3D-Gabor features (to d-dimensions) by the below equation:

Figure 3: Proposed method.

 is a 3D-Gabor feature of each pixel of SAR images and
 is the feature in a lower dimensional space with
 that d ≤ (B). On the other hand, not only the transformation matrix
W has to reduce different features in a lower-dimensional space
but also it has to protect the local neighbourhood information.
A suitable method to find the transformation matrix W can be
obtained as below (you can find the detail of this way in [19]):
that d ≤ (B). On the other hand, not only the transformation matrix
W has to reduce different features in a lower-dimensional space
but also it has to protect the local neighbourhood information.
A suitable method to find the transformation matrix W can be
obtained as below (you can find the detail of this way in [19]):
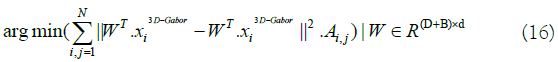
In equation 16 the matrix A denotes the edges of an undirected
graph G=(X, A). Therefore, it is s so important to design the matrix
A as well as it is possible. In this paper, we propose a method to
design the matrix A. The adjacency relation between each node of
the graph such as xi and xj is represented by binary edge weights  In our proposed method, the two data points xi and xj are connected with each other in graph nodes if they are “close” to each other in terms of some distance. So, Aij = 1 if xi and xj are “close” to each other and Aij = 0 if xi and xj are “far apart” to each other. In this article, the graph will be designed by the proposed
method. So, in the following, we present our method to design the
graph accurately. First of all, the features that are extracted from
3D-Gabor will be classified by a classification method, and next a
classification map for PolSAR images will be obtained that is named
initial class-map. Then, for each pixel, a graph will be designed by
the initial class map accurately. In our designed graph (Figure 4),
each pixel has a connection with other pixels if and only if both of
them are in a specific class. So, if both pixels are classmates with each
other a connection between them will be made in our proposed graph. The matrix
In our proposed method, the two data points xi and xj are connected with each other in graph nodes if they are “close” to each other in terms of some distance. So, Aij = 1 if xi and xj are “close” to each other and Aij = 0 if xi and xj are “far apart” to each other. In this article, the graph will be designed by the proposed
method. So, in the following, we present our method to design the
graph accurately. First of all, the features that are extracted from
3D-Gabor will be classified by a classification method, and next a
classification map for PolSAR images will be obtained that is named
initial class-map. Then, for each pixel, a graph will be designed by
the initial class map accurately. In our designed graph (Figure 4),
each pixel has a connection with other pixels if and only if both of
them are in a specific class. So, if both pixels are classmates with each
other a connection between them will be made in our proposed graph. The matrix  denotes the adjacency relation of
all pixels in the PolSAR images (e.g., full edge) that are made on the 3D-Gabor features
denotes the adjacency relation of
all pixels in the PolSAR images (e.g., full edge) that are made on the 3D-Gabor features

Figure 4: The graph that is designed by the proposed method. Each colour represents a specific class that graph edges are created between them. White colour means un-label pixels.
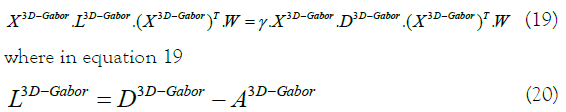
By utilizing [20] for solving the equation 16, we have:

In equation 17  is a diagonal matrix with
 and also I is the identity matrix.
So, by using the transformation matrix:

We can get r eigenvectors with the least r eigenvalues from equation  by use the generalized eigenvalue problem:
specific class that graph edges are created between them. White colour means un-label pixels.
That  is the fusion Laplacian matrix which is proposed
in [19]. In the end, the new features can be obtained from the high dimensional 3D-Gabor features
is the fusion Laplacian matrix which is proposed
in [19]. In the end, the new features can be obtained from the high dimensional 3D-Gabor features into a
lower and new dimensional space that is named
into a
lower and new dimensional space that is named  by the equation 15. So by using 15, the new features (Z) in the lower and
new dimensional subspace can be extracted. Therefore, we can use
Z as an input in order to classify PolSAR images. The details in can
be fined in [19].
by the equation 15. So by using 15, the new features (Z) in the lower and
new dimensional subspace can be extracted. Therefore, we can use
Z as an input in order to classify PolSAR images. The details in can
be fined in [19].
Experimental results
In this section, the data that is used in the article, the simulation, and experimental results will be presented.
Experimental data: Figure 5 shows the employed experimental PolSAR images. The image is for the Flevoland area in The Netherlands, which was acquired by NASA/JPL AIRSAR on August 16, 1989. The size of the image is 750 × 1024. The Pauli RGB image of Flevoland area data is shown in Figure 5a and the ground-truth class labels and the corresponding color codes are shown in Figure 5b. There are 11 different classes in the image, including: water, peas, stem bean, beet, forest, bare soil, grass, rapeseed, Lucerne, wheat, potato that is introduced. Also, Table 2 shows the names and total samples of each class for the Flevoland dataset.
| No | Name of class |
|---|---|
| 1 | Beet |
| 2 | Lucerne |
| 3 | Soil |
| 4 | Rapeseed |
| 5 | Steam bean |
| 6 | Potato |
| 7 | Water |
| 8 | Grass |
| 9 | Peas |
| 10 | Wheat |
| 11 | Forest |
Table 2: The names and total samples of each class for the Flevoland dataset.

Figure 5: (a) Pauli RGB image of Flevoland area. (b) Ground-truth class labels of Flevoland area (GTM) [24].
Experimental setup: In all of the experiments 3D-Gabor filters parameters will be chosen from Table 3. Also, we selected 21 as a filter size of the 3D-Gabor filters. On the other hand, SVM classifier will be used as the classifier in order to simulate our method. The classification results are compared by measuring the Overall Accuracy (OA) [21] and the kappa coefficient (κ) [22]. In addition, the analyses were computed on 64-bit, 1.40 GHz Intel i7- 9300 K (10 core) CPU computer with 32 GB memory.
| Parameters | Values | |||
|---|---|---|---|---|
| Ɵ | 0 | 45 | 90 | 135 |
| ɸ | 0 | 45 | 90 | 135 |
| F | 0.5 | 0.25 | 0.125 | 0.625 |
Table 3: Parameters for 3D-gabor.
In order to simulate the proposed method, we use the support vector machine (SVM) that is implemented by LIBSVM [23], for the classification of PolSAR datasets. The second-order polynomial kernel is utilized for SVM. In all of the simulations, we use the PolSAR features that are described in section II. Also, at first we use scattering matrix features (S Matrix) as the input of the 3D-Gabor filter in order to extract 3D-Gabor features. As it mentioned in section III, 3D-Gabor filters are one of the most important and newest methods in order to extract polarimetric-spatial features from images. By using these filters we can obtain a lot of high level features with a huge amount of details from PolSAR images, but it has a significant challenge as we presented in the previous section [24]. Therefore, in order to solve this issue, we proposed a Graph Base (GB) method to decrease the 3D-Gabor features and increase the accuracy of the PolSAR image classification and recognition. In all of the experiments, 5% of the samples of each class were selected randomly as the training samples and also the other 95% were utilized as the test samples. Also, to get the best result and validate all of the results, all experiments will be displayed in Tables 4 and 5 after 10 times of run and averaging of them. In these tables Nf expresses the number of features. Also, you can see all the PolSAR features that are used in experiments in Table 1. In addition, the abbreviation S, T, C in all these tables denotes full scattering, coherence, and covariance matrix parameters which are obtained from SAR [25-27]. Finally, the overall accuracy and kappa coefficient for the proposed method and other methods will be expressed in Table 4. In order to illustrate the superiority of the proposed method, in Table 4, we compared our proposed method with the 3D-Gabor method and other traditional method that are described in section II. It can be seen from Table 4 that the proposed method with an accuracy of 97.2 has higher accuracy than the 3D-Gabor method with an accuracy of 95.8. Also, the kappa coefficient of the proposed method has superiority over the 3D-Gabor method. As mentioned, using the 3D-Gabor method has led to increasing the classification accuracy because by using this method we can get appropriate features from PolSAR images, but because of the curse of dimensionality that is mentioned in the past section, it cannot get us the best result [28,29]. So, we got the best result of the classification of PolSAR images, by reducing these features with the proposed method. In addition, as you can see in Table 4, the rank of these methods from a classification accuracy point of view as follows: S>T>C, if we utilize T, C or S individually, but the overall accuracy of 3D-Gabor is higher than them. Also, if we use TD features individually, the rank of these methods from a classification accuracy point of view as follows: Hol>C1>H+a+α>B>Krog>Toz>Y>Fd>V but, the overall accuracy of Stack TD is higher than TD features method. On the other hand, it is higher than for "stack" compared to "Stack TD or Stack Raw" features. Also, as can be shown, our proposed method is superior to other methods in both kappa coefficient and overall accuracy [30]. Also, Figure 6 shows the classification accuracy for different Classes by the proposed method. This figure illustrates that the classification accuracy for all of the classes is more than 96% except for of the stream bean class that the accuracy of this class is 95.14%. Also, the highest accuracy is 98.15% for the water class. The average accuracy is 97.2% that is more than 3D-Gabor method and other traditional methods as it can be seen in Table 4. On the other hand, Figure 7 denotes the kappa coefficient for different classes by the proposed method. As it can be seen in Figure 7 the lowest coefficient is for the steam bean class and the highest coefficient is for the water class. The highest coefficient is 0.9805 and also the lowest is 0.9534. Also, the coefficient for all of the classes is more than 0.96 except for the steam bean class.
| Features | Method | Nf | Overall accuracy | Kappa coefficient |
|---|---|---|---|---|
| Raw | T | 9 | 84.15 | 0.856 |
| C | 9 | 83.56 | 0.846 | |
| S | 3 | 86.49 | 0.85 | |
| Stack raw | T+C+S | 21 | 87.15 | 0.881 |
| TD | Krog | 9 | 88.15 | 0.886 |
| h | 9 | 87.54 | 0.889 | |
| B | 9 | 89.48 | 0.894 | |
| C1 | 9 | 89.59 | 0.909 | |
| Hol | 9 | 89.78 | 0.901 | |
| V | 3 | 80.78 | 0.813 | |
| H+a+α | 19 | 89.49 | 0.889 | |
| Fd | 3 | 83.14 | 0.84 | |
| Y | 4 | 84.92 | 0.835 | |
| Toz | 4 | 87.69 | 0.89 | |
| Stack TD | Krog+h+B+C1+Hol+V+H+a+α+Fd+Y+Toz | 78 | 90.18 | 0.902 |
| Stack | T+C+S+ Krog+h+B+C1+Hol+V+H+a+α+Fd+Y+Toz | 99 | 93.31 | 0.941 |
| 3D-gabor Filters | 3D-Gabor features | 156 | 95.8 | 0.957 |
| Proposed | Proposed method | 40 | 97.23 | 0.971 |
Table 4: Simulation results using SVM classifier.
| Methods | Proposed | 3D-Gabor | S | Stack raw | T | C |
|---|---|---|---|---|---|---|
| Proposed | 0 | 19.65 | 90.12 | 63.1 | 118.74 | 158 |
| 3D-gabor | -19.65 | 0 | 57.99 | 48.79 | 59.92 | 80.58 |
| Stack | -32.21 | -35.39 | 48.52 | 39.31 | 50.44 | 71.11 |
| Stack TD | -54.62 | -46.72 | 34.66 | 25.45 | 36.58 | 57.25 |
| S | -90.12 | -57.99 | 0 | 9.52 | 20.65 | 41.32 |
| Stack raw | -63.1 | -48.79 | -9.52 | 0 | 3.39 | 12.46 |
| T | -118.74 | -59.92 | -20.65 | -3.39 | 0 | 9.09 |
| C | -158 | -80.58 | -41.32 | -12.46 | -9.09 | 0 |
Table 5: The result of McNemars test.

Figure 6: The classification accuracy for different classes of the proposed method.

Figure 7: The Kappa coefficient for different classes of the proposed method.
In addition, Figure 8 illustrates the average accuracy of the proposed method compared with other methods. As you can see in this Figure 9, the average accuracy of the proposed method is higher than other methods. On the other hand, to assess whether the differences between classification results are statistically significant or not, the McNemars test is done and the results are reported in Table 5 for both datasets. As seen, the proposed method is preferred with respect to others with a significant difference. After the proposed method, 3D-Gabor method and Stack method can be good candidates for PolSAR image classification [31-33].

Figure 8: The average accuracy for the proposed method compared with others.

Figure 9: Overall accuracy for different methods.
Visual comparison
We also make a visual comparison between different classification methods in the form of classification maps, as shown in Figure 10. In general, traditional classification methods (e.g., raw features and TD features) result in salt and pepper noise in the classification maps. As expected, the proposed methods obtain smoother and more detailed maps in comparison with other competitors, mainly due to the effective combination of different features that further enhance the PolSAR representation ability. Finally, the classification map of the proposed method and other methods in can be seen in Figure 10.

Figure 10: Classification maps for the proposed method and others.
The aim of this paper is PolSAR image classification and also presents a method to reach the best result for PolSAR image classification and recognition. In this paper, we introduced 3D-Gabor filters as a method for feature extraction of PolSAR images. As can be seen in the table, by using 3D-Gabor filters we can reach high accuracy for PolSAR images classification compare to traditional methods, but because of the curse of dimensionality we cannot reach the best result by using these filters. So, we introduced a graph-based method to reduce the 3D-Gabor features and get the best accuracy of them in order to PolSAR image classification. Therefore, by using the proposed method the extracted features from 3D-Gabor filters were mapped to a new space with smaller dimensions. In the end, the simulation and experimental results for the proposed graph-based method indicate its advantages in both the kappa coefficient and overall accuracy in competition with the 3D-Gabor filters and traditional methods.
Citation: Darvishnezhad M (2021) Graph-Based Feature Reduction for Three-Dimensional Gabor Filter in PolSAR Image Classification. J Phys Chem Biophys. 11:315.
Received: 25-Nov-2012 Accepted: 09-Dec-2012 Published: 16-Dec-2021
Copyright: © 2021 Darvishnezhad M. This is an open-access article distributed under the terms of the Creative Commons Attribution License, which permits unrestricted use, distribution, and reproduction in any medium, provided the original author and source are credited.