Journal of Clinical Trials
Open Access
ISSN: 2167-0870
ISSN: 2167-0870
Research Article - (2021)
Finding genes biologically directly or indirectly related to lung cancer has been drawing much attention, and many genes directly related to lung cancer have been reported. However, it has not been confirmed whether those published 'key' genes are truly critical to lung cancer formation, i.e., they may be with very limited useful information. As a result, finding essential genes remains a challenging lung cancer research problem. Using a recently developed competing linear factor analysis method in differentially expressed gene detection, we advance the study of lung cancer critical genes detection to a uniformly informative level. A set of common four genes and their functional effects are detected to be differentially expressed in tumor and non- tumor samples with 100% sensitivity and 100% specificity in one study of lung adenocarcinoma (LUAD) and one study of squamous cell lung cancers (LUSC) (two North American cohorts with 20429 genes, 576 and 552 samples respectively). Two additional analyses also gain accuracy of 97.8% sensitivity and 100% specificity in one study of non-small cell lung carcinomas (NSCLC, a European cohort with 20356 genes and 156 samples), and an accuracy of 100% sensitivity and 95% specificity (1 out of 20 non-tumor samples) in one study of ALK-positive and EGFR/KRAS/ALK-negative lung adenocarcinomas (LUAD, a Japanese cohort with 20356 genes and 224 samples). There are some common genes, but different functional effects, within each set of four genes among two North American cohorts and a European cohort and among North American cohorts and the Japanese cohort. These results show the four-gene-based classifiers are robust with different types of lung cancers and different race cohorts and accurate. The functional effects of four genes disclose significantly other mechanisms (mysteries) between LUAD and LUSC. These sets of four genes and their functional effects are considered to be essential for lung cancer studies and practice. These genes' functional effects naturally classify patients into different groups (more than seven subtypes). Subtype information is useful for personalized therapies. The new findings can motivate new lung cancer research in more focused and targeted directions to save lives, protect people, and reduce enormous economic costs in research and lung cancer treatments.
Direct gene effects; Indirect gene effects; Lung cancer detection; Gene-gene interaction; Competing risks
WHO reported that the most common causes of cancer death in 2020 were: lung (1.80 million deaths); colon and rectum (935,000 deaths); liver (830,000 deaths); stomach (769,000 deaths); and breast (685,000 deaths). Lung cancer is the third most common cancer in the United States. More people in the United States die from lung cancer than any other type of cancer (CDC statistics). Lung cancer accounted for the most significant loss of wages at $21.3 billion among all cancers [1]. However, the exact environmental and genetic cause of a person’s lung cancer is still unknown, and its formation may be described as when mutated cells in the lungs escape the immune system and grow out of control, a tumor is formed in the lung. Although many lung cancer research results have been published, the actual scientific research progress in lung cancer studies is still limited. Many unknown factors exist. The Lancet Editorial [2] stated: Lung cancer: some progress, but still a lot more to do. Finding critical unknown factors can be essential to conquer the lung cancer plague. From a genetic level perspective, there is an urgent need for identifying critical differentially expressed genes (DEGs) with the highest possible sensitivity and specificity for lung cancer detection.
Differential expression analysis between tumor and non-tumor cells helps lung cancer diagnostic classifications and prognosis prediction at different stages. Efforts have been made in identifying genes associated with lung cancer symptoms. For lung cancer diagnostic classifications, [3] used support vector machine learning algorithms to perform lung cancer morphology classification; [4] developed a deep gene selection method to select genes from microarray datasets for cancer classification. Their experimental results showed that an average sensitivity of 95.22% and an average specificity of 77.39% [5] used several machine learning algorithms to study lung adenocarcinoma and lung squamous cell cancer and identified 13 top genes [6] used least absolute shrinkage and selection operator (LASSO) as feature selection method to learn cancer type classification based on TCGA data. Chen and Dhahbi [7] applied overlapping feature selection methods for cancer classification and biomarker identification [8] created an open access web resource the Lung Cancer Explorer (LCE), which enables researchers and clinicians to explore data and perform analyses. The LCE supports comparative analysis, survival analysis, meta-analysis, correlation analysis, among others. The data used in our study are downloaded from the LCE website and double verified with the original data sources. In comprehensive molecular profiling of lung adenocarcinoma (LUAD) [9], eighteen genes were found statistically significantly mutated, which suggests a driver role of LUAD. Earlier, Cancer Genome Atlas Research Network [10] reported eighteen genes with statistically recurrent mutations, and TP53 was found being mutated in almost all samples, in a comprehensive genomic characterization of squamous cell lung cancers (SqCC or LUSC). In addition, the authors also identified a potential therapeutic target and offered new avenues of investigation for lung SqCC treatment. In their study of triple- negative lung adenocarcinomas [11] stated that many tumors lack activation of any pathway, posing difficulties for prognosis and treatment. For ALK-Positive and EGFR/KRAS/ALK-Negative LUAD, the authors were able to identify upregulated genes, which can possibly benefit patients from adjuvant chemotherapy after surgical resection. Using expression signatures of 139 gefitinib-sensitive genes in lung cancer, a risk-scoring model was constructed to classify high or low-risk patients [12,13] found that the clinical therapy of non-small cell lung cancer (NSCLC) depends on histopathological classification (HPC). On the one hand, the HPC approach poorly predicts clinical outcomes for individual patients. On the other hand, gene expression profiling holds promise to improve clinical stratification and paves the way for individualized therapy [14] used a nomogram model to identify six key genes which were combined with various clinical features. The nomogram model led to high consistency for the prediction of 3 and 5-year survival rate (concordance=0.751) and high accuracy as tested by ROC (AUC=0.71; AUC=0.708). Using bioinformatics analysis [15], identified four genes (CCNA2, AURKA, AURKB, and FEN1) linked to LUSC development, and five genes were all detrimental to the prognosis. The AUCs of their established prognostic model for predicting patients’ survival at 1, 3, and 5 years were 0.692, 0.722, and 0.651 in the test data, respectively [16] reported fifty genes that may be associated with CD44, CCND3, NCALD, and MACF1 and suggested that miR-296-5p, RAMP2- AS1, CD44, CCND3, NCALD, and MACF1 may serve as potential reliable biomarkers for the detection of LUAD.
The published genes from various research trials do not share common features, and they vary from trial to trial in lung cancer researches and treatments, e.g., survival analysis. Those genes can be thought to have direct relations to lung cancer and point out some promising directions. But it is still unclear whether or not truly the keys to deciding the characteristics which the trials were designed to find. In science, an inferior or wrong methodology/model may lead to wrong or suboptimal conclusions. Given that the number of human genes is ultra-large and many genes are highly correlated with each other, statistical significance in many existing models can be false. On the other hand, published results seldom presented the highest possible sensitivity and specificity, i.e., close to 100%. In addition, many gene-related classifiers and models are not interpretable as gene-gene inter-relationships are hardly expressed. Most importantly, many existing analysis methods (biological and/or statistical) cannot differentiate gene-disease subtype inter- relationships. As a result, conclusive statements cannot be reached.
Like many other cancer studies, the scientific research progress in solving the puzzle of lung cancer formations is still limited. Much literature attention has been focused on individual genes and their expression levels, i.e., not gene-gene interactions, genes-subtypes (of lung cancers) interactions, and functional effects. As a result, the fundamental genetic causes of lung cancer formations can be masked by those suboptimal focuses, and the researches can still be in a primitive state. Many unknown gene- gene interaction factors exist. The gene-gene interactions can be essential to conquer the lung cancer formations with the highest possible sensitivity and specificity. This work intends to unfold the mysteries and directions of lung cancers by identifying four critical genes and their functional effects that lead to the full detecting power of lung cancer tumor samples and non-tumor samples in four gene expression RNA-seq datasets. Based on our analysis, a set of four genes and their functional effects can describe the overall features of lung cancers at the genomic level, with the highest possible sensitivity of 100% and specificity of 100%. They show clear patterns in all four cohorts. There are common genes with different functional effects that interact with other genes within each main type of lung cancer (LUAD, LUSC, NSCLC, etc.) and play a decisive role among different main types of lung cancers. Such properties have never been reported in the literature. It is clear that they offer the findings’ trustfulness and provide keys to tackle the puzzle of lung cancers and lead to precision medicine.
The algorithm
The classifiers, based on logistic regression models, random forests, support vector machines, group lasso-based models, deep learning methods, etc., have been widely used in lung cancer studies and many other studies in almost all application areas. However, these methods do not directly deal with competing risks. The final established classifiers do not give clear patterns of how genes interact with each other and interact with subtypes. This research is motivated by recent work on COVID-19 data science discovery of five critical genes that 100% accurately classify all COVID-19 samples and COVID-19 free samples [17]. Those five critical genes include an mRNA type gene and an uncharacterized gene, which can be informative. This research also hopes to find critical genes which can be drivers and messengers of lung cancer formation.
The most recently developed machine learning methods: max- linear competing factor models [18], max-linear regression models [19], and max-linear logistic models [20,17], have proven to be a widely applicable class of new models in statistical analysis and max-linear machine learning. The difference between the max- linear competing models and the classical statistical models is that the original linear combination of predictors is replaced by the maximum of several linear combinations of predictors, called competing factors or competing-risk factors. The competing factor classifier has an advantage over existing models in many research problems, e.g., nonlinear predictions and classifications. The max- linear competing factor models are different from the popular models mentioned earlier. The max-linear competing factor models are interpretable and outperform existing methods (e.g., random forest and graphical group lasso) in estimation accuracy and prediction power under broad data structures [19]. For the theoretical foundation of these new models, we refer the readers to papers [18-23].
Zhang first introduces a competing classifier for detecting COVID-19 critical genes and subtypes [17]. The paper argues conceptually the classifier can find the best subset of genes which can perfectly classify COVID-19 diseases and disease free. This new paper introduces a modified objective function, i.e., new classifier, and then theoretically justify the classifier will select the smallest number genes which can perfectly classify lung cancer tumors and tumor free with the highest accuracy possible and for some cohort studies to be the perfect classification (100% sensitivity and 100% specificity). For self-contained and completeness, we will follow the notations in [17] and expand them to the new classifier next.
Suppose (Yi, Xi), i=1, . . . , n, are the characteristics of n persons with Yi corresponding to the ith individual’ infected status (Yi=0 or 2 for not infected, Yi=1 for infected) and Xi=(Xi1, Xi2, . . . , Xip) being the gene expression values with p=20429 or 20356 genes in this study. Using a logit link (or probit link, Gumbel link), we can not model the risk probability pi of the ith person’s infection status as: 
or alternatively, we write
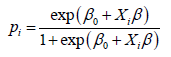
where β0 is an intercept, Xi is a 1 × p observed vector, and β is a p × 1 coefficient vector which characterizes the contribution of each predictor (gene in this study) to the risk.
There are at least three major problems applying the classical logistic classifier (1) to disease classifications [17]. The first is that the number of genes selected is still not small. As a result, gene- gene interactions and functional effects can hardly be interpretable, and hence the selected genes cannot be directly used in drug development and treatment design. The second is that the classical logistic classifier cannot provide additional information about how genes interact with different disease subtypes. Considering COVID-19 as an example, there have been four more variants (B.1.1.7, B.1351, P.1 and B.147/429) having been discovered and are spreading in many countries. These variants correspond to different RNA segments and positions in COVID-19 RNA sequences. As a result, each variant's related genes can be in different formation (combination) types. The third is that even with a relative non-small number of genes in the classical logistic classifier, the accuracy is not high enough, often just 80%.
There is one crucial factor, competing (risk) factors, that has not been considered in many existing statistical models, i.e., the existing classifiers do not distinguish the causes and the subtypes of the disease. In scientific studies, competing factors exist in many scenarios [21]. The cause/regulation of each subtype of the disease can be different, i.e., each subtype of the disease can result from one factor or multiple factors. For example, in a system, e.g., a human body, all parts compete for resources to succeed. In terms of diseases (rare or non-rare), all subtype diseases also compete for resources. The dominant one wins all and will be diagnosed first. This study considers competing factors to be linear combinations of a set of predictors in [17].
Suppose a disease (e.g., a type of lung cancer) may be related to G groups of genes

where i is the ith individual in the sample, gj is the number of genes in jth group. The competing (risk) factor classifier is defined as

where β0j’s are intercepts, Φij is a 1 × gj observed vector, βj is a gj × 1 coefficient vector which characterizes the contribution of each predictor in the jth group to the risk.
Remark 1. Taking β0j=−∞, j=2, . . . , G, (3) is reduced to the classical logistic regression, i.e., the classical logistic regression is a special case of the new classifier. Compared with black box machine learning methods (e.g., random forest, deep learning (convolution) neural network (DNN, CNN)) and regression tree methods, (3) shows clear patterns. Each competing risk factor forms a signature with the selected genes. The number of factors corresponds to the number of signatures, i.e., G. This model can be regarded as a bridge between linear models and more advanced (black box) machine learning methods. However, (3) remains the desired properties of interpretability, computability, predictability, and stability.
In practice, we have to choose a threshold probability value to decide a patient’s class label. Following the general trend in the literature, we set the threshold to be 0.5. As such, if Pi ≤ 0.5, the ith individual is classified as disease free, otherwise the individual is classified to have the disease.
With the above established notations, we introduce a new machine learning classifier, smallest subset and smallest number of signatures (S4), as:
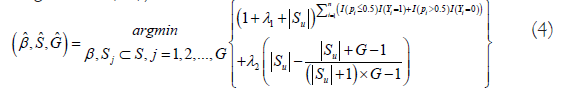
where I(.) is an indicative function, Pi is defined in Equation (3), S={1, 2, . . . , 20429} is the index set of all genes, Sj={jj1, . . . , jj,gj }, j=1, . . . , G are index sets corresponding to (2), Su is the union of {Sj, j=1, . . . , G}, |Su| is the number of elements in Su, λ1 ≥ 0 and λ2 ≥ 0 are penalty parameters, and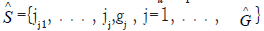 and
and  are the final gene set selected in the final classifiers and the number of final signatures.
Remark 2. The case of λ2=0 corresponds to the classifier introduced in [17].
Remark 3. A perfect classifier (100% sensitivity and 100% specificity) will have

in Equation (4), which is the case in our study.
The goal is to find clear lung cancer formation patterns, i.e., functional effect patterns, by selecting a sparse (single digit) number of genes with the highest performance.
We note that the optimization procedure in Equation (4) is different from existing approaches, e.g., likelihood method and composite likelihood. takes integer values 0,1,2,. . . ,n with 0 being the best and n being the worst. We have the following proposition which theoretically justifies the new S4 classifier leads to the best gene subset selection (with the smallest number of genes) and the smallest number G of competing factors.
Proposition 2.1. Suppose the smallest number that can reach is m. Then for suitable choices of λ1 with λ1 +|Su|>0 and λ2 ≥ 0, the new classifier S4 will lead to the smallest |c of G such that .
 Proof. Denote
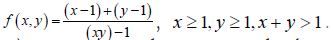 It can be shown that f (x, y) is monotone decreasing in both x and y, and 0<f (x, y) ≤ 1. For its usage and applications , we refer readers to [24]. Denote
For m=0 and any choice of λ1, we have A=1, and then the leading term of (4) is |Su|, which will force |Su| to reach its smallest possible number for any λ2>0. Once the |Su| is determine, f (|Su| + 1, G) will force G to be its smallest number.
For m>0 and λ1+|Su|>0, A is the leading term of (4) for suitable choices of λ2. As a result, A will force |Su| to reach its smallest possible number, and so does G. The proof is then completed.
The optimization problem (4) is a combination of combinatorial optimization and continuous variable optimization. As a result, its algorithm complexity is extremely high. To completely solve the problem will need to bring efforts from computer science, mathematical programming, and computational mathematics. We leave this task as a future project. In this study, we directly work on minimizing  by taking |Su| from 2 to 5 and G from 1 to 4, and identify the best solution which satisfies Proposition 2.1. The following algorithm is implemented.
• Randomly draw G sets of genes with each set having |Su| genes;
• Use any optimization procedures (e.g., Nelder–Mead method, genetic algorithm, simulated annealing) to solve minimizing 
• Repeat the above two steps until an acceptable solution is reached.
Remark 4. We have done an extensive Monte Carlo search to find our final competing classifier. A MATLAB® demo code for solving minimizing is available online and submitted as a supplementary file together with the paper. However, we have experienced quite a few times man-machine interactions to reduce the dimension s from 20429 to Su. As such, we don’t have a well-documented algorithm for solving minimizing
 It will be a future project as it is an algorithm problem, i.e., not a methodological problem. As the number of genes is big, the first step may not be efficient. Dimension reduction can be helpful. In our man-machine interactions, to train our program, we first allowed the loss function to take a value around 10% of error rate. We recorded some sets of genes that performed better than other sets of genes, and to form a new set of genes, then repeated the above procedure to get the final classifier. We were able to find an optimal solution to have a loss function taking the value zero. The dimension reduction procedure we used is ad hoc. Other dimension reduction procedures may be useful and worthy of further investigation. Note this remark is similar to Remark 6 in [17]. Please note the method in [17] does not supply theoretical justification and does not involve penalizations.
Remark 5. Given that we used Monte Carlo method in this study, we have set a seed number (just the day we started the project) in our MATLAB programs. The seed number can help, but not sure for final results as we had quite a few steps man-machine interactions, i.e., the seed number might not have an effect. Note this remark is similar to Remark 7 in [17].
Remark 6. Given the objective function in Equation (4) is heavily flat (taking integer values), non-smooth, and non-convex, there may be multiple optimal solutions that exist. Our final solution is a global optimal. We have obtained some different sets of estimated coefficients, but the conclusions remain the same. Note this remark is similar to Remark 8 in [17].
There are four datasets used in this study.
The first dataset cohort is comprehensive molecular profiling of lung adenocarcinoma (LUAD) by Nature publication [9]. The dataset contains 576 samples (517 tumor samples, 59 normal samples). The data are author-processed-renormalized.
The second dataset cohort is a comprehensive genomic characterization of squamous cell lung cancers (LUSC) by Nature publication [10]. The dataset contains 552 samples (501 tumor samples, 51 normal samples). The data are author-processed- renormalized.
The third dataset is a European cohort on a gene expression-based classification of non-small cell lung carcinomas (NSCLC) and survival prediction [13]. The dataset contains 156 samples (91 tumor samples, 65 normal samples). The Platforms are GPL570 [HG-U133 Plus 2] Affymetrix Human Genome U133 Plus 2.0 Array. The data is RMA normalized.
The fourth dataset is a Japanese cohort studying the identification of genes upregulated in ALK-positive and EGFR/KRAS/ALK- negative lung adenocarcinomas (LUAD) [11].
The study’s overall design is expression profiles in 226 lung adenocarcinomas (127 with EGFR mutation, 20 with KRAS mutation, 11 with EML4- ALK fusion, and 68 triple-negative cases). The actual dataset contains 224 samples (204 tumor samples and 20 normal samples). Platforms are GPL570 [HG-U133 plus 2] Affymetrix Human Genome U133 plus 2.0 Array. The expression values are MAS5- normalized signal intensity.
Using a probability higher than 50% as the threshold, we identify four critical DEGs: NLRC4 (NLR Family CARD Domain Containing 4), PLEKHN1 (Pleckstrin Homology Domain Containing N1), RASIP1 (Ras Interacting Protein 1), and SPP1 (Secreted Phosphoprotein 1), which lead to 100% sensitivity and 100% specificity of classifying all 576 samples in their respective groups in the first dataset, 100% sensitivity and 100% specificity of classifying all 552 samples in their respective groups in the second dataset; four critical DEGs: SPP1, GPT2 (Glutamic–Pyruvic Transaminase 2), FAM220A (Family With Sequence Similarity 220 Member A), and SGPL1 (Sphingosine-1-Phosphate Lyase 1), which lead to a sensitivity of 97.8% and a specificity of 100% of classifying all 156 samples in their respective groups in the third dataset; and four critical DEGs: NLRC4, PLEKHN1, PCOLCE2 (Procollagen C-Endopeptidase Enhancer 2), and GABPB1-IT1 (RNA Gene, GABPB1 Intronic Transcript), which result in a 100% sensitivity and a 95% specificity of classifying 224 samples in their respective groups in the fourth dataset. As these genes have not been reported in the lung cancer literature of their direct relationship to lung cancer, we consider them indirectly related to lung cancer. Our final S4 classifiers are combined classifiers of three competing factor (CFi, i=1,2,3) classifiers expressed as in Table 1.
| For the first dataset (LUAD, North American Cohort) | |||||
| Data-1-CF2: | 1.8889 | -4.3417 × NLRC4 | +6.7773 × PLEKHN1 | +4.8279 × SPP1 | |
| Data-1-CFmax: = Data-1-CF2 | |||||
| For the second dataset (LUSC, North American Cohort) | |||||
| Data-2-CF1: | 1.0848 | -3.2488 × NLRC4 | +2.4380 × PLEKHN1 | +0.8220 × SPP1 | |
| Data-2-CF3: | 0.5651 | +0.4889 × PLEKHN1 | -4.8959 × RASIP1 | +1.9672 × SPP1 | |
| Data-2-CF2: | -0.9999 | -4.7832 × NLRC4 | -3.4888 × PLEKHN1 | -1.9377 × RASIP1 | +1.9672 × SPP1 |
| Data-2-CFmax: max(Data-2-CF1, Data-2-CF2, Data-2-CF3) | |||||
| For the third dataset (NSCLC, European Cohort) | |||||
| Data-3-CF1: | -3.0126 | +4.8720 × GPT2 | +6.7189 × SGPL1 | +0.6686 × SPP1 | |
| Data-3-CF2: | -8.3253 | +6.8662 × GPT2 | -3.7611 × SGPL1 | +6.7842 × FAM220A | |
| Data-3-CFmax: max(Data-3-CF1, Data-3-CF2) | |||||
| For the fourth dataset (LUAD, Japanese Cohort) | |||||
| Data-4-CF1: | 0.6973 | -1.2969 × PLEKHN1 | +0.1731 × PCOLCE2 | -2.9965 × GABPB1-IT1 | |
| Data-4-CF2: | 2.2291 | -7.7037 × NLRC4 | +3.7928 × PLEKHN1 | -5.9701 × PCOLCE2 | |
Note: Data-4-CFmax: max(Data-4-CF1, Data-4-CF2)
Table 1: The final S4 classifiers.
The risk probabilities (Pmax, the last column in Tables 2-5) are calculated using the logistic function of exp(Data-i-CFmax)/(1+ exp(Data-i-CFmax)) for the combined classifiers in each dataset, or exp(Data-i-CFj)/(1+ exp(Data-i-CFj)) for each individual classifier i=1,2,3, j=1,2,3. Tables 2-5 list partial expression values of the selected genes for patients, the classifier values (Columns CF1, CF2, CF3, CFmax), and the final risk probabilities (Column Pmax). Note that the risk probabilities are truncated to two decimal digits. As such, 1.00 does not mean an exact value of 1. All original gene expression value data used in the final models and computed results are available online in a Finaldata.xlsx file as a supplementary file (submitted together with the paper). In this excel file, there are five sub-tables (sheets): LUAD sheet for the first dataset, LUSC sheet for the second dataset, NSCLS-European sheet for the third dataset, LUAD-Japan sheet for the fourth dataset, and Summary sheet corresponding to Tables 2-5 in the main text.
Figure 1 plots the risks of patients with lung cancers in four cohorts, respectively. The four plots clear show that the new classifiers have superior performance and clear patterns.
| TCGA ID | LC/NLC | NLRC4 | PLEKHN1 | SPP1 | CF1 | CF2 | CF3 | CFmax | Pmax | |
|---|---|---|---|---|---|---|---|---|---|---|
| 05.4244.01A | 1 | 0.06 | -0.04 | 2.12 | 11.59 | 11.59 | 1 | |||
| 05.4249.01A | 1 | 0.02 | -0.21 | 1.94 | 9.76 | 9.76 | 1 | |||
| S2.AA1A.01A | 1 | -0.26 | -0.28 | 1.11 | 6.46 | 6.46 | 1 | |||
| 38.4625.11A | 2 | 0.68 | -1 | 0.61 | -4.9 | -4.9 | 0.01 | |||
| 91.6847.11A | 2 | 0.43 | -0.53 | -0.42 | -5.6 | -5.6 | 0 | |||
| 91.6849.11A | 2 | 0.25 | -1.05 | -0.39 | -8.23 | -8.23 | 0 |
Table 2: Three Critical Genes (NLRC4, PLEKHN1, SPP1), Competing Classifier Factors, Predicted Probabilities for the first dataset (LUAD, North American Cohort).

Figure 1: Risk probabilities of four cohorts. The circles are for patients with lung cancers. The asters are for tissues without lung cancers.
Figure 2 uses Venn diagrams to plot classified subtypes for all four cohorts based on the individual classifiers. This study is the first time LUAD, LUSC, NSCLC can be further classified into subtypes based on critical genes’ functions. This new classification opens a new research direction, new drug developments, and new refined personalized therapies. Notice that in Figure 2, Subtypes II (1 tumor sample), III (1 tumor sample), and VI (3 samples) shouldn’t be thought as outliers simply because the numbers of samples in these subtypes are so small. Using Subtype II as an example, this sample means it is detected by CF2 only. Note that Subtypes IV, VI and VII are detected by CF2, and they together with Subtype II can form a larger subtype of CF2. From a RNA sequence point view, compared with Subtype II, Subtype IV not only has the characteristics of Subtype II but also has the characteristics of Subtype I, i.e., double mutations, and similarly Subtype VII has all characteristics of Subtypes I, II, III, i.e., triple mutations. In medical practice, Subtypes I, II, III are relatively more curable than other subtypes due to much clearer and simpler signatures, and the most difficult one is Subtype VII (275 samples).

Figure 2: Venn diagrams of lung cancer subtypes. The first cohort is with only one main type. The second cohort has more than seven subtypes. The third cohort has more than three subtypes. The fourth cohort has more than three subtypes.
The above classifiers for four cohorts (datasets) clearly point out the puzzle and future therapies of lung cancers. In every cohort, three or four genes tell all possibilities of all subtypes of lung cancers. They surely provide essential information on lung cancers.
Remark 7. Different from all other existing analysis methods which interpret the function of each predictor (gene) to the disease mainly based on its coefficient value and sign, i.e., an individual effect, not any functional effects, the interpretation of each predictor (gene) in the S4 model and classifier is based on its interaction to other genes in the same component classifier and its interaction to subtypes of lung cancers, i.e., the interpretations of S4 classifiers are based on functional effects, not the individual effects, which distinguishes our new method from existing methods.
Notice that the PLEKHN1 gene appears in all competing factors in all LUAD and LUSC analyses. In the literature, PLEKHN1 has been recognized to play pro-apoptotic roles during reactive oxygen species (ROS)–induced apoptosis in human colon cancer [25]. It will be of great importance to explore PLEKHN1’s biological function in lung cancer, also other genes found in this study.
Mathematically, Proposition 2.1 proves that the optimization objective function (4) will lead to the smallest set of genes, i.e., the models won’t cause overfitting, which is due to the objective function in (4) as the loss and penalty functions function in a hierarchical way. Such a combination of the loss function and penalty functions is new in the literature. Therefore, it can be expected that many existing high-dimension variable selection methods can be revised to adopt this new combination, and many new theories and computational algorithms can be developed.
To avoid model overfitting, splitting data has been advocated in many applications. This procedure works when the data in each group is homogeneous, i.e., the process is sufficient but not necessary. However, when data in each group is not homogeneous, this procedure can be inefficient, and the selected variables cannot be guaranteed as relevant. Note that the lung cancer patients in each dataset came from heterogeneous populations. Therefore, unless the subgroups are pre-determined, dividing data as training and testing datasets to perform cross-validation will lead to inefficient and misleading conclusions, which motivated the penalization scheme in this paper.
On the other hand, when a model is fitted to the whole dataset and leads to 100% accuracy, it will uniformly work for partitioned data as long as the partition is balanced to all heterogeneous subgroups. This is the case in all four analyses. Furthermore, it is not found that published papers used the “standard” procedure to lead to accurate prediction.
Note that the proposed model is fitted to four different datasets and reached the highest accuracy. Each dataset has its heterogeneous patterns (subgroups). Datasets are measured at different scales. Using four such datasets naturally serves as cross-validation and robust checking in the paper. It turns out the new approach is robust. First, the classical logistic regression classifier is a particular case of the proposed and fitted model, i.e., it is one of CFi. In the first dataset, we can see that the fitted model looks like a logistic regression fitted model as only one competing factor has been selected. This is a perfect example that the proposed method (4) does not overfit the data. In addition, if one directly fits the classical logistic regression, the fitted model may be different from the one reported in this paper due to different objective functions being used. In addition, the logistic regression fitted model may not lead to 100% accuracy. Second, from the second dataset (LUSC), we can see that the first competing factor (CF1) contains the same three genes as in the first dataset (LUAD), which gives a clear indication that the models are not overfitted.
For the first cohort (LUAD, North American Cohort), three genes lead to 100% sensitivity and 100% specificity. The formula tells this cohort contains only one lung cancer main type. Medical therapies can further partition this main type into subtypes according to the expression levels of NLRC4, PLEKHN1, and SPP1. Notice that the coefficient sign of NLRC4 is negative (-4.3417), which means an increase of NLRC4 expression level will benefit the patients; decreasing PLEKHN1 and SPP1 expression levels will benefit the patients. These observations lead to better therapies and personalized medicine.
The relationship among three genes and between the genes and the risk probability is illustrated in Figure 3. Looking at both Figures 1 and 3, we can see that three critical genes and their combined classifier showed clear relationships and patterns (clustered high probabilities and low probabilities) of all patients.
| TCGA ID | LC/NLC | NLRC4 | PLEKHN1 | RASIP1 | SPP1 | CF1 | CF2 | CF3 | CFmax | Pmax |
|---|---|---|---|---|---|---|---|---|---|---|
| 18.3406.01A | 1 | -0.18 | -0.06 | -0.21 | 1.99 | 3.15 | 0.49 | 5.47 | 5.47 | 1 |
| 18.3407.01A | 1 | -0.46 | 0.18 | 0.12 | 1.91 | 4.59 | 0.32 | 3.81 | 4.59 | 0.99 |
| XC.AA0X.01A | 1 | -0.25 | 0.44 | 0.3 | 1.89 | 4.53 | -1.9 | 3.02 | 4.53 | 0.99 |
| 22.4593.11A | 2 | 0.55 | -0.43 | 0.78 | 1.45 | -0.57 | -3.63 | -0.6 | -0.57 | 0.36 |
| 90.7767.11A | 2 | 0.55 | -0.75 | 0.84 | 0.88 | -1.82 | -2.67 | -2.17 | -1.82 | 0.14 |
| 92.7340.11A | 2 | 0.45 | -1.09 | 0.84 | 0.68 | -2.5 | -0.99 | -2.75 | -0.99 | 0.27 |
Table 3: Four critical genes (NLRC4, PLEKHN1, RASIP1, SPP1), competing classifier factors, predicted probabilities for the second dataset (LUSC, North American Cohort).

Figure 3: LUAD-North American Cohort: Visualization of gene- gene relationship and gene-risk probabilities.
For the second cohort (LUSC, North American Cohort), four genes lead to 100% sensitivity and 100% specificity. We can immediately notice that LUSC is more complicated than LUAD. In this LUSC cohort, we need three individual classifiers to form a final max competing classifier to reach 100% accuracy. We observe the following features: 1) An increase of NLRC4 level will benefit the patients in all subtypes except subtype III in Figure 2; 2) A decrease of SPP1 level will benefit the patients in all subtypes except subtype II; 3) An increase of RASIP1 level will benefit the patients in all subtypes except subtype I; 4) PLEKHN1 has different functions in different subtypes and the changes of its expression level can increase or decrease the risks of the patients depending on their subtypes. These observations reveal the puzzle of lung cancer. Existing research methods have been focusing on the significance of those genes close to cancers, i.e., those published genes may be regarded as surface genes. The published genes do not disclose deep-level gene-gene interactions. They can hardly be thought of as the drivers of lung cancers. The information obtained from those genes can be limited and suboptimal. The genes discovered from this study have 100% accuracy. These four critical genes are the most informative genes, which lead to a new discovery/ definition of seven newly identified subtypes, which can point to new therapies of LUSC type cancers. As a result, these four genes can be regarded as truly critical genes.
Among the three classifiers, the linear correlation coefficients between CF1 and CF2, CF1 and CF3, and CF2 and CF3 are 0.1959, 0.6167, and 0.4704, respectively. These coefficients show that the three hyperplanes formed from four critical genes are neither parallel nor orthogonal. Subgroup VII is the intersection of three classifiers. It is the largest subgroup that contains 275 patients. In a Venn diagram, the more number the intersections, the more complex the disease. As such, the cure and the therapies of these 275 patients are more demanding. Other groups can be interpreted similarly. The relationship among four genes and between the genes and the risk probability is illustrated in Figure 4. Looking at both Figures 1 and 4, we can see that four critical genes and their combined classifier showed transparent relationships and patterns (clustered high probabilities and low probabilities) of all patients.
| ID | LC/NLC | SPP1 | GPT2 | FAM220A | SGPL1 | CF1 | CF2 | CF3 | CFmax | Pmax |
|---|---|---|---|---|---|---|---|---|---|---|
| GSM475656 | 1 | 2.6 | 0.33 | 1.4 | 0.67 | 4.82 | 0.9 | 4.82 | 0.99 | |
| GSM475661 | 1 | 2.84 | 1.17 | 2.12 | 0.81 | 10.04 | 11.09 | 11.09 | 1 | |
| GSM475706 | 1 | -0.13 | -0.88 | 1.49 | 0.18 | -6.2 | -4.93 | -4.93 | 0.01 | |
| GSM475780 | 1 | -0.54 | -0.66 | 1.59 | 0.05 | -6.27 | -2.27 | -2.27 | 0.09 | |
| GSM475810 | 1 | 3.29 | 1.19 | 1.68 | 0.38 | 7.58 | 9.81 | 9.81 | 1 | |
| GSM475657 | 2 | 0.21 | -0.71 | 1.48 | 0.26 | -4.57 | -4.12 | -4.12 | 0.02 | |
| GSM475809 | 2 | 0.98 | -0.72 | 1.67 | 0.36 | -3.45 | -3.28 | -3.28 | 0.04 | |
| GSM475811 | 2 | 1.23 | -0.49 | 1.78 | 0.56 | -0.84 | -1.75 | -0.84 | 0.3 |
Table 4: Four Critical Genes (SPP1, GPT2, FAM220A, SGPL1), Competing Classifier Factors, Predicted Probabilities for the third dataset (NSCLC, European Cohort).
| ID | LC/NLC | NLRC4 | PLEKHN1 | PCOLCE2 | GABPB1-IT1 | CF1 | CF2 | CF3 | CFmax | Pmax |
|---|---|---|---|---|---|---|---|---|---|---|
| GSM773541 | 1 | -0.46 | 0.2 | 1.63 | -0.33 | 1.72 | -3.2 | 1.72 | 0.85 | |
| GSM773542 | 1 | -0.56 | 0.26 | 1.56 | -0.25 | 1.38 | -1.83 | 1.38 | 0.8 | |
| GSM773765 | 1 | -0.71 | 0.29 | -0.06 | 0.32 | -0.63 | 9.2 | 9.2 | 1 | |
| GSM773766 | 2 | -0.56 | 0.16 | 1.47 | 0.48 | -0.7 | -1.63 | -0.7 | 0.33 | |
| GSM773783 | 2 | -0.5 | 0.16 | 1.94 | 0.46 | -0.54 | -4.88 | -0.54 | 0.37 | |
| GSM773784 | 2 | -0.78 | 0.12 | 0.58 | 0.44 | -0.67 | 5.24 | 5.24 | 0.99 | |
| GSM773785 | 2 | -0.44 | 0.11 | 1.83 | 0.38 | -0.26 | -4.88 | -0.26 | 0.44 |
Table 5: Four Critical Genes (NLRC4, PLEKHN1, PCOLCE2, GABPB1-IT1), competing classifier factors, predicted probabilities for the fourth dataset (LUAD, Japanese Cohort).

Figure 4: LUSC-North American Cohort: Visualization of gene-gene relationship and gene-risk probabilities.
The new S4 classifiers for the first two cohorts show that the new method is robust for different cohort studies by identifying the same set of genes, which is a desired property in practice.
For the third cohort datasets (NSCLC, European Cohort), we can immediately see that there are three genes in the individual classifiers different from those four critical genes in the first cohort (LUAD) and the second cohort (LUSC). This observation clearly reveals that lung cancer treatments have to pay attention to subtypes and their linked critical genes. It can be seen that a decrease of SPP1 level will benefit the patients like its function in the first two cohorts LUAD and LUSC. Decreases in GPT2 and FAM220A levels will benefit the patients. The coefficients associated with SGPL1 reveal that treatments of different NSCLC subtypes in Figure 2 classified by these four critical genes should be different.
The linear correlation coefficient between CF1 and CF2 is 0.8792, which tells that either classifier can identify the majority of the patients. However, it also suggests that the cure and therapies of most NSCLC patients can be complicated as their lung cancer causes can be either way, i.e., without certainty. Using the new diagnostic tools presented in this paper, the causes of cancer can be more transparent, and better therapies may be implemented. Looking at both Figures 1 and 5, we can see that four critical genes and their combined classifier showed transparent relationships and patterns (clustered high probabilities and low probabilities) of all patients.

Figure 5: NSCLC-European Cohort: Visualization of gene-gene relationship and gene-risk probabilities.
In this third cohort, two patients are being misclassified from NSCLC to normal. The first patient record is GSM475706, and the status was Public on May 07, 2010. The patient was a deceased male with overall survival of 21.3 months. The second patient record is GSM475780, and the status was Public on May 07, 2010. The patient was a deceased female with overall survival of 20.53 months. We can see from Figure 1 these two patients’ tissues had very low probabilities of being NSCLC tumors. Commented on the samples that one presented with an uncertain histological diagnosis, and two were from patients who had developed multiple primary tumors in [13]. However, we don’t have additional information to confirm whether or not these two patients are misclassified.
For the fourth cohort (LUAD, Japanese Cohort), there are two common genes, NLRC4 and PLEKHN1, which are also presented in the first cohort (LUAD, North American Cohort), but the other two genes are different. This observation tells that the causes, formations, treatments of lung cancer (LUAD) can be associated with patients’ races, lifestyles, tobacco use, and air pollutions [2]. The function of NLRC4 is the same as its functions in LUAD and LUSC, i.e., the smaller the level of NLRC4, the lower the risk. The function of PLEKHN1 is the same as its function in LUSC, i.e., it can increase and decrease the risks depending on the cancer subtypes in Figure 2. The expression levels of PCOLCE2 can increase and decrease the risks depending on the cancer subtypes, i.e., the same as PLEKHN1. GABPB1-IT1 will benefit patients with higher expression levels.
The linear correlation coefficient between CF1 and CF2 is 0.5881. We see that from Figure 2, there are 69 patients from Subgroup II with whom CF1 is not able to identify their lung cancer status. Looking at Figure 6, we see no transparent relationships and patterns of all patients and their gene expressions. This phenomenon can be explained by two classifiers. The coefficient signs of PLEKHN1 and PCOLCE2 are reversed from the two classifiers. As such, the complexity levels of the patients from the Japanese cohort are higher than those from North American cohorts and the cure and therapies should be different too.
In the fourth cohort, one patient was classified from normal status to lung cancer. The patient record is GSM773784. The Status was Public on Nov 01, 2011. The patient was an ever-smoker 70 years old male. From Figure 1, this patient’s risk of lung cancer was up to 99%. We conjecture there might be a lab error or testing inefficacy of this patient’s status.
Comparing the first, second, and fourth datasets, we see some commonalities of genes NLRC4 and PLEKHN1 and some dissimilarities of genes PCOLCE2 and GABPB1-IT1 in the fourth dataset. Recall that the Japanese cohort is a study of ALK-positive and EGFR/KRAS/ALK-negative lung adenocarcinomas. Gene- gene relations in our final classifiers fully represent lung cancer types (LUAD, LUSC, triple-negative LUAD.) Though NSCLC is a type of lung cancer, it is very different from the other three types. The classifiers derived from the third dataset again show their uniqueness compared with those classifiers derived from the other three datasets, and these particular classifiers fully capture the lung cancer type NSCLC.
From the above analyses, it is evident that gene-gene interactions and their functional effects play decisive roles, i.e., they can be more important than those genes which are biologically directly related to lung cancers with high expression values. The interactions and the signs of coefficients clearly tell the puzzle of the disease and point out potential better treatment therapies, i.e., personalized medicine. The critical genes can also lead to finding other sets of critical genes if they exist and are more important.
Clinic data analysis
In this section, we study the clinic variables, e.g., sex, age, smoking status, packs per year, tnm.t, tnm.n, tnm.m, and stage, and their associations with the subgroups defined by the competing classifiers derived in data section. Due to the fact the first dataset (LUAD) has only one main type of lung cancer, the clinic variables in the third dataset (NSCLC) are just the sex and incomplete, and in the fourth dataset (the Japanese cohort), stage only has two levels I and II, we use the second dataset (LUSC) to illustrate our analysis. Tables 6-8 summarize the computed results.
In Table 6, we see the much larger number of male LUSC patients (371) than female patients (130). In the first dataset (LUAD), the male patients and the female patients are counted to be 240 and 277 respectively, and in the fourth dataset, they are 95 and 109 respectively. Relatively, more patients were diagnosed lung cancer at their ages between 60 and 80.
| Sex | Age | ||||||
|---|---|---|---|---|---|---|---|
| LUSC | Male | Female | ≤ 50 | (50,60] | (60,70] | (70,80] | >80 |
| CF-1 | 21 | 12 | 1 | 5 | 11 | 14 | 2 |
| CF-2 | 1 | 0 | 0 | 1 | 0 | 0 | 0 |
| CF-3 | 1 | 0 | 0 | 0 | 0 | 1 | 0 |
| CF-(1,2) | 9 | 5 | 0 | 2 | 6 | 6 | 0 |
| CF-(1,3) | 125 | 49 | 9 | 27 | 70 | 54 | 10 |
| CF-(2,3) | 1 | 2 | 0 | 2 | 0 | 1 | 0 |
| CF-(1,2,3) | 213 | 62 | 10 | 51 | 108 | 93 | 8 |
Table 6: The Second Dataset (LUSC) clinic external data (Age, Sex) analysis and their associations with the classifications.
In Table 7, there were more patients at smoking status 3. However the numbers of smoking packs per year look no difference.
| Status | Packs per year | ||||||
|---|---|---|---|---|---|---|---|
| LUSC | 2 | 3 | 4 | ≤ 20 | (20,40] | (40,60] | >60 |
| CF-1 | 3 | 28 | 1 | 8 | 6 | 7 | 8 |
| CF-2 | 0 | 1 | 0 | 0 | 0 | 0 | 1 |
| CF-3 | 1 | 0 | 0 | 0 | 0 | 1 | 0 |
| CF-(1,2) | 1 | 13 | 0 | 1 | 4 | 7 | 2 |
| CF-(1,3) | 47 | 112 | 9 | 31 | 48 | 34 | 40 |
| CF-(2,3) | 2 | 1 | 0 | 0 | 1 | 1 | 1 |
| CF-(1,2,3) | 79 | 183 | 8 | 24 | 75 | 80 | 62 |
Table 7: The Second Dataset (LUSC) clinic external data (smoking status) analysis and their associations with the classifications.
In Table 8, there were more patients at stages TNM.t2, TNM. n0, TNM.m0, and Stage.I. For TNM.t4, TNM.n3, TNM.m1, and Stage.IV patients, they belong to Groups V CF-(1,3) and VII CF- (1,2,3), i.e., those combined competing classifiers reflect the lung cancer complexity and severity.
| TNM.t | TNM.n | TNM.m | Stage | |||||||||||
|---|---|---|---|---|---|---|---|---|---|---|---|---|---|---|
| LUSC | t1 | t2 | t3 | t4 | n0 | n1 | n2 | n3 | m0 | m1 | I | II | III | IV |
| CF-1 | 9 | 17 | 7 | 0 | 25 | 6 | 2 | 0 | 25 | 0 | 20 | 8 | 5 | 0 |
| CF-2 | 0 | 0 | 1 | 0 | 1 | 0 | 0 | 0 | 1 | 0 | 0 | 1 | 0 | 0 |
| CF-3 | 0 | 1 | 0 | 0 | 1 | 0 | 0 | 0 | 0 | 0 | 1 | 0 | 0 | 0 |
| CF-(1,2) | 5 | 7 | 2 | 0 | 11 | 2 | 1 | 0 | 12 | 0 | 10 | 2 | 2 | 0 |
| CF-(1,3) | 39 | 101 | 27 | 6 | 105 | 47 | 14 | 2 | 138 | 2 | 86 | 59 | 27 | 2 |
| CF-(2,3) | 1 | 2 | 0 | 0 | 1 | 2 | 0 | 0 | 3 | 0 | 1 | 2 | 0 | 0 |
| CF-(1,2,3) | 59 | 165 | 34 | 17 | 174 | 74 | 23 | 3 | 231 | 5 | 127 | 92 | 50 | 5 |
Table 8: The Second Dataset (LUSC) clinic external data (TNM.t TNM.n, TNM.m, Stage) analysis and their associations with the classifications.
This study is the first time in the medical literature that lung cancer diseases can be classified almost 100% correctly using only a few (three or four) genes. There have been dozens of genes published for various research purposes in the literature, e.g., survival analysis. Those published genes were mainly selected based on the large changes in their expressed values. They were not selected by gene- gene interactions and functional effects. The relationships among those published genes and their relationships to the diseases were hardly interpretable. In addition, the number of published genes is not small. As a result, it is difficult to verify which of those genes are truly critical. Even with dozens of genes, lung cancer classifications’ accuracy is not up to the highest level as possible, not to say the difficulty of how they can be applied to medical practice.
The discovery of the three or four critical genes and their functional effects: (NLRC4, PLEKHN1, SPP1) for the first cohort, (NLRC4, PLEKHN1, SPP1, RASIP1) for the second cohort, (SPP1, GPT2, FAM220A, SGPL1) for the third cohort, (NLRC4, PLEKHN1, PCOLCE2, GABPB1-IT1) for the fourth cohort, can motivate many new research directions and laboratory experiments. These genes can be a starting point for conducting gene network analysis, testing other reported genes, and finding the causal directions of gene expression in various projects. As a result, many other existing pieces of research, e.g., prognostic predictions, can be enriched. It can also be hoped that new types of diseases can be discovered. Eventually, new testing procedures and therapies for lung cancer can be designed.
These critical genes enrich the biological literature of their new functions related to lung cancer from indirect relationship to direct relationship, i.e., to become new biomarkers. In many scenarios, indirect effects are more significant than direct effects as direct effects can be seen and controlled while indirect effects are hard to see and even not to say how to control.
The risk probability of a patient developing a specific type of lung cancer in her/his life is low. Among all discovered lung cancer types, growing more than one type of lung cancer is rare. These lung cancer types compete, and one type will first be diagnosed. As a result, the competing risk factor models can be very efficient for modeling multiple lung cancer types.
The inference/analysis approach used in this study can shed new light on all gene-related research, i.e., not just the lung cancers study. Researchers can apply our new machine learning method in their studies. Ultimately, our new findings may make researchers’ cancer research efforts more effective and meaningful, reduce substantial research costs, and save lives and protect people.
Any arbitrary numbers for λ1 and λ2 in (4) satisfying the specified condition will work in our real data analyses. For future studies, tuning λ1 and λ2 may be needed. We leave this tuning study as a future project.
We note that the new S4 classifier in (4) does not involve patients’ attributes, e.g., sex, age etc. With a 100% accuracy, it is safe to say that the S4 classifier is uniformly efficient and robust over patients’ attributes, which is a desired property in model building. With a 100% accuracy, the discovered genes and their derived signature patterns certainly deliver meaningful and useful information to lung cancer study and overcome any data batch effects that may exist.
In the medical literature, the genes reported in this paper have been reported to be associated with other diseases. In particular, from Malacards and PubMed Central, we can find that i) NLRC4 – 281 hits in Malacards showing its involvement in 280 other types of diseases or disorders; ii) PLEKHN1 – 10 hits in Malacards without any hit for lung cancer; iii) SPP1 – 494 hits are found in Malacards with lung cancer having a very high score; iv) RASIP1 – 26 hits in Malacards with similar types of other cancer subtypes as for SPP1; v) GPT2 – Only 1 hit in Malacards and no mention of lung or other cancer types; vi) FAM220A–5 hits in Malacards with mentions of pancreatic, ovarian, and gastric types and without any mention of the lung types; vii) SGPL1–With 97 hits in Malacards, lung cancer ranks 50th; viii) PCOLCE2–With 30 hits in Malacards, connections to lung carcinoma appear several times; ix) GABPB1- IT1–With a total of 4 hits in Malacards, all being for cancer types, lung cancer types appear twice at the top. We note that these results are mainly based on their fold-changes in their expression values, i.e., not on their interaction effects or functional effects on the disease. For example, the effect of PLEKHN1 in our study can be positive and negative depending on its interaction with other genes and lung cancer subtypes. As a result, individual genes may not be appropriate to be considered biomarkers, given they can be associated with various types of diseases. On the other hand, a functional form of several genes can be used as new biomarkers, as suggested in this paper. Of course, these results should be further tested using blood test data. Furthermore, the functional effects and their forms of the genes found in this paper can be used to test other research findings on the cause of lung cancers or the effect of the disease as the component classifiers can be used as responses in the new analysis given they are now continuous scaled data with 100% sensitivity and 100% specificity. In addition, in our separate research projects on colorectal cancer, breast cancer, liver cancer, stomach cancer, and pancreatic cancer, etc., the genes found in this paper are not shown in those projects, which may be an indication the genes and their functional found in this study is lung cancer specific.
In terms of using other methods to identify critical genes, there do not exist any other methods that can find such a small number of genes and with high accuracy. In our opinion, comparisons should follow the following five ordered ways: 1) the accuracy; 2) interpretability; 3) if the accuracy is similar, the computational time; 4) if the accuracy is similar, the applicability of the model; 5) if the accuracy is similar, the advanced level of mathematical/statistical theory. The new method has 100% accuracy, which certainly has an advantage over other competing models with lower accuracy.
Doing data analysis and inference, data quality and their collection methods, e.g., relative quantification or absolute quantification, are always an issue. Many models failed when data were collected from heterogenous populations. Given our methods have 100% accuracy, the risk of the inference issue has been reduced to the minimum. The chance of making inference error is close to zero given the total sample size is 1508.
Finally, we address an important medical practice issue. In this paper, all classifier formulas are explicitly expressed. The results in Tables 2-5 are reproducible. Figure 1shows the risks of all patients. Figures 3-6 are particularly meaningful visualization tools for clinician to understand the status of lung cancer patients.

Figure 6: LUAD-Japanese Cohort: Visualization of gene-gene relationship and gene-risk probabilities.
Using this paper’s results, medical doctors have a powerful tool (testing kit) in their daily work, i.e., diagnosing and analyzing patients’ lung cancer risks based on the four critical genes’ expression values and the computed risks. Clinical trials can be conducted to study the efficiency of existing drugs and therapies for lung cancer patients. Medical research can be done to explore these genes biological connections to cancerous tissues.
The project was partially supported by NSF grant DMS-2012298.
Supplementary materials
Real data and computer outputs are in a supplementary file available online and submitted together with this paper. A MATLAB® demo code for solving an in Equation (4) (λ2=0) is also available.
The datasets are publicly available. The data links are stated in Section Data Description.
The author declares no competing interests.
Citation: Zhang Z (2022) Functional Effects of Four or Fewer Critical Genes Linked To Lung Cancers and New Subtypes Detected by a New Machine Learning Classifier. J Clin Trials. S14:001.
Received: 22-Oct-2021 Accepted: 17-Nov-2021 Published: 30-Nov-2021
Copyright: �?�© 2022 Zhang Z. This is an open-access article distributed under the terms of the Creative Commons Attribution License, which permits unrestricted use, distribution, and reproduction in any medium, provided the original author and source are credited.