Journal of Clinical Trials
Open Access
ISSN: 2167-0870
ISSN: 2167-0870
Research Article - (2015) Volume 5, Issue 3
Anxiety poses a significant problem in management of paediatric dental patients. Distraction can be an effective tool to manage these patients. The aim of this study was to evaluate efficacy of magic tricks distraction in management of anxiety. Forty children between 5 to 9 years of age, with no previous dental experience who required undergoing procedure needing application of local anaesthesia were included. They were divided into 2 groups – Group I-Control, Group II-Magic Distraction. Each child had 2 dental visits – 1.Screening followed by oral prophylaxis or restorative procedures without the need of a local anaesthetic injection. 2. Procedures necessitating need of a local anaesthetic injection. Control group received treatment without introduction of any distraction. Magic group viewed magic tricks videos. During each visit, the child’s anxiety levels were recorded: Before start of treatment, during treatment and posttreatment by using Venham’s Picture Test , Venham’s Anxiety Rating Scale, Pulse Rate, Oxygen Saturation. The mean range of Venham’s Picture Test Score, Venham’s Anxiety Rating and Pulse Rate was consistently lower for Group II patients across both visits. The Mean range for Oxygen Saturation was more for Group II than the control group.
Keywords: Anxiety; Behaviour management; Distraction techniques; Magic tricks distraction.
“Although the operative dentistry may be perfect the appointment is a failure if the child departs in tears” - Mc Elroy (1895)
Oral health care for young children can have a significant effect on their wellbeing and that of their families; however, dental anxiety can be a major obstacle to children accepting dental treatment. According to Folayan et al. [1], dental anxiety can be defined as a feeling of apprehension about dental treatment, which is not necessarily connected to a specific external stimulus.
Behavior management is widely accepted in providing dental care for children. Behavior management techniques can be grouped under five general approaches: physical restraint, pharmacological methods, behavioral modeling, reinforcement/contingency techniques, and distraction methods [2].
However, some methods involve significant demerits. For e.g., when employing tell-show-do, it is pivotal to use language and concepts the child can understand. Successful communication requires a feel for the child’s stage of intellectual maturation. Reinforcement and modeling techniques can be quite time-consuming and expensive for the dentists to implement. Physical restraint and pharmacological intervention may involve a potential physical hazard to the child.
In contrast, distraction methods can be safe, competent, and nominal for the clinician to use. However, the extent to which distraction techniques are useful is not well known, and studies examining its efficacy in Paediatric dentistry have yielded mixed results [3]. Therefore, the study was conducted to research the still to be deciphered field of distraction techniques.
The present study was conducted in the Department of Paedodontics and Preventive Dentistry. The aim of this in vivo study was to evaluate magic tricks distraction in management of dental anxiety in children using physiological and psychological parameters.
Inclusion criteria:
• Children aged between 5 to 9 years.
• Children having their first dental visit.
• Children well oriented with time and space
• Children who had to undergo treatment such as pulpotomy, pulpectomy or extraction for which application of local anaesthesia was required.
Exclusion criteria:
• Children with any mental or physical disability.
• Children allergic to local anaesthesia.
• Informed consent was obtained from parents prior to the start of the treatment procedure.
• A total of 60 children were randomly selected who presented to the Department of Paedodontics and Preventive Dentistry for routine care and were randomly divided into following 2 groups of 30 children each. Groups were matched for age and sex. The patients were assigned to one of the two groups on their first study visit
Group I: Control group – received treatment under normal dental setup without introduction of any kind of distraction technique.
Group II: Magic distraction group – underwent treatment while watching magic tricks video (Figure 1).
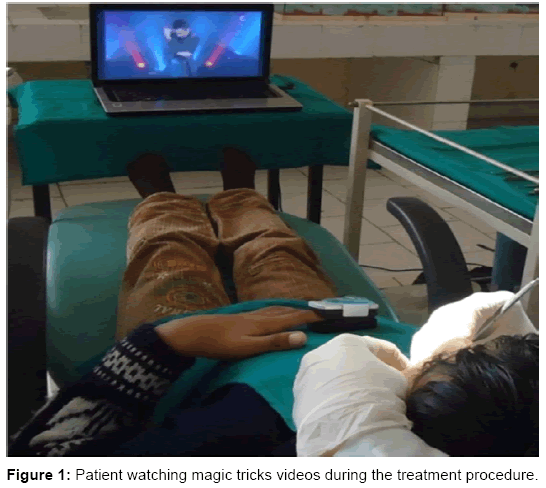
Figure 1: Patient watching magic tricks videos during the treatment procedure.
Clinical procedure:
Each child had 2 dental visits as follows:
• First visit: Screening and oral prophylaxis or restorative procedures without the need of a local anaesthetic injection.
• Second visit: Treatment procedures necessitating the need of a local anaesthetic injection
During each visit, the child’s anxiety level was recorded:
• Pre-treatment - before commencement of treatment procedure
• During the treatment
• Post-treatment - after the treatment procedure was completed
Child’s anxiety level in each visit was measured using the following:
Psychological measures:
• Venham’s picture test
• Venham’s anxiety rating scale
Physiological measures:
• Pulse rate
• Oxygen saturation
The Venham’s picture test is a projective self-report measure of anxiety. Picture card comprises of eight cards, with two figures on each card, one ‘anxious’ figure and one ‘non-anxious’ figure. The children were asked to point at the figure they were feeling the most like at that moment (Figure 2). The child’s score represented the number of times the more anxious member of each pair was chosen. Therefore, the scores ranged from 0 to 8.4 Venhams clinical anxiety rating scale is the clinician’s analysis of anxiety of the child. It ranges from 0 to 5 (from no anxiety to highly anxious state) [4].
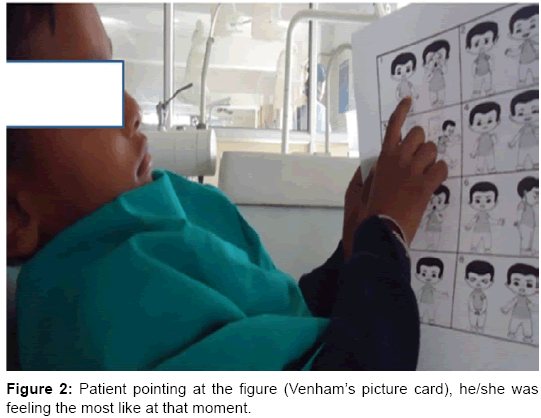
Figure 2: Patient pointing at the figure (Venham’s picture card), he/she was feeling the most like at that moment.
Pulse rate and Oxygen saturation: Each child’s pulse rate and oxygen saturation was monitored with a fingertip pulse oximeter. Pulse oximeter was clipped to the index finger of the child’s left hand. To reduce the risk of recording errors, it was ensured that the child did not move, by asking the child to firmly place his/her hand against his/ her chest. A research assistant blinded to the group assignments. The values obtained were tabulated and subjected to statistical analysis using ANOVA and Bonferroni Test.
Patients often associate the dental office as an unfriendly environment, distinguished by loud noises, peculiar odours, invasive contact in the mouth, and the contemplation of pain. This can lead to dental anxiety.
According to Bentsen et al. [5], distraction is defined as “a state of mind that draws the attention away from painful or unpleasant stimuli. Distraction techniques tax the patient’s limited attention capacity; resulting in the withdrawal of attention away from the noxious stimulus. Magic tricks can also be a great medium of distraction. In the case of anxious children, the attention of the child is drawn away from the actual dental situation and cooperation may be achieved. When a child has to make another visit to the operatory they often ask their parent “…do you think I will get to see some more magic” or “…I want the magic man” and not worry so much about the possibility of pain. Frequently, they recall the magic tricks… not the pain.
Venham’s picture test score (VPT)
The mean VPT score was consistently lower for patients in Group II for all three stages during the first visit (Figure 3). The mean VPT score was consistently lowest for patients in Group II for all three stages even during the second visit as well (Figure 4). Table 1 highlights that during the first visit; groups did not have statistically different mean VPT score during all the stages. However, during the second visit, during operative and post-operative stage, the mean value of VPT score was significant across both the groups. Table 2 enumerates that mean Venham’s picture test score of both groups across all three stages was not statistically significant during the first visit. However, the inter-group comparison of VPT score was statistically significant during operative stage and post operative stage of the second visit (Table 3).
| First Visit | Second Visit | |
| Pre-operative | F=0.127 p = 0.881 |
F = 1.251 p = 0.294 |
| Operative | F = 1.336 p = 0.271 |
F=9.579 p<.001* |
| Post -Operative | F=0.697 p = 0.502 |
F=5.141 p=0.009* |
Table 1: ANOVA of Venham’s picture test score of the two treatment visits.
| Group Comparison | Mean Difference | Std. Error | Significance (p < 0.05) |
|
| Pre -operative | Group I vs. Group II | 0.15 | 0.50 | 1.00 (NS) |
| Operative | Group I vs. Group II | -0.15 | 0.56 | 1.00 (NS) |
| Post-Operative | Group I vs. Group II | 0.25 | 0.51 | 1.00 (NS) |
Table 2: Bonferroni Test for Inter-group comparison of Venham's picture test score of different groups during the first visit.
| Group Comparison | Mean Difference | Std. Error | Significance (p < 0.05) |
|
| Pre -operative | Group I vs. Group II | 0.75 | 0.52 | 0.45 (NS) |
| Operative | Group I vs. Group II | 2.20 | 0.50 | <0.001 (S) |
| Post -Operative | Group I vs. Group II | 1.70 | 0.53 | 0.01 (S) |
Table 3: Bonferroni Test for Inter-group comparison of Venham’s picture test score of different groups during the second visit.
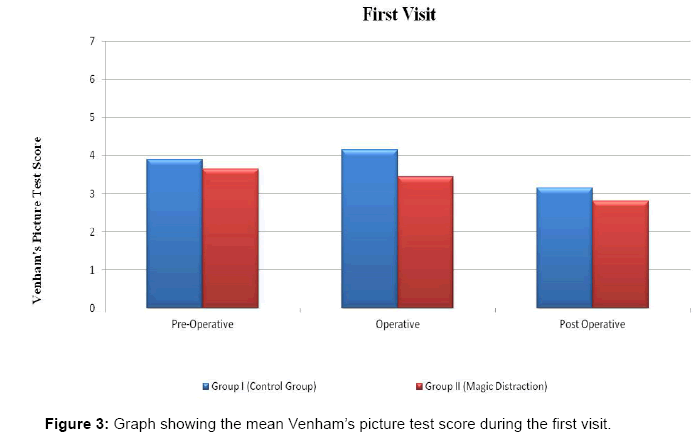
Figure 3: Graph showing the mean Venham’s picture test score during the first visit.
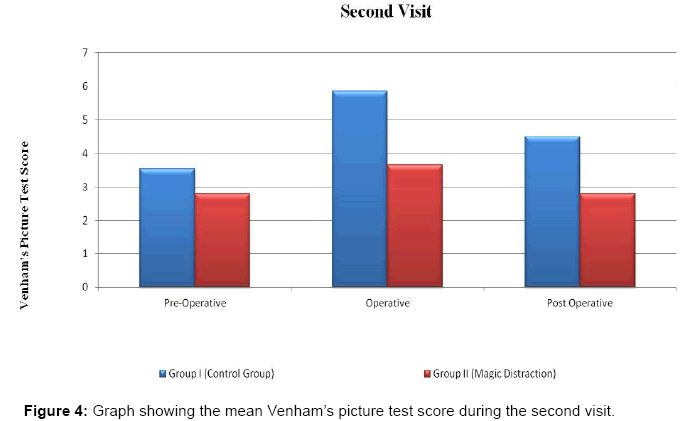
Figure 4: Graph showing the mean Venham’s picture test score during the second visit.
The results were in accordance with a study by Yamini V et al. [6] who evaluated the effectiveness of music distraction in the management of anxious paediatric dental patients. Marwah et al. [7], who compared the anxiety levels in control and music distraction groups, did not find any significant difference between the groups but the scores in each group during different visits were strongly correlated. In a study comparing the audio and audiovisual distraction techniques by Prabhakar et al. [8], observations indicated that Venham’s picture test gave statistically inconclusive results. Despite the inconclusive results the picture test was an effective measure of the emotional state of the child at that particular instance. Ingersoll et al. [9] as well did not find significant differences in the Venham’s picture scores between the control group and the distraction group.
El-Sharkawi HF et al. [10] who used audio-visual glasses for distraction, also found a statistically significant difference between the distraction technique and the traditional technique in the self-report scale. The results were not in conformance with Ramos-jorge et al. [11] who found the mean Venham’s picture test score to be similar in both groups i.e. Control group and distraction group.
Venham’s anxiety rating
Mean Venham’s anxiety rating was consistently lower in Group II patients during the first visit and second visit for all the three stages (Figures 5 and 6). Table 4 suggests that during operative stage, mean Venham’s anxiety rating was significant across the two groups during both the visits. But, during post-operative stage, mean Venham’s anxiety rating was significant only in the second visit. Table 5 highlights that mean Venham’s anxiety rating score of Group I and group II was significant during the operative stage. Table 6 suggests that mean Venham’s anxiety rating scale for Group II patients was significantly less than that of Group I during the operative stage and post-operative stage.
| First Visit | Second Visit | |
| Pre -operative | F=0.924 p = 0.403 |
F = 2.631 p = 0.081 |
| Operative | F = 6.141 p = 0.004* |
F=8.324 P=.001* |
| Post-Operative | F=2.406 p = 0.099 |
F=5.912 p=0.005* |
Table 4: ANOVA of Venham’s anxiety rating of the two treatment visits.
| Group Comparison | Mean Difference | Std. Error | Significance (p < 0.05) |
|
| Pre -operative | Group I vs. Group II | 0.20 | 0.23 | 1.00 (NS) |
| Operative | Group I vs. Group II | 2.85 | 0.25 | 0.003 (S) |
| Post-Operative | Group I vs. Group II | 0.40 | 0.18 | 0.10 (NS) |
Table 5: Bonferroni Test for Inter-group comparison of Venham's anxiety rating of different groups during the first visit.
| Group Comparison | Mean Difference | Std. Error | Significance (p < 0.05) |
|
| Pre -operative | Group I vs. Group II | 0.45 | 0.20 | 0.08 (NS) |
| Operative | Group I vs. Group II | 0.95 | 0.24 | 0.001 (S) |
| Post-Operative | Group I vs. Group II | 0.80 | 0.23 | 0.003 (S) |
Table 6: Bonferroni Test for Inter-group comparison of Venham's anxiety rating of different groups during the second visit
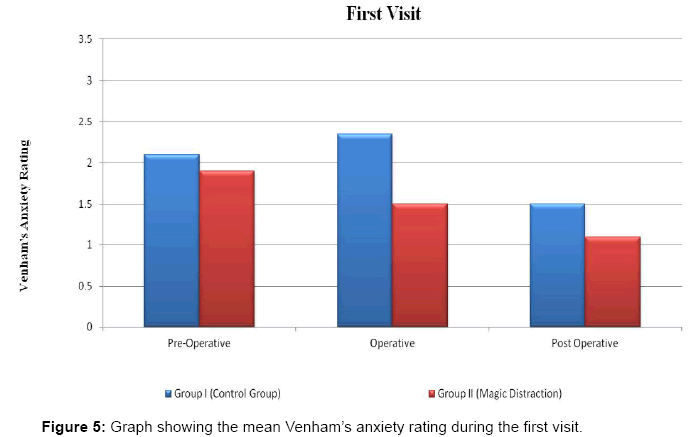
Figure 5: Graph showing the mean Venham’s anxiety rating during the first visit.
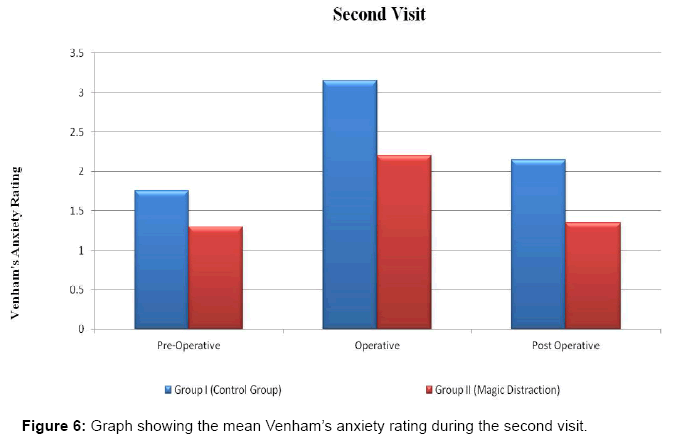
Figure 6: Graph showing the mean Venham’s anxiety rating during the second visit.
The results were in accordance with a study by Peretz et al. [12].
In their study, children in the Magic+ group demonstrated more cooperative behaviour. Children sat on the dental chair significantly faster than the Magic-group. Radiographs could be taken more in Magic+children. Similarly in a study by Hoge et al. [13], results showed that children in the distraction group demonstrated significantly less disruptive behaviour than those in the control group. However, contradictorily Marwah et al. [7] and, Prabhakar et al. [8] in their inter group comparison found no significant difference in Venham’s anxiety ratings during the visit.
The results were in accordance with El-Sharkawi HF et al. [10] who found a statistically significant difference between the distraction technique (A/V glasses) and the traditional technique.
Pulse rate
Mean pulse rate was consistently lower for patients in Group II for all the three stages for both the visits (Figures 7 and 8). Table 7 suggests that during pre-operative stage, mean pulse rate was not statistically significant across the groups. However, during operative stage of second visit, significant difference was found in the mean pulse rate of both the groups. But, during post-operative stage, mean pulse rate was statistically significant across groups for both the visits. The mean pulse rate of Group I was significant as compared to Group II during the post-operative stage of the first visit (Table 8). Table 9 highlights that mean pulse rate for Group II patients during operative stage was different from that of Group I.
| First Visit | Second Visit | |
| Pre -operative | F=0.283 p = 0.755 |
F = 0.905 p = 0.41 |
| Operative | F = 1.464 p = 0.24 |
F=7.889 P=.001* |
| Post -Operative | F=6.247 p=0.004* |
F=3.553 p=0.035* |
Table 7: ANOVA of pulse rate of the two treatment visits.
| Group Comparison | Mean Difference | Std. Error | Significance (p < 0.05) |
|
| Pre -operative | Group I vs. Group II | 1.40 | 2.79 | 1.00 (NS) |
| Operative | Group I vs. Group II | 3.55 | 3.08 | 0.76 (NS) |
| Post -Operative | Group I vs. Group II | -6.30 | 2.52 | 0.05 (S) |
Table 8: Bonferroni Test for Inter-group comparison of pulse rate of different groups during the first visit.
| Group Comparison | Mean Difference | Std. Error | Significance (p < 0.05) |
|
| Pre -operative | Group I vs. Group II | 0.20 | 2.32 | 1.00 (NS) |
| Operative | Group I vs. Group II | 10.20 | 3.11 | 0.01 (S) |
| Post -Operative | Group I vs. Group II | -3.00 | 3.15 | 1.00 (NS) |
Table 9: Bonferroni Test for Inter-group comparison of pulse rate of different groups during the second visit.
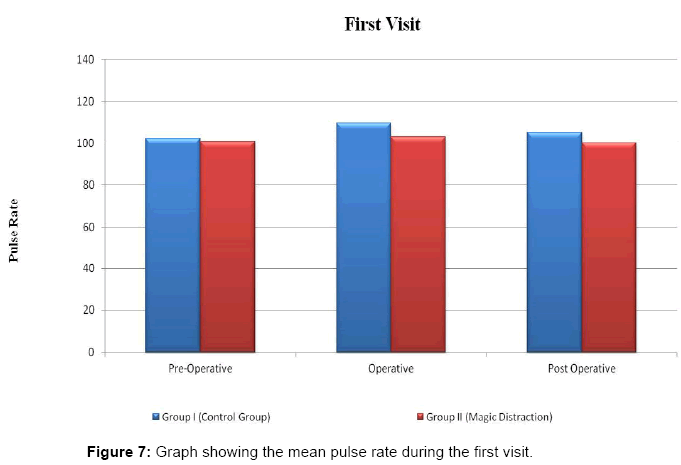
Figure 7: Graph showing the mean pulse rate during the first visit.
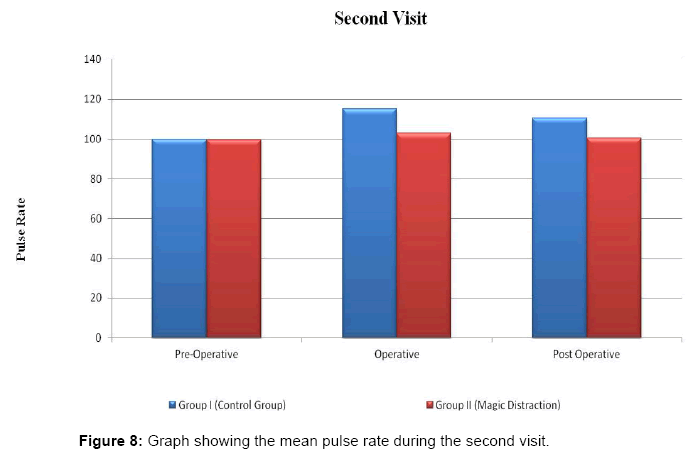
Figure 8: Graph showing the mean pulse rate during the second visit.
The results were in consonance with Marwah et al. [7] who concluded that pulse rate was more in the control group as compared to the distraction group but the differences were not statistically significant. Prabhakar et al. [8] also found the pulse rate to be the maximum in the control group during screening, prophylaxis or restoration. The results also highlighted that the mean pulse rate was the maximum during the operative stage as compared to the pre-operative or post-operative stages for all the three groups. The reason for increased anxiety during the operative stage could be because of the sound and sight of the hand piece or exposure to the anxiety provoking dental equipment. This was also observed by Kleinknecht et al. [14].
The results were in accordance with Prabhakar et al. [8] who found that the peak of anxiety in the extraction visit could be due to sight of injection. In another study, Aitken et al. [15] also found an increase in heart rate during the injection phase. Another study by Sullivan et al. [16] found that the pulse rates of the subjects who were in the distraction group were significantly lower than pulse rate of subjects who did not view virtual reality.
However, contradictorily Rayen R et al. [17] found pulse rate to be the higher during the pre- extraction phase as compared to the extraction phase. The reason for the higher values could be because of the use of a sophisticated looking apparatus which could create anxiety and act as a confounding factor to the obtained values. In another contradictory study Coral NL et al. [18] found pulse rate to be unrelated to experimental conditions.
Oxygen saturation
Mean oxygen saturation consistently higher in Group II patients during both the visits for all the three stages (Figures 9 and 10). Table 10 highlights that during Operative stage mean oxygen saturation was statistically different across groups in the first visit. But, during Post- Operative stage, mean oxygen saturation was statistically significant across groups in the second visit. Table 11 shows that the mean oxygen saturation of Group II was statistically significant during the Operative stage of the first visit. Table 12 highlights that significant difference was found in the mean oxygen saturation for Group II patients during the post operative stage when compared to Group I.
| First Visit | Second Visit | |
| Pre -operative | F=0.901 p = 0.412 |
F = 0.58 p = 0.563 |
| Operative | F = 3.431 p = 0.039* |
F=2.487 P=0.092 |
| Post -Operative | F=2.889 p=0.064 |
F=3.863 p=0.027* |
Table 10: ANOVA of oxygen saturation of the two treatment visits.
| Group Comparison | Mean Difference | Std. Error | Significance (p < 0.05) |
|
| Pre -operative | Group I vs. Group II | -0.05 | 0.20 | 1.00 (NS) |
| Operative | Group I vs. Group II | 0.35 | 0.21 | 0.32 (S) |
| Post -Operative | Group I vs. Group II | -0.50 | 0.28 | 0.25 (NS) |
Table 11: Bonferroni Test for Inter-group comparison of oxygen saturation of different groups during the first visit.
| Group Comparison | Mean Difference | Std. Error | Significance (p < 0.05) |
|
| Pre -operative | Group I vs. Group II | 0.20 | 0.21 | 1.00 (NS) |
| Operative | Group I vs. Group II | -0.50 | 0.31 | 0.32 (NS) |
| Post -Operative | Group I vs. Group II | -0.80 | 0.29 | 0.02 (S) |
Table 12: Bonferroni Test for Inter-group comparison of oxygen saturation of different groups during the second visit.
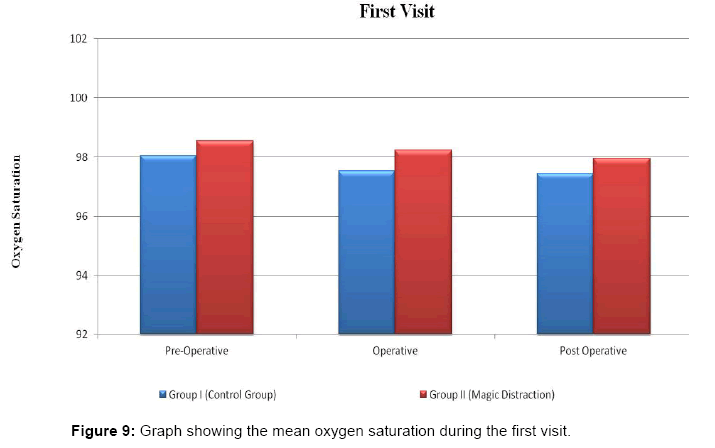
Figure 9: Graph showing the mean oxygen saturation during the first visit.
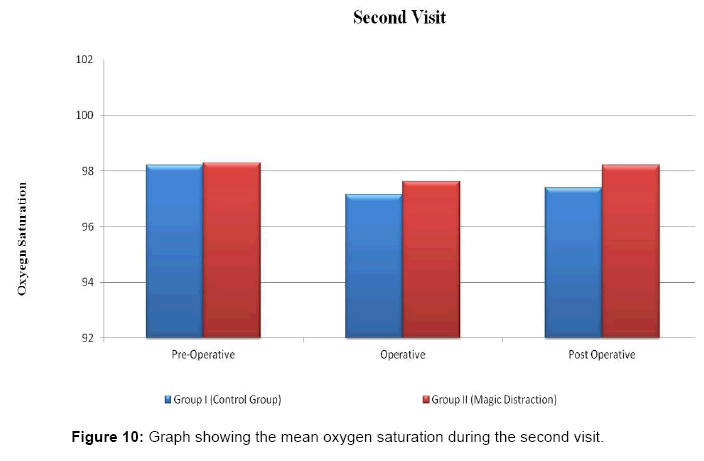
Figure 10: Graph showing the mean oxygen saturation during the second visit.
Marwah et al. [7] also found the mean oxygen saturation of the distraction group to be more than the control group. Moreover, oxygen saturation showed minimal variations during all the visits for both the control group and the distraction group. However their results were not statistically. Similarly, Prabhakar et al. [8] found the oxygen saturation to be the maximum for the audio-visual distraction group, there was no statistically significant difference between the levels of oxygen saturation in any of the groups.
Magic Distraction was an effective means of managing anxiety in pediatric patients in the dental operatory. The anxiety levels were highest during the operative stage of the treatment. However, distraction proved a convincing medium in controlling anxiety even during the anxiety provoking operative stage. Hence, magic tricks distraction can be a competent medium and a good alternative to other behavior management techniques.