Journal of Clinical Chemistry and Laboratory Medicine
Open Access
ISSN: 2736-6588
ISSN: 2736-6588
Research Article - (2024)Volume 7, Issue 4
Background: Six Sigma is a quality management strategy to improve the quality of processes and lays emphases on identification and removal of defects. Implementation of Six Sigma across laboratory processes allows identification of errors and introduction of novel approaches towards cost reduction without sacrificing quality. Keeping this in view, the study laboratory aimed to gauge the process performance of 19 routinely assayed parameters on sigma scale– that will help in assessing the laboratory’s performance and will enable in working out and choosing the correct approach towards improvement of problem analyte performance.
Methods: Quality Control data was harvested retrospectively from August 2019 to December 2019. Sigma metrics was calculated for 19 biochemical parameters tested on Vitros-5600 using Total Allowable Error (TEa), Coefficient of variation (CV%) and bias (%). Quality Goal Indices of the problem analytes were calculated to identify the cause of error.
Results: The following problem analytes were identified in this study having a sigma score of <3- Urea, ALT, ALP, Sodium, Calcium and Iron. QGI was calculated for these parameters to identify the area requiring improvementimprecision, inaccuracy.
Conclusion: The study concluded that sigma metrics is a good quality tool to assess the analytical performance of a clinical chemistry laboratory and stringent internal QC rules need not be adopted for methods with sigma ≥ 6. Also, false rejections in such cases can be minimised by relaxing control limits to 3S. However, for a problem analyte with sigma metric below 3, root cause analysis should be performed along with improvement in method performance before it can be routinely used.
Six sigma; Total allowable error; Bias; Coefficient of variation; Quality goal index
Clinical laboratories are complex and dynamic organizations that unceasingly need to improve the quality of testing and meet stringent guidelines while trying to reduce the cost. Nowadays, laboratories are required to handle increased workloads with a broader spectrum of parameters with limited manpower and yet deliver consistent results with utmost quality within the defined turnaround time, in a cost-effective way [1].
Laboratory performance can be appraised with the application of six sigma in the laboratory functions [2]. Sigma metric analysis not only provides an objective assessment of analytical methods and instrumentation but also makes available critical design information needed for operational implementation.
Six Sigma is a quality management strategy to improve the quality of processes and lays emphases on identification and removal of defects. Quality is assessed on the sigma scale with 3 sigma, the minimum allowable sigma for routine performance and sigma of 6 being the world class quality goal [3]. It can be inferred that as the sigma value increases, the consistency and steadiness of test improves hence reducing the operational costs. Keeping in view the above, we aimed to gauge the process performance of some routinely assayed parameters on sigma scale- Cholesterol, Urea, Creatinine, Total Bilirubin, Uric Acid, Aspartate aminotransferase, Alkaline phosphatase, Alanine aminotransferase, Total Protein, Albumin, HDL, Triglyceride , Sodium, Potassium, Iron, Amylase, Calcium, Phosphorus and Glucose in assessing the laboratory’s performance on sigma scale which will enable in working out and choosing the correct approach towards improvement of target analyte performance and cost reduction of the realization of a calibration curve and the reading of densitometry with the program Image J.
The study was conducted in the Department of Biochemistry, of a Central Government Tertiary Care Hospital, which caters to samples received from different departments. Both Internal and External Quality Control data were harvested retrospectively for a period of five months from August 2019 to December 2019 for 19 biochemical parameters (Cholesterol, Urea, Creatinine, Total Bilirubin, Uric Acid, Aspartate aminotransferase, Alkaline phosphatase, Alanine aminotransferase, Total Protein, Albumin, HDL, Triglyceride , Sodium, Potassium, Iron, Amylase, Calcium, Phosphorus and Glucose). Sigma metric was calculated for all the parameters using Total Allowable Error (TEa), Coefficient of variation (CV%) and bias (%). Two levels of internal quality controls (Biorad Lypho check Assayed Clinical Chemistry Control) were assayed daily prior to release of patient reports. All tests were performed on fully automated dry chemistry analyzer (Vitros 5600, Ortho clinical Diagnostics, USA) as per manufacturer’s recommendations.
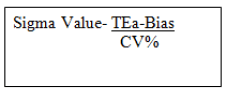
Sigma value
Sigma value was calculated using the following formula.
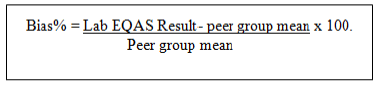
Bias
Bias is the systematic difference between the results obtained from laboratory’s test method and an accepted reference method. It was computed for each parameter from External Quality assurance records using the following formula.
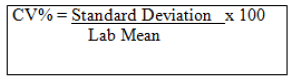
Coefficient of variation (CV %)
It is the standard deviation expressed as a percentage and measures variability of an assay.
Quality goal index (QGI)
QGI Ratio signifies the relative extent to which bias and precision meet their corresponding quality goals [4]. The purpose of this is to analyse the reason for lower sigma values in the problem analytes, whether the problem is due to imprecision or inaccuracy or both.
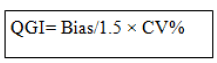
The criteria for interpreting QGI of the problem analytes with low sigma performance is as follows: - QGI<0.8 shows imprecision, QGI falling in the range of 0.8-1.2 shows both imprecision and inaccuracy and QGI>1.2 depicts inaccuracy.
Internal Quality Control and proficiency testing data for 19 clinical chemistry analytes were analysed retrospectively over a period of five months from August 2019 to December 2019. Process sigma was calculated for both QC levels using CV%, Bias% and Total allowable error (TEa). Sigma metric (average of both quality control levels for five months) 3 has been taken as the minimum allowable sigma and parameters falling below this sigma scale has been termed as problem analytes. Quality goal index (QGI) ratio has been calculated for all the problem analytes to identify the possible source of error. The Tables 1-3 summarizes the CV%, Bias% and Sigma values obtained for all the parameters. Out of the 19, only six analytes (urea, ALT, alkaline phosphatase, sodium, calcium and iron) were found to have an average sigma value <3.
| S. No. | Parameter | August | September CV% | October | November | December CV% | |||||
|---|---|---|---|---|---|---|---|---|---|---|---|
| CV% | CV% | CV% | |||||||||
| L1 | L2 | L1 | L2 | L1 | L2 | L1 | L2 | L1 | L2 | ||
| 1 | Glucose | 1.74 | 2.64 | 2.13 | 1.5 | 1.44 | 2.3 | 1.99 | 2.69 | 1.62 | 2.8 |
| 2 | Urea | 4.26 | 2.53 | 3.69 | 3.44 | 3.28 | 2.76 | 2.18 | 1.96 | 2.52 | 1.52 |
| 3 | Creatinine | 2.37 | 1.81 | 2.35 | 2.12 | 3.08 | 2.83 | 3.49 | 2.21 | 2.6 | 3.01 |
| 4 | Uric Acid | 1.57 | 1.53 | 2.97 | 2.75 | 2.21 | 2.32 | 2.33 | 2.65 | 2.3 | 2.54 |
| 5 | T.Bil | 4.17 | 3.01 | 4.25 | 4.06 | 5.08 | 2.82 | 5.01 | 6.2 | 4.03 | 5.47 |
| 6 | AST | 3.71 | 3.82 | 2.97 | 2.16 | 2.52 | 2.59 | 3.75 | 2.89 | 4.55 | 2.94 |
| 7 | ALT | 8.72 | 4.9 | 7.17 | 3.34 | 11.3 | 4.2 | 18.8 | 8.65 | 3.5 | 4.96 |
| 8 | ALKP | 3.91 | 5.96 | 4.92 | 3.54 | 6.11 | 3.75 | 3.2 | 2.21 | 6.89 | 4.39 |
| 9 | T. Protein | 2.15 | 3 | 1.88 | 2.12 | 1.55 | 2.75 | 2.48 | 2.69 | 1.44 | 2.05 |
| 10 | Albumin | 2.9 | 2.79 | 3.52 | 2.52 | 4.91 | 3.93 | 3.16 | 3.15 | 2.97 | 3.33 |
| 11 | Cholesterol | 1.72 | 2.34 | 2.01 | 1.96 | 1.71 | 2.35 | 3.16 | 2.29 | 1.67 | 3.48 |
| 12 | HDL | 3.01 | 3.24 | 3.33 | 3.24 | 2.93 | 3.56 | 5.08 | 6.17 | 2.59 | 3.02 |
| 13 | TG | 2.49 | 2.47 | 1.74 | 2.96 | 2.53 | 3.4 | 1.9 | 2.06 | 2.24 | 2.66 |
| 14 | Sodium | 1.78 | 1.38 | 1.06 | 1.16 | 1.43 | 1.93 | 1.09 | 1.61 | 1.94 | 1.01 |
| 15 | Potassium | 1.48 | 0.92 | 1.57 | 1 | 1.78 | 0.09 | 1.27 | 1.11 | 2.08 | 2.52 |
| 16 | Calcium | 1.13 | 1.23 | 1.52 | 1.6 | 1.61 | 0.19 | 1.38 | 1.62 | 0.88 | 1.07 |
| 17 | Phosphorus | 2.39 | 2.5 | 1.81 | 2.19 | 2.75 | 0.15 | 1.95 | 2.83 | 3.38 | 3.14 |
| 18 | Iron | 5.31 | 8.85 | 3.32 | 7.18 | 4.12 | 4.31 | 4.86 | 8.22 | 2.53 | 5.97 |
| 19 | Amylase | 7.36 | 3.66 | 3.58 | 5.89 | 8.47 | 5.31 | 10.42 | 4.18 | 9.05 | 5.22 |
Table 1: Table showing CV% of both QC levels (L1 & L2) of the parameters over a period of five months from August-19 to December-19.
| S. No. | Parameter | TEa | August | September Bias% | October | November Bias% | December Bias% |
|---|---|---|---|---|---|---|---|
| (Source) | Bias% | Bias% | |||||
| 1 | Glucose | 10* | 0.74 | 2.8 | 3.8 | -1.4 | 2.7 |
| 2 | Urea | 9* | 4.5 | -2.3 | 3.3 | 0.23 | 0 |
| 3 | Creatinine | 15* | 5.7 | -2.6 | -5.2 | -2.9 | -1.4 |
| 4 | Uric Acid | 12** | -1.06 | -3.1 | 0 | -1.7 | -0.34 |
| 5 | T-Bil | 20* | 4.1 | 4.5 | 2.5 | 11.8 | -23 |
| 6 | AST | 20* | 0 | -6.4 | -3.2 | 5.05 | 3.4 |
| 7 | ALT | 12 *** | 0.9 | -4.3 | -1.2 | -14 | -11.7 |
| 8 | ALKP | 12**** | -3.8 | 4.9 | -10.2 | -4.4 | 9.1 |
| 9 | T. Protein | 10* | -0.1 | 1.06 | 1.4 | -5.3 | -10.3 |
| 10 | Albumin | 10* | 1.9 | 3.9 | 6.3 | -3.5 | -8.6 |
| 11 | Cholesterol | 10* | -4.9 | 4.5 | 2.8 | -6.8 | 5.5 |
| 12 | HDL | 11.6**** | -4.9 | 2.07 | -19.5 | -6.8 | -18.6 |
| 13 | TG | 15***** | -7.9 | -2.7 | 2.3 | -4.02 | -7.07 |
| 14 | Sodium | 0.73**** | -1.5 | -2.7 | -3.08 | -2.8 | -1.3 |
| 15 | Potassium | 5.6**** | -3.9 | -0.24 | -1.6 | -1 | -4.2 |
| 16 | Calcium | 2.5**** | -1.5 | 0 | -0.55 | -1.02 | 1.6 |
| 17 | Phosphorus | 10.7 ****** | 0 | -0.22 | 3.8 | -1.09 | -5.3 |
| 18 | Iron | 20* | 0 | 1.7 | -0.89 | -1.4 | -0.43 |
| 19 | Amylase | 14.6**** | -4.7 | -34.6 | -3.3 | -14.7 | 13 |
Note:
*Clinical Laboratory Improvement Amendments
**Canadian Fixed limits from the College of Physicians and Surgeons of Saskatchewan
***Royal College of Physicians of Australasia (RCPA) Quality Assurance Program
****Desirable specifications for allowable total error, based on biological variability (BV)-Ricos
*****National Cholesterol Education Program recommendations for triglyceride measurement
******College of American Pathologists
Table 2: Table showing Bias% of the parameters over a period of five months from August-19 to December-19.
| S. No. | Parameter | August | September | October | November | December | Average | ||||||
|---|---|---|---|---|---|---|---|---|---|---|---|---|---|
| L1 | L2 | L1 | L2 | L1 | L2 | L1 | L2 | L1 | L2 | L1 | L2 | ||
| 1 | Glucose | 5.32 | 3.5 | 3.38 | 4.8 | 4.26 | 2.66 | 5.72 | 4.23 | 4.47 | 2.58 | 4.63 | 3.55 |
| 2 | Urea | 1.05 | 1.8 | 3.05 | 3.27 | 1.73 | 2.06 | 4.02 | 4.47 | 3.57 | 5.92 | 2.68 | 3.5 |
| 3 | Creatinine | 3.92 | 5.1 | 7.48 | 8.29 | 6.5 | 7.13 | 5.12 | 8.09 | 6.3 | 5.44 | 5.86 | 6.81 |
| 4 | Uric Acid | 8.31 | 8.53 | 5.08 | 5.49 | 5.42 | 5.17 | 5.9 | 5.18 | 5.36 | 4.85 | 6.01 | 5.84 |
| 5 | T.Bil | 3.81 | 5.28 | 3.65 | 3.82 | 3.44 | 6.2 | 1.63 | 1.32 | 10.6 | 7.86 | 4.63 | 4.89 |
| 6 | AST | 5.39 | 5.23 | 8.89 | 10.11 | 9.22 | 8.97 | 3.98 | 5.17 | 3.63 | 5.63 | 6.22 | 7.02 |
| 7 | ALT | 1.27 | 2.26 | 2.27 | 4.88 | 1.16 | 3.14 | 1.38 | 3 | 6.76 | 4.77 | 2.56 | 3.61 |
| 8 | ALKP | 2.65 | 3.6 | 1.44 | 2 | 3.6 | 5.92 | 5.13 | 7.42 | 0.41 | 0.65 | 2.64 | 3.91 |
| 9 | T. Protein | 4.69 | 3.36 | 4.75 | 4.21 | 5.52 | 3.11 | 6.18 | 5.69 | 14.1 | 9.9 | 7.04 | 5.25 |
| 10 | Albumin | 2.79 | 2.9 | 1.71 | 2.39 | 0.75 | 0.93 | 4.27 | 4.28 | 6.26 | 5.58 | 3.15 | 3.21 |
| 11 | Cholesterol | 8.19 | 6.02 | 2.74 | 2.81 | 4.17 | 3.03 | 5.31 | 7.33 | 2.66 | 1.27 | 4.61 | 4.09 |
| 12 | HDL | 5.49 | 5.1 | 2.87 | 2.95 | 10.6 | 8.74 | 3.64 | 3 | 11.7 | 10.09 | 6.87 | 5.97 |
| 13 | TG | 12.8 | 9.27 | 10.1 | 5.98 | 5 | 3.72 | 10 | 9.23 | 9.85 | 8.29 | 9.55 | 7.29 |
| 14 | Sodium | 1.25 | 1.61 | 2.29 | 2.94 | 2.6 | 2.42 | 3.23 | 2.19 | 1.06 | 2.03 | 2.08 | 2.23 |
| 15 | Potassium | 6.42 | 10.3 | 3.72 | 5.46 | 4.05 | 4.75 | 5.2 | 5.95 | 4.89 | 3.88 | 4.85 | 6.06 |
| 16 | Calcium | 3.58 | 3.29 | 1.67 | 1.59 | 1.92 | 1.89 | 2.58 | 2.2 | 1.04 | 0.85 | 2.15 | 1.96 |
| 17 | Phosphorus | 4.47 | 4.28 | 6.03 | 4.98 | 2.5 | 3.25 | 6.04 | 4.16 | 4.73 | 5.09 | 4.75 | 4.35 |
| 18 | Iron | 3.76 | 2.25 | 5.49 | 2.54 | 5.07 | 2.88 | 4.39 | 2.6 | 8.07 | 3.42 | 5.35 | 2.73 |
| 19 | Amylase | 2.6 | 5.36 | 8.3 | 15.8 | 2.1 | 7 | 2.81 | 7 | 0.17 | 0.3 | 3.2 | 7.09 |
Table 3: Table showing Sigma values obtained for both levels of QC of the parameters over a period of five months from August-19 to December-19.
The Table 4 shows calculation of QGI ratio for problem identification.
| ANALYTES | CV% | BIAS% | SIGMA | QGI RATIO | PROBLEM | ||||
|---|---|---|---|---|---|---|---|---|---|
| L1 | L2 | L1 | L2 | L1 | L2 | L1 | L2 | ||
| UREA | 3.18 | 2.44 | 5.75 | 2.68 | 3.5 | 1.2 | 1.5 | Imprecision and Inaccuracy | Inaccuracy |
| ALT | 9.89 | 5.21 | -6.06 | 2.56 | 3.61 | 0.4 | 0.7 | Imprecision | Imprecision |
| ALKP | 5 | 3.97 | 0.66 | 2.64 | 3.91 | 0.08 | 0.1 | Imprecision | Imprecision |
| SODIUM | 1.46 | 1.41 | 1.68 | 2.08 | 2.23 | 0.7 | 0.8 | Imprecision | Imprecision and Inaccuracy |
| CALCIUM | 6.52 | 1.14 | 0.31 | 2.15 | 1.96 | 0.03 | 0.2 | Imprecision | Imprecision |
| IRON | 4.02 | 6.9 | 0.17 | 5.35 | 2.73 | 0.02 | 0.01 | Imprecision | Imprecision |
Table 4: Showing average CV%, Bias% and Sigma value of the problem analytes and QGI ratio calculation for problem identification.
The Figures 1 and 2 shows the sigma metric scale obtained for each analyte for both levels of quality controls on a method decision chart.

Figure 1: Method decision chart for quality control level 1.

Figure 2: Method decision chart for quality control level 2.
Providing better diagnosis and improving the quality credentials along with cost reduction is an unremitting challenge for the diagnostic and healthcare industry. The effects incurred by operational inefficiencies can have a significant impact on quality of reporting and on laboratory’s budget. Identification of the bottleneck points is thereby crucial for improving operational productivity.
Implementation of Six Sigma across laboratory processes allows identification of errors and introduction of novel approaches towards cost reduction without sacrificing quality.
In general, laboratories design their QC protocol for both frequency and the number of levels of daily IQC runs based on guidelines of accreditation bodies. However, Good Laboratory Practice (GLP) requires every individual laboratory to design their own Individualized Quality Control Plan (IQCP) based on Sigma metric analysis, which prevents unnecessary repeated QC runs that leads to wastage and incurs more operational costs on the institution [5].
Employing Six Sigma in laboratory involves quantifying the performance of the test using standard quality control methods, specifying the quality requirements for the test (TEa), analyzing the data and computing a sigma value; recovering the process based on results of analysis which is then closely followed up [6].
In the present study, retrospective evaluation of sigma metrics for the analytical phase revealed glitches associated with six analytes (urea, ALT, alkaline phosphatase, sodium, calcium and iron) with an average sigma value <3. Variations in the sigma values obtained may be attributed to the difference in instrumentation, quality control material used and other pre and post analytical conditions.
QGI Ratio was calculated for all the six to determine the cause of errors. The problem was identified to be imprecision for ALT, alkaline phosphatase, sodium, calcium and iron, while both imprecision and inaccuracy was the cause of error for urea.
Similar studies were done and total allowable error refers to the amount of error that is acceptable without invalidating the medical usefulness of the test result [7-10]. It is used to define acceptable analytical performance for assessment of an individual instrument’s analytical performance, quality control validation and as a measure of agreement or comparability of results for analytes measured on different systems TEa sets the limit for both combined imprecision (random error) and bias/ inaccuracy (systematic error) that is permissible in a single test result to ensure clinical utility [11]. Having a preset quality specification also ensures uniformity across multiple analysers in the laboratory.
In the current study, total allowable error (TEa) for the analytes were taken from different industry standards in the current study. This permitted allowable error limits that is neither too stringent to give rise to false outlier alarms not too broad to miss out on the latent errors. Table 2 illustrates the different sources of total allowable error limits for the parameters included in the study.
Our study finally concluded that sigma metrics is a good quality tool to assess the analytical performance of a clinical chemistry laboratory and stringent internal QC rules need not be adopted for methods with sigma ≥ 6 [12]. Also, false rejections in such cases can be minimised by relaxing control limits to 3S. However, for a problem analyte with sigma metric below 3, root cause analysis should be performed along with improvement in method performance before it can be routinely used [13]. Poor sigma performance (<3) also calls for adoption of a newer and better method as the quality of the test in such cases cannot be assured even after repeated QC runs [14].
The strength of the study lies in its ability to integrate both the internal and external quality control performances, both of which are paramount tools for evaluating the analytical system quality and stability.
The study also recommends the application of sigma metrics to all segments of laboratory process to gauge their performance on sigma scale.
Citation: Sharma LK, Datta RR, Sharma N (2020) Evaluation of Sigma Metrics of Commonly Assayed Biochemical Parameters in a Clinical Laboratory. J Clin Chem Lab Med. 3.140. DOI: 10.35248/clinical-chemistry-laboratory-medicine.20.3.140
Received: 09-May-2020 Accepted: 21-May-2020 Published: 28-Dec-2024 , DOI: 10.35248/2736-6588.24.7.296
Copyright: © 2020 Sharma LK, et al. This is an open-access article distributed under the terms of the Creative Commons Attribution License, which permits unrestricted use, distribution, and reproduction in any medium, provided the original author and source are credited.