Journal of Clinical Trials
Open Access
ISSN: 2167-0870
ISSN: 2167-0870
Research Article - (2024)Volume 14, Issue 1
Objective: The prevalence of cardiac disease continues to burden patients and the health care economy. Over the past 30 years novel therapies, medications, and imaging technologies have extended life spans and wearable monitoring devices have led to improved care and outcomes. However, there is a technological gap regarding noninvasive monitoring of cardiac mechanical function.
Materials and methods: In a feasibility study, we evaluated a novel algorithm to assess the systolic and diastolic function in five normal subjects. We used a monitor developed in-house that simultaneously digitally recorded a one-lead Electrocardiogram, a Z-axis seismocardiogram, and a precordial phonocardiogram. We processed these data streams using a novel algorithm (ALG) (US patent 7054679B2).
Result: Five subjects completed a stress dobutamine test. Baseline (BL) data was recorded and followed by doses of dobutamine (10 (D10) and 20 mcg/kg/min ( D20) at 5–7-minute intervals. Along with the Algorithm-Derived Systolic Function (ALG-SF) and Diastolic Function (ALG-DF) values, we collected 2D echo-derived strain data and calculated Systolic Strain Rate (SSR) and Diastolic Strain Rate (DSR). Compared to BL, D20 increased ALG-SF and ALF-DF parameters by 33.3 ± 3.1% and 64.0 ± 28.5% (p<.05). Likewise, SSR and DSR increased by 82.4 ± 12.4 and 30.1 ± 7.0%.
Conclusion: In this pilot study, ALG-SF and SSR along ALG-DF and DSR were highly correlated with one another. Further studies in patients suffering from cardiac pathophysiology’s are warranted.
Algorithm; Cardiovascular disease; Non-invasive metric
The current standard non-invasive methods for measuring cardiac function are based in Transthoracic Echocardiography (TTE), which remains a key part of diagnostic algorithms for Heart Failure (HF) with reduced or preserved ejection fraction, cardiac valvular pathologies, and congenital heart diseases, among other pathologies [1-3]. TTE with Doppler ultrasonography can determine cardiac ejection fraction, wall thickness and motion abnormalities, chamber sizes, and flow rates across cardiac valves. It can also be used to assess for abnormal intracardiac and pulmonary artery pressures [4,5]. It is widely used for these purposes, with over seven million performed each year in North America [6].
Several other methods of measuring cardiac function non-invasively are in development. Some estimate cardiac parameters by analyzing peripheral vessels. Others use thoracic bioimpedance or bioreactance. Still others rely on Seismocardiography (SCG) and Ballistocardiography (BCG). Several approved monitors exist that measure Stroke Volume (SV) and Cardiac Output (CO) non-invasively, and multiple patents have been awarded to both approved and investigational systems.
Further development of reliable, non-invasive, wearable, cost- effective and real-time systems assessing cardiac systolic and diastolic function, might create useful diagnostic and monitoring tools for patients at risk of heart failure. Such systems, especially if used by the patient at home, might provide signals of deterioration before overt signs and symptoms of failure have set in, thereby potentially reducing costly emergency room visits and hospitalizations. This would allow treating physicians to intervene at an earlier point in the course of the disease. This study presents an algorithm (ALG, from the Hirsh algorithm) for evaluating the systolic function (ALG-SF) and diastolic function (ALG-DF) of the left ventricle using SCG and Electrocardiographic (ECG) data. The algorithm is based on a set of timing events in systole and diastole that represent the time between the peak electrical event in the ECG (Q wave or T wave) and its corresponding peak mechanical event (contraction or relaxation) detected with a seismocardiogram. Using Systolic Strain Rate (SSR) and Diastolic Strain Rate (DSR), we compared ALG-SF and ALG-DF to the SSR and DSR across a range of contractile and diastolic states.
Clinical study
This was a single institution, prospective, observational study approved by our institutional review board (IRB#17-057). Five healthy volunteers were studied and completed an informed consent. Each subject underwent a dobutamine stress test according to our heart clinic and echo lab protocol. Dobutamine was used to impact both systolic and diastolic function.
Subjects were continuously monitored with an ECG. Lead II was monitored and recorded. Two accelerometers were taped to the lower part of the manubrium sterna. Each of these separate streams of data was sampled at 4000 samples per second using LabView software with an oscilloscope simulator and an analog to digital converter for each channel. The data was stored on a laptop and transferred to a hard drive for off-line analysis. The signals used to quantify ALG-SF and ALG-DF are shown in Figure 1.

Figure 1: Shown here are two typical consecutive heartbeats from Subject 5, at baseline with no dobutamine. The top trace in blue shows the
first derivative of the seismocardiogram, labeled SEISMO’, taken from the accelerometer placed over the lower sternum. The green trace is the seismocardiogram itself, labeled SEISMO. Below in red is the ECG with its second derivative, the ECG’’(t) curve overlaid. Note:  ECG(t);
  SEISMOCARDIOGRAM’(t)
Before dobutamine administration, baseline echocardiographic strain and strain rate was recorded along with the Hirsh metrics. The dobutamine infusion was started at 10 mcg/kg/min (D10). At 5–7 minute intervals, the dose of dobutamine was increased to 20 mcg/kg/ min (D20), then 30 and 40 mcg/kg/min. Finally, a period of recovery was allowed without the administration of dobutamine.
In 3 of the 5 patients receiving 30 mcg/kg/min and 40 mcg/kg/min of dobutamine, we were unable to capture strain rate in the patients at both doses. In some patients, we were able to collect it at 30 but not 40 mcg/kg/min, and in others we were able to collect it at 40 but not 30 mcg/kg/min. This was due to suboptimal acoustic windows and the limited amount of time between escalation of dobutamine doses. For this reason and due the feasibility nature of the study, we chose to use the D10 and D20 doses to evaluate the relationship between the echocardiographic strain rate and Hirsh metrics of five subjects.
Echocardiographic and hirsh metric analysis
A Philips EPIQ 7C 2D Echocardiogram device using aCMQ speckle-tracking imaging software was used to calculate peak systolic and diastolic longitudinal strain rates (SSR and DSR, respectively) at baseline, and at each of the two rates of dobutamine infusion (Figure 2). At each step in the protocol (detailed in Table 1), an apical 4-chamber, 2-chamber and 3-chamber view was obtained, representing three separate cardiac cycles. Systolic and diastolic values of strain rate were obtained from these images and averaged by the aCMQ software to produce SSR and DSR.
| Data collection | Data analysis |
|---|---|
| Digitally record simultaneous ECG(t) and SCG(t) | At rest and at each of 2 increasing dobutamine infusion rates, measure 1) peak systolic strain rate (SSR), 2) peak diastolic strain rate (DSR) using 2D Echo speckle tracking technique, yielding SSR0, SSR1, SSR2 and DSR0, DSR1, DSR2 |
| Filter, smooth and differentiate to create ECG”(t) and SCG’(t) | Log transform the magnitudes of SSR0, SSR1, SSR2 and DSR0, DSR1, DSR2, yielding ln(SSR0), ln(SSR1), ln(SSR2) and ln(DSR0), ln(DSR1), ln(DSR2) |
| Per Figure 1, determine times Q”max and T”max from ECG”(t) | Plot 1/AVG(E-M)ino0, 1/AVG(E-M)ino1, 1/AVG(E-M)ino2 against ln( SSR0), ln( SSR1), ln(SSR2) for the systolic relationship |
| Per Figure 1, determine times Mino from SCG’(t) and Mlusi from SCG(t) | Plot 1/AVG(E-M)lusi0, 1/AVG(E-M)lusi1, 1/AVG(E-M)lusi2 against ln(DSR0), ln(DSR1), ln(DSR2) for the diastolic relationship |
| (E-M)ino=Mino-Q”max (E-M)lusi=Mlusi-T”max For the ith of 10 consecutive heartbeats |
Perform linear regression analysis, and calculate the Pearson correlation coefficient for the systolic linear relationship between 1/(E-M)ino and ln(SSR) |
| During systole, average 10 consecutive (E-M)ino time intervals and calculate 1/AVG(E-M)ino at rest and at 2 increasing dobutamine infusion rates, creating 1/AVG(E-M)ino0, 1/AVG(E-M)ino1, 1/AVG(E-M)ino2 |
Perform linear regression analysis, and calculate the Pearson correlation coefficient for the diastolic linear relationship between 1/(E-M)lusi and ln(DSR) |
Table 1: Process for collection and analysis of the study data.

Figure 2: The changes in peak systolic and diastolic strain rate during the dobutamine stress test. Both D10 and D20 infusions were significantly elevated compared with baseline (p>0.05).
The Hirsh metric data was loaded into OriginLab where it was processed, and the timing of peaks was performed. (E-M)ino (representing systolic function) and (E-M)lusi (representing diastolic function) intervals were measured. At baseline, 15 consecutive (E-M) intervals were measured and averaged. For each of the steady states at the different rates of dobutamine infusion, 10 consecutive (E-M) intervals were measured and averaged. The natural logarithm of the absolute values of the three averaged strain rates were paired with the reciprocals of the averaged (E-M)ino and (E-M)lusi intervals during the same steady state, to form ordered pairs of the form.
The Q”max events, which herald systole, are labeled in the ECG’’ trace, as are the T”max events, which herald diastole. Mino events are shown at arrows in the SEISMO’ data. Mlusi events are shown in the SEISMO data. Note that Q”max and the Q-wave on the ECG are practically the same event. Vertical lines are used to show the time differences between the electrical events Q”max, and T”max, and their corresponding mechanical events, Mino and Mlusi, respectively. From the figure it is clear that (E-M)ino=(Mino-Q”max), and (E-M)lusi=(Mlusi – T”max). Heuristically, we used SEISMO data to identify Mlusi, and SEISMO’ data to identify Mino data. SEISMO’, the first derivative of the seismocardiogram has units of meters/sec3, which are units of jerk.
ln(abs(Strain Rate)), 1/avg(E-M) over the range of systolic and diastolic changes that were created by the two stepwise dobutamine infusions. These were plotted separately in the systolic and diastolic cases to create a pair of linear calibration curves for each subject. The data collection and processing protocol is shown in Table 1.
Figure 1, shows two typical consecutive heartbeats from a subject, at baseline, with no dobutamine infusion. The top trace in blue shows the first derivative of the seismocardiogram labeled SEISMO’, taken from a solid-state accelerometer taped to the lower sternum. The second trace in green is the undifferentiated seismocardiogram, labeled SEISMO. Below in red is the ECG. Overlayed in black upon the ECG is the second derivative of the ECG, labeled ECG”(t). The Q”max events which are the electrical heralds of cardiac systole are labeled, as are the T”max events that indicate cardiac diastole. Mino is the systolic event in SEISMO’ where the rate of acceleration of the thorax in the z-direction perpendicular to the sternum is changing most rapidly. Mino is shown in Figure 1, with arrows. The rate of change in acceleration, the first derivative of acceleration with respect to time is a physical quantity known as ‘jerk’. The units of jerk are m/s3. Mino is the point in time of maximal thoracic jerk in cardiac systole. Note that the time Q”max and the time of the ECG Q-wave is practically the same event.
Also shown in the second green acceleration trace is Mlusi. This event is a peak in thoracic acceleration in the z-direction perpendicular to the sternum that occurs during cardiac diastole. Two consecutive Mlusi events are shown with vertical lines through the trace.
Vertical lines are used to show the time differences between the electrical events Q”max and T”max, and their corresponding mechanical events, Mino and Mlusi.
From Figure 1, (E-M)ino=(Mino-Q"max), and (E-M)lusi=(Mlusi and T”max). Heuristically, we used SEISMO data to find the Mlusi event, and SEISMO’ data to find the Mino event.
We plotted the lnSSR against 1/(E-M)ino, where both quantities are averaged as described above, at rest and at two levels of steady-state dobutamine infusion (Figure 2). We created linear functions with a well-defined slope and intercept at high correlations. Plotting lnDSR against 1/(E-M)lusi yielded similar linear functions with high correlations.
Table 1, shows the flow of data collection and analysis. Figure 1, demonstrates the relationships between peak left ventricular strain rates and the reciprocal of the time interval between salient electrical events and their concomitant mechanical events in both cardiac systole and cardiac diastole. The relationships can be summarized as follows:
ln(SSR)=a+b/(E-M)ino ……….Eq. 1
ln(DSR)=a+b/(E-M)lusi ……………Eq. 2,
Here, a, and b are personal constants whose determination is multivariate.
Where,
SSR=Systolic Strain Rate,
DSR=Diastolic Strain Rate,
(E-M)ino=Time interval between the time of the second derivative maximum of the Q wave in systole (Q”max) and the time of the first derivative maximum of the SCG in systole;
(E-M)lusi=time interval between the time of the T-wave’s second derivative first peak in diastole (T”max) and the time of the acceleration maximum of the undifferentiated SCG in diastole.
The ECG and SCG were digitally recorded using standard clinical monitors, a pair of custom designed low mass accelerometers, and a LabView-based data collection system built specifically for this project. The ECG and SCG waveforms were filtered and smoothed so as to make them differentiable. A 60 Hz power-line noise was band-blocked between 69 Hz-61 Hz using Fourier filtering feature (OriginLab Corp, Northampton, MA).
A second derivative was used on the ECG to determine the time when the ECG voltage most rapidly accelerates upward in systole, giving Q”max, and importantly, when the T-wave accelerates maximally upward, yielding T”max. The Mino events were taken from the first derivative of the SCG in systole. This was done so to optimize the signal to noise ratio of this event. The Mlusi events were taken from the undifferentiated SCG, since this event was plainly obvious in that waveform. Using this data, (E-M)ino and (E-M)lusi were calculated as follows:
(E-M)ino=Mino–Q”max in Systole ……….Eq. 3
(E-M)lusi=Mlusi–T”max in Diastole ……….Eq. 4
Note that (E-M)ino and (E-M)lusi are time intervals given in seconds since the right hand sides of Eq. 3 and 4 are the times of events, given in seconds.
Following the flow chart shown in Table 1, at rest, and at each of two increasing infusion rates of dobutamine, (E-M)ino and (E-M)lusi were measured for each of 10 consecutive heart beats. This was done by inspection of the waveforms using graphing software from Origin. For each of the three steady states, 10 consecutive (E-M)ino and (E-M) lusi values from 10 consecutive heart beats were averaged to create AVG(E-M)ino and AVG(E-M)lusi. The reciprocals of these quantities were calculated to create:
PI=1/AVG(E-M)ino0, 1/AVG(E-M)ino1, 1/AVG(E-M)ino2 for systole, and PL=1/AVG(E-M)lusi0, 1/AVG(E-M)lusi1, 1/AVG(E-M)lusi2 for diastole, (PI, PL) are paired vectors that summarize all the changes in the electrical-mechanical intervals due to dobutamine effect in the entire experiment for a given subject. Ten consecutive heartbeats were averaged to eliminate the effect of respiratory variations in end-diastolic left ventricular volumes and therefore, in contractility and lusitropy, that follow from the Frank-Starling relationship.
Likewise, for each subject, at each of the three physiologic steady states (rest, Dobutamine 10 mcg/kg/min, and Dobutamine 20 mcg/kg/ min, denoted by the subscripts (0,1,2), SSR and DSR were obtained from the apical 4-chamber, 2-chamber and 3-chamber views. R to Aortic Valve (AV) closure times were obtained separately at each level of dobutamine before the SSR and DSR measurements. The SSR and DSR were performed concurrently with the SCG recordings but could be from non-consecutive heartbeats in the supine subject, as the best echocardiographic images were selected for entry into aCMQ by an experienced echocardiographer. The three values of SSR and DSR from each view were averaged to obtain a representative value at each steady state. Strain rates in systole are negative, and positive in diastole. We concerned ourselves only with the absolute magnitude of these quantities since the log function in equation 1 is not defined for arguments less than zero.
By first averaging the three representative cardiac systolic and then separately, averaging the concomitant three diastolic strain rates at each of three progressive states f inotropy and lusitropy, we can create a vector pair that summarizes the entire systolic and diastolic strain rate experience of each subject during the experiment, (QI, QL) such that:
QI=ln(AVG(SSR0)), ln(AVG(SSR1)), ln(AVG((SSR2) for systole, and
QL=ln(AVG(DSR0)), ln(AVG(DSR1)), ln(AVG(DSR2)) for diastole.
In the next step of the flow chart in Table 1, we graph PI against QI to assess the linearity of the relationship between 1/(E-M)ino and SSR.
We then graph PL against QL to assess the linearity of the relationship between 1/(E-M)lusi and DSR. A Pearson correlation coefficient is calculated. A linear correlation coefficient is similarly calculated between PI and QI in systole.
Mathematically it is a matter of indifference which vector QI or QL in systole, or PI or PL is represented on the x-axis. In our analysis, since Strain Rate is a known quantity with a history of use in the cardiology community, we chose to show the average ln(Strain Rate), QI or QL, as the independent variable in cardiac systole or diastole, respectively.
Five subjects (ages 23-61 years) completed the stress dobutamine echocardiographic test. Baseline heart rate ranged from 60 to 87 bpm, with a mean 71.8 ± 4.4. The first dose of dobutamine (D10) was associated with an increase in heart rate to 78.2 ± 10.8 (p=ns) and continued to rise during D20 to 96.2 ± 11.0 (p<0.01 compared to baseline and compared to D10, p<0.03).
The baseline values for ALG-SF were 5.62 ± 1.28 and during D10 rose to 7.12 ± 1.19 (p=ns). This represented a 33.3 ± 14.6%. At D20, ALG-SF continued to increase to 8.09 ± 1.38, representing a 54.8 ± 24.8% increase (p<0.05). The baseline value for ALG-DF was 3.53 ± 0.33 and during D10 rose to 5.05 ± 0.33 (p=ns). This represented representing a 48.1 ± 17.7% increase. At D20, ALG-DF rose to 5.46 ± 0.51, a 64.0 ± 28.5% increase (P<0.05).
The individual data for the systolic and diastolic values always moved in the direction of increased function. In some subjects, the directional change was very large, upwards of a 100% increase, leading to large standard error of the mean.
Novelty, impact and clinical monitoring potential of the hirsh algorithm
The current study provides the initial evidence that our non- invasive assessment of myocardial systolic and diastolic function using the Hirsh algorithm is correlated with echocardiographic indices of left ventricular contractility and relaxation. If validated and refined in future studies, the algorithm might form the foundation for the development of wearable technology, since the required accelerometers are portable, and ECG is readily obtainable. Computing power is also abundant and inexpensive, and a smartphone may be programmed to carry out the calculations in real time and alert authorized users about trends in ventricular contractility and relaxation. This would certainly be feasible at home and when the wearer is a rest.
Collection of echocardiographic data requires a scheduled office visit and a cardiologist who can evaluate the spectrum of cardiac function from normal to severely impaired. The goal of developing a non-invasive tool that is wearable and provides reliable daily data has been a focus of the medical device industry. Investigators have attempted to estimate cardiac output by measuring Pulse Wave Transit Time (PWTT), which entails measuring the time from the peak of the R wave on ECG to the peak on a peripheral pulse oximetry probe [7]. Others have identified valvular pathologies by acquiring a carotid artery pressure wave using an ECG and a video camera [8]. Cardiac output has also been estimated using radial artery tonometry with a sensor wrapped around the forearm [9]. A review of methods of cardiac output determination, including PWTT and radial artery tonometry, determined that they were insufficient to replace more invasive methods [10]. Other developed proxies for cardiac output include Lung to Finger Circulation Time (LFCT), which has been measured as the delay from the end of an episode of breath holding to the peak signal intensity on a pulse oximeter [11]. Systems deploying these methods have applied for and been granted US patents [12-14].
Thoracic bioimpedance is another method of measuring cardiac output and volume status and can be measured non-invasively with electrodes on the neck and trunk [15-17]. Devices with this technology have been used to estimate hospitalization risk in patients with heart failure and volume status in patients on intermittent hemodialysis [18]. Multiple devices using this technology have gained 501(k) clearance from the US Food and Drug Administration (FDA), and others have been granted patents [19,20]. Other investigations of thoracic impedance have also assessed cardiac contractility [21]. A similar but distinct method to estimate stroke volume is thoracic bioreactance, which is based on detection of phase shifts of an alternating current applied to the thorax [22-24]. Using electrodes applied to the chest above and below the diaphragm, it is possible to estimate cardiac output based on the phase shifts produced by the pulsatile flow of blood in the thoracic arteries [25].
Systems using Seismocardiography (SCG) and Ballistocardiography (BCG), which both record vibrations in order to measure cardiac functional parameters, are also in development. Systems using BCG have been used to identify changes in left atrial pressure, ventricular contractility, and cardiac output [26-28]. BCG and SCG have been used together and with machine learning to estimate cardiac kinetic energy and differentiate patients with HF from controls [29,30]. Multiple systems using BCG or SCG to estimate cardiac functional parameters have applied for or have been granted US patents [31,32].
Relationship between hirsh algorithm metrics and echocardiographic metrics
Evaluation of cardiac function with echocardiographic strain and strain rate has provided important insights into systolic and diastolic function across a variety of disease states [33]. It was imperative that ALG-SF and ALG-DF aligned with SSR and DSR. The analysis of ALG-SF and SSR and ALG-DF and DSR provided evidence that the change in strain rates were correlated with changes in the Hirsh algorithm metrics (Table 2, Figures 3 and 4). Important to note is that the individual subject correlations came with a wide variety of slopes and y intercepts. This was not notable as the two modalities do not share a common method of assessing cardiac function.
| Systolic function | |||
|---|---|---|---|
| Slope sec*ln(sec-1) | Y-intercept sec-1 | r value | |
| Pt 1 | 13.33 | -0.015 | 0.99 |
| Pt 2 | 0.66 | 4.86 | 0.99 |
| Pt 3 | 13.51 | -7.88 | 0.99 |
| Pt 4 | 3.24 | 1.93 | 0.99 |
| Pt 5 | 1.39 | 4.04 | 0.99 |
| Diastolic function | |||
| Slope sec*ln(sec-1) | Y-intercept sec-0031 | r value | |
| Pt 1 | 7.3 | -1.6 | 0.99 |
| Pt 2 | 13.35 | -7.73 | 0.99 |
| Pt 3 | 2.08 | 3.8 | 0.99 |
| Pt 4 | 2.03 | 2.93 | 0.99 |
| Pt 5 | 1.87 | 3.3 | 0.99 |
Table 2: Linear relationship of ALG-SF and ALG-DF with ln(SSR) and ln(DSR).

Figure 3: The changes in the Hirsh Algorithm (ALG) Systolic (ALG-SF) and Siastolic (ALG-DF) metric during the dobutamine stress test. The D20 infusion was significantly elevated compared with baseline (p>0.05).

Figure 4: A representative correlation of the ALG metric to the respective strain rates is shown for subject 1. Note: 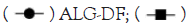 ALG-SF
In conclusion, MRI and echocardiographic imaging provide similar measures of cardiac function, with different but reproducible degrees of accuracy, pixel resolution and time required to collect the data.
The Hirsh algorithm metrics behaved as expected physiologically, with increases in systolic and diastolic function during the dobutamine stress test. The next step is to evaluate the Hirsh metrics in patients presenting with cardiac disease, including heart failure, hypertension, coronary artery disease along with comparison to healthy subjects. Finally, the utility of the metric will also depend on its ability to track daily or weekly changes in ventricular function.
[Crossref] [Google Scholar] [PubMed]
[Crossref] [Google Scholar] [PubMed]
[Crossref] [Google Scholar] [PubMed]
[Crossref] [Google Scholar] [PubMed]
[Crossref] [Google Scholar] [PubMed]
[Crossref] [Google Scholar] [PubMed]
[Crossref] [Google Scholar] [PubMed]
[Crossref] [Google Scholar] [PubMed]
[Crossref] [Google Scholar] [PubMed]
[Crossref] [Google Scholar] [PubMed]
[Crossref] [Google Scholar] [PubMed]
[Crossref] [Google Scholar] [PubMed]
[Crossref] [Google Scholar] [PubMed]
[Crossref] [Google Scholar] [PubMed]
[Crossref] [Google Scholar] [PubMed]
[Crossref] [Google Scholar] [PubMed]
[Crossref] [Google Scholar] [PubMed]
[Crossref] [Google Scholar] [PubMed]
[Crossref] [Google Scholar] [PubMed]
[Crossref] [Google Scholar] [PubMed]
[Crossref] [Google Scholar] [PubMed]
[Crossref] [Google Scholar] [PubMed]
[Crossref] [Google Scholar] [PubMed]
[Crossref] [Google Scholar] [PubMed]
[Crossref] [Google Scholar] [PubMed]
[Crossref] [Google Scholar] [PubMed]
Citation: Mulligan LJ, Mitrev L, Cotto M, Fullerton R, Sadler M, Hirsh R (2024) Evaluation of a Novel Non-invasive Algorithm to Assess Systolic and Diastolic Function in Normal Subjects. J Clin Trials. 14:548.
Received: 20-Dec-2023, Manuscript No. JCTR-23-28567; Editor assigned: 22-Dec-2023, Pre QC No. JCTR-23-28567(PQ); Reviewed: 05-Jan-2024, QC No. JCTR-23-28567; Revised: 12-Jan-2024, Manuscript No. JCTR-23-28567(R); Published: 19-Jan-2024 , DOI: 10.35248/2167-0870.24.14.548
Copyright: © 2024 Mulligan LJ, et al. This is an open-access article distributed under the terms of the Creative Commons Attribution License, which permits unrestricted use, distribution, and reproduction in any medium, provided the original author and source are credited.