Forest Research: Open Access
Open Access
ISSN: 2168-9776
ISSN: 2168-9776
Research Article - (2017) Volume 6, Issue 2
The total carbon pool in dry Miombo ecosystems is often underestimated. This study sought to close this gap by modelling the relationship between the above ground fresh woody biomass carbon pool and the soil carbon pool using both ground based methods and remote sensing methods. A total of thirty (30 m × 30 m) plots were randomly selected within the study area. Tree height and diameter at breast height (dbh) are the vegetation characteristics, which were measured in the present study. These variables were later used to calculate the above ground fresh biomass carbon per hectare. Soil samples were randomly collected from five points within the plots. The soil samples were analyzed for soil organic carbon (SOC). Three remotely sensed vegetation indices are-Ratio Vegetation Index (RVI), Normalized Difference Vegetation Index (NDVI), and the Soil Adjusted Vegetation Index (SAVI), which were calculated using geometrically and radiometrically corrected Landsat 8 Operational Land Imager (OLI) satellite images. Correlation and regression analysis were used to quantify the relationship between SOC, above ground fresh woody biomass carbon and remotely sensed vegetation indices. Results showed that, above ground fresh woody biomass carbon was significantly related to SOC in the top soil layer (0-15 cm) and not the deeper soil layer (15-30 cm). The significant positive relationship between above ground fresh woody biomass carbon and SOC suggests that, above ground fresh woody biomass carbon can be used as a proxy to estimate SOC in the top soil layer (0-15 cm) in dry Miombo ecosystems. Remotely sensed vegetation indices were not significantly (p>0.05) related to the SOC regardless of depth. This result implies that further work is needed before multi-spectral optical remote sensing can be used as a tool to estimate SOC in dry Miombo ecosystems.
<Keywords: Miombo ecosystem; Soil organic carbon; Ratio vegetation index; Normalized difference vegetation index; Soil adjusted vegetation index; Remote sensing
Background to the Study
Anthropogenic activities particularly fossil fuel combustion, deforestation and industrialization have resulted in increased concentration Carbon dioxide (CO2) and other greenhouse gases in the atmosphere (IPCC 2012). This has resulted in the need to identify strategies to mitigate the effects of global warming, which is one of the major drivers of climate change. Two main strategies have been proposed to mitigate the negative effects of climate change and these are: reducing the emission of greenhouse gases and the capture and storage of CO2 from the atmosphere [1].
The terrestrial ecosystem plays a pivotal role in the capture and storage of atmospheric CO2. So far, a total of five major carbon sinks have been identified in terrestrial ecosystems. These are the above ground biomass, below ground biomass, litter, woody debris and soil organic matter [2]. Among all the carbon pools, above ground biomass constitutes the largest component of the carbon pools hence its potential contribution to climate change mitigation has been widely researched [3] at the expense of other components of the carbon pool especially soil organic carbon (SOC). The role played by other carbon pools particularly the soil carbon pool has received less research attention yet globally soils contain almost twice the amount carbon found in above ground biomass [4].
Modelling soil carbon stocks: To address this knowledge gap, calls have been made to develop simple indirect methods to try to estimate soil carbon stocks [1]. Remote sensing technique that, provide low cost and spatially continuous information that cover large areas on a repetitive basis are being explored to provide spatially explicit information on soil carbon dynamics in terrestrial ecosystems. Soilvegetation interactions can also be utilized since the process of soil carbon sequestration is partly dependent on litter fall from the above ground vegetation. Accurate and rapid estimation of SOC stocks is important in dry Miombo ecosystems to estimate their contribution to global carbon stocks and also for carbon trade purposes under the Reducing Emissions from Deforestation and Forest Degradation+ (REDD+) scheme. The Miombo woodlands are the most extensive warm dry forest type in southern Africa and they are an important center of plant biodiversity.
Problem statement
Current scientific understanding of soil carbon dynamics in dry Miombo ecosystems is poorer than that of above ground biomass carbon dynamics. This knowledge mismatch arises because most studies on carbon dynamics target above ground biomass, which is relatively easy to measure [5], compared to the soil carbon pool. Further, quantifying and monitoring changes in soil carbon stocks in Miombo ecosystems remains a challenge mainly because existing soil carbon monitoring techniques are costly and labor intensive [6]. This has resulted in underestimation of the total carbon pool in Miombo ecosystems.
Objectives
1. To determine the relationship between above ground fresh woody biomass carbon and SOC stock.
2. To determine the relationship between remotely sensed vegetation indices and SOC stock.
Justification
There is need to quantify the soil carbon pool because a large portion of carbon in terrestrial ecosystems is stored in soils. In the Miombo ecosystem, it is estimated that 50–80% of the total ecosystem’s carbon stock is found in the top 1.5 m below ground [7]. Globally, the amount of carbon contained in soils is approximately twice as large as that contained in the atmosphere [8]. Small changes in the SOC pool can result in significant impacts on the atmospheric carbon concentration. Therefore, quantification of the soil carbon pool using cheap locally calibrated models would help policy makers to understand the dynamics of soil carbon as well as its role in the global carbon cycle. Forest soils in particular might act both as a source of atmospheric CO2 and also provide a prospective way of mitigating the increasing atmospheric concentration of CO2.
Study area
The study was carried out at Mukuvisi Woodlands located at latitude 17° 50’ 35" S and longitude 31° 5’ 42" E about 7 km east of Harare city in Zimbabwe as in Figure 1. The woodland is 265 ha in area. Mukuvisi Woodlands is protected and therefore has remained relatively undisturbed by human activity since its establishment in 1965. It covers an area of about 265 ha [9].

Figure 1: Location of study area in Zimbabwe. Sample plots are overlaid as solid black circles. Map units are in UTM zone 36S with WGS84 as the datum.
Vegetation sampling
The study area was classified into woodland and other land cover types. A total of 30 plots were randomly selected within the woodland (Figure 2) using Arc view GIS software. The coordinates of the sample points were uploaded into a handheld Garmin Global Positioning System (GPS) receiver. The GPS readings were taken as plot centers. Each plot size measured 900 m2 (30 m × 30 m).

Figure 2: Distribution of sample plots within the study area.
Plots were north oriented using a magnetic compass. Tree height and diameter at breast height (dbh) were measured using a Suunto Clinometer and a Diameter Calliper, respectively. Soil samples were collected was done. Soil samples for bulk density analysis were collected using a soil bulk density core (Figure 3). The field work was undertaken during the month of February up to March 2014.

Figure 3: Soil bulk density core.
Estimation of above ground fresh woody biomass carbon: To estimate the soil carbon stock indirectly from above ground biomass, all tree stems greater than 5 cm diameter at breast height (dbh) and greater than 3 m height were identified in each of the 30 sample plots. Then, the following variables were measured: height and dbh (1.3 m above ground surface). These variables were then used to calculate above ground biomass per tree using biomass allometric equations
widely used in the literature [10] as follows:
B=3.01D0-7.48 dbh<10cm (1)
B=20.02D-203.37 dbh<10cm (2)
Where,
B=Biomass
D=Diameter at breast height
Biomass for all trees species in each plot was summed and divided by the size of the plot (0.09 ha) to give biomass per hectare. The above ground biomass was then multiplied by a conversion ratio of 0.5 to obtain an estimate of forest carbon in a plot (IPCC 2003).
Soil sampling
For each sample plot, a composite sample weighing 100 grams was collected at two depths (0-15 cm and 15-30 cm) using a soil auger and put in air tight soil sampling bags, separately. Assessing SOC at these two depths is necessary because most organic carbon in tropical ecosystems is concentrated in the top mineral layer [8] but, the 0-30 cm layer is the recommended depth in spatial inventories of SOC in each plot, was taken from depths of 0-15 cm and 15-30 cm, respectively. Since, measurement of SOC is costly and a composite sampling method, which consists of mixing soil samples from different soil profiles to obtain one average sample, was considered a good compromise [11].
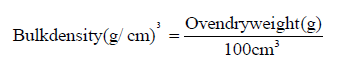
Soil bulk density was determined in the field using the core method [12]. One sample was collected from the center of each plot using a bulk density core (Figure 3) of known volume (100 cm3). The samples were put in air tight plastic bags and were then placed in an oven at 60ºC for 48 hours to drive out moisture. Soil bulk density values were then derived by dividing the mass (g) of the oven dried soil samples by the volume (100 cm3) of the bulk density core.
 (3)
(3)
SOC analysis: To measure SOC, all samples were air dried for 48 hours passed through 2 mm sieve and crushed to produce fine particles. SOC content was determined using the Walkely Black Method [13] in the laboratory in the Soil Science Department at the University of Zimbabwe.
SOC stock (Mg/ha) at a given depth was derived from the percentage of carbon in the soil and bulk density (Pearson et al. 2005) as follows:
SOC stock (Mg/ha)=C% × Bulk density × Soil depth (4)
Image acquisition and pre-processing: Landsat 8 Operational Land Imager (OLI) satellite images for the month of February 2014 were acquired from the United States Geological Survey (USGS) website and imported into ILWIS 3.3 GIS software for processing. Prior to calculating vegetation indices, the Digital Numbers (DN) were converted to radiances and then to Top of Atmosphere (TOA) reflectance using radiometric rescaling coefficients provided in the product metadata file (MTL file). The process was done using the following formulae (USGS 2013):
ρλ ' = MρQcal + Aρ (5)
Where:
ρλ’ =TOA planetary reflectance, without correction for solar angle.
Mρ =Band-specific multiplicative rescaling factor from the metadata
Aρ =Band-specific additive rescaling factor from the metadata
Qcal = Quantized and calibrated standard product pixel values (DN)
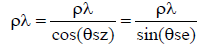
Reflectance with a correction for the sun angle was calculated as:
 (5)
(5)
Where,
ρλ=TOA planetary reflectance θSE=Local sun elevation angle
θSZ=Local solar zenith angle; θSZ=90°-θSE
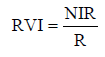
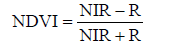
Remotely sensed vegetation indices: To assess whether soil carbon stock can be estimated indirectly from satellite imagery the following remotely sensed vegetation indices were calculated from Landsat 8 images using: Ratio Vegetation Index (RVI), Normalized Difference Vegetation Index (NDVI) and the Soil Adjusted Vegetation Index (SAVI).
 (7)
(7)
 (8)
(8)
Where, NIR is Reflectance in the near Infra-red and R is reflectance in the Red Band
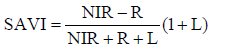 (9)
(9)
Where,
NIR is Reflectance in the Near Infra-red and R is Reflectance in the Red Band. L (0.5) is a constant that is empirically determined to minimize the vegetation index sensitivity to the soil background reflectance.
Statistical analysis
Pearson product-moment correlation was used to explore whether above ground woody biomass was correlated with SOC. The data were tested for normality using Shapiro Wilk’s test prior to correlation. Regression analysis was used to evaluate the relationship between SOC and above ground woody biomass as well as to assess the relationship between SOC and remotely sensed vegetation indices. Relationships were considered significant at α=0.05. R2 as well as the root mean square error were used to evaluate model fit. Root Mean Square Error was calculated in Percentage after randomly splitting the dataset into a calibration dataset (75%), and a validation dataset (25%).
The results in Table 1 show that the top soil layer (0-15 cm) contained twice as much SOC as the deeper soil layer (15-30 cm). The mean above ground fresh woody biomass (23.1 Mg C ha-1) was higher than the mean carbon content in the upper soil layer (15.3 Mg C ha-1). The fraction of SOC did not exceed 1.2% in both the top 15 and the 15- 30 cm layers. Tree stem density at the study site ranged between 144 and 2277 as shown in Table 1.
| Variable | Min. | Max. | Average | S.D. | N |
|---|---|---|---|---|---|
| Above ground fresh woody biomass (Mg C ha-1) | 7.4 | 56.1 | 23.1 | 10.6 | 30 |
| Soil organic carbon stock in the 0-15 cm layer (Mg C ha-1) | 8.9 | 28.4 | 15.3 | 4.8 | 30 |
| Soil organic carbon stock in the 15-30 cm layer (Mg C ha-1) | 2.6 | 7 | 4.9 | 1.2 | 30 |
| Soil organic carbon in the 0-15 cm layer (%) | 0.38 | 1.15 | 0.67 | 0.2 | 30 |
| Soil organic carbon in the 15-30 cm layer (%) | 0.12 | 0.32 | 0.22 | 0.05 | 30 |
| Tree density (stems/ha) | 144 | 2,277 | 816 | 540 | 30 |
Table 1: Descriptive statistics of measured variables.
Relationship between remotely sensed indices and carbon pools: SOC in the upper soil layer (0-15 cm) and was positively correlated with above ground fresh biomass carbon and this relationship was significant (r=0.678; P<0.01). However, there were no significant correlations (r=-0.11, P>0.05) between SOC in the deeper soil layer (15-30 cm) and above ground fresh woody biomass carbon. Since the above ground carbon had a significant relationship with the top soil layer (0-15 cm) subsequent regression models were developed for the 0-15 cm soil layer only.
Relationship between remotely sensed vegetation indices and SOC: Table 2 summarizes the relationships between above ground woody and soil carbon pools and remotely sensed vegetation indices. It can be observed that, all the three indices were positively correlated with SOC in the top layer but the relationship between The Ratio Vegetation Index (RVI) and SOC was stronger (r=0.45) compared to other indices. RVI also had the strongest relationship with above ground fresh biomass carbon. The relationships between SOC and remotely sensed indices were all negative and weak as shown in Table 2. Based on the significant relationship between RVI and SOC for the top 0-15 cm layer, the linear regression model best SOC’s relationship (Figure 4) to optical remote sensing in Mukuvisi woodlands is:
Y=0.0234X + 1.945, (R2=0.30, % RMSE=16, P<0.05) (14)

Figure 4: Scatter plot showing the relationship between above ground fresh woody biomass carbon and soil organic carbon for the top 0-15 cm layer in Mukuvisi Woodlands.
| Variable | RVI | NDVI | SAVI |
|---|---|---|---|
| SOC (0-15 cm) | 0.45 | 0.38 | 0.34 |
| SOC (15-30 cm) | -0.141 | -0.156 | -0.198 |
| Above ground fresh woody biomass carbon | 0.598 | 0.544 | 0.537 |
Table 2: Pearson correlation coefficients between carbon pools and remotely sensed indices. Coefficients in bold significant at P<0.05.
Where, Y is SOC and X is RVI. This is the best Linear model with the lowest Root Mean Square Error % of 16. However, the model only explained 30% of the variation in SOC stock as shown in Figure 5.

Figure 5: Scatter plot showing the relationship between soil organic carbon stock for the 0-15cm layer and the remotely sensed index - RVI in Mukuvisi Woodlands.
Results from this study indicate that, the spatial distribution of SOC in the dry Miombo ecosystem is significantly influenced by above ground fresh biomass carbon. Several studies in forest ecosystems have also found that, spatial variability in above ground woody biomass is a key factor in determining SOC variability [15]. A similar study conducted in Nhambita Community area-a dry Miombo ecosystem in Mozambique [16] also found positive correlations between soil C stocks and above ground biomass carbon. Our results are also consistent with those obtained in a study carried out in a mountainous forest landscape in Japan [17]. The positive correlation between SOC and above ground biomass can be attributed to litter fall from above ground vegetation which as an important soil organic matter input.
The upper soil layer (0-15 cm) showed significant (p<0.001) positive correlation with above ground fresh biomass carbon whereas the relationship between SOC in the lower 15-30 cm layer was not significant. This result implies that in Miombo ecosystems woody vegetation through allocation biomass to roots concentrated in the upper layer, which is more fertile, may be influencing the vertical distribution of SOC This inference is in accord with a previous study reporting that variations in vegetation cover controlled SOC distributions with soil depth [18].
Exploring whether remote sensing may aid the estimation of SOC is critical given that this technology overcomes some of the limitations of field-based methods. The findings of this study indicate that vegetation indices derived from optical bands had a weak relationship with SOC. The results are similar to those obtained in a study in Botswana [19], where NDVI only explained 23% of the variation in SOC stocks. This is an indication that multi-spectral optical remote sensing faces challenges in estimating SOC stocks in dry Miombo ecosystems. This result underscores the observations made previously that the distribution of soil carbon and the variable nature of soil organic matter complicate the use of optical remote sensing for spatial prediction of soil carbon stocks in Africa. With regard to use of remote sensing for soil carbon estimation, the results in this study are clearly in conflict with a study done in a tropical woodland ecosystem in Brazil that reported a much stronger relationship was also obtained in a study carried out in Brazil where the SOC showed a good correlation (r=0.97) with the remotely sensed Leaf Area Index (LAI), implying that LAI permits estimation of SOC through NDVI. This discrepancy in the low ability of remote sensing to estimate SOC in dry Miombo regions and its high potential in wet tropical ecosystems reflect that estimation of SOC using remote sensing is still difficult in dry Miombo woodland ecosystems containing low SOC levels (less than 2%) compared to wet tropical regions where SOC levels are higher (more than 2%).
Conclusions
In conclusion, the results of this study indicate that above ground fresh woody biomass carbon, which can be estimated from space, offers a promising avenue to estimate SOC in the upper soil layer (0-15 cm) in dry Miombo ecosystems of southern Africa. However, direct estimation of SOC from space relying on satellite remote sensing is still difficult and more research using non-optical regions of the electromagnetic spectrum is needed to address this gap.
Recommendations
Land managers can use the above ground fresh woody biomass carbon pool to estimate SOC. However, the following recommendations are suggested:
i. Developed models should be site specific due to the differences in soil types. Future studies should: Quantify the relationship between other carbon pools and the soil carbon pool.
ii. Use high spatial remote sensing satellite imagery to improve the relationship between remotely sensed imagery and the soil carbon pool.
iii. Incorporate climatic factors and soil properties to develop strong models to predict SOC because SOC is influenced by many factors.
iv. Stratify study sites according to soil type.
v. Quantify the relationship between soil properties and SOC