Journal of Thermodynamics & Catalysis
Open Access
ISSN: 2157-7544
ISSN: 2157-7544
Research Article - (2015) Volume 6, Issue 3
New theoretical expressions for the modeling of adsorption isotherms of Xenon on Graphite at 110 K have been established. The establishment of these new expressions is based on statistical physics formalism and some working assumptions. This method allowed estimation of physico-chemical parameters in the theoretical model. The parameters intervening in the adsorption process have been deduced directly from experimental adsorption isotherm by numerical simulation. The proposed models allow a good correlation to Type VI experimental isotherms. We mainly introduce three parameters affecting the adsorption process, namely, the density of Xenon receptor sites NM, the number of molecules per site n and the Xenon adsorption energy. Then we apply the model to calculate thermodynamics functions which govern the adsorption mechanism such as entropy, free enthalpy and internal energy.
Keywords: Adsorption isotherm; Statistical physics; Modeling; Thermodynamic potential
The study of adsorption properties of carbon nanotubes has several advantages. From a fundamental point of view, their tubular structure associated with their low dimensionality offers the possibility to study the effects of confinement and curvature on physical properties. As for applications related to the phenomenon of physical adsorption (physisorption), several studies dealing with the possibility of using these materials in storage systems, separation or gas detection [1]. On the other hand, the physisorption is particularly suitable for characterizing surface of the nanotubes. This technique is often implemented for the study of solid powders. The surface is generally characterized in terms of surface area and porosity. When the surface is uniform, that is to say as close as possible to a crystal plane without defects, the adsorption is carried out by condensation of successive monomolecular layers giving rise to a succession of steps of the isotherm adsorption. This type of adsorption has been extensively studied on graphite substrate [2]. The adsorption on the nanotubes leads also to isothermal operation [3,4], which allows to identify the fractions of uniform surface and get information on the nature of the adsorption sites and the method of attachment of the molecules of the latter. The term "surface defects" is a very vague term, used in the case of adsorption to designate heterogeneities may lead to inhomogeneous distribution of the energies of adsorption sites of a given surface. This leads to changes in all the adsorption properties described above on uniform surfaces, but to varying degrees according to the property studied and especially the nature of these heterogeneities.
In our work, we are interested in modeling the adsorption isotherm of Xenon on graphite at 110 K [5], this isotherm is similar to type six in the IUPAC classification [6]. Type VI isotherms are rare and indicate strong interactions adsorbate-adsorbent [7]. In this paper, we present the methodology used to find new and simple theoretical expression that is able to describe and fit well the adsorption isotherm of Xenon on Graphite Nanotubes. The study is composed of two parts: in the first one, we use a statistical physics treatment to establish the expression of an adequate model giving the adsorbed quantity against the pressure. In the second part, we apply the analytical expression to fit experimental data taken from literature. The adsorption isotherm of Xenon on graphite at 110 K achieved by ref. [5] is depicted in Figure 1. Then we apply the model to interpret the adsorption stereographic and energetic and to calculate thermodynamics functions which govern the adsorption mechanism such as entropy, the free enthalpy and the internal energy.
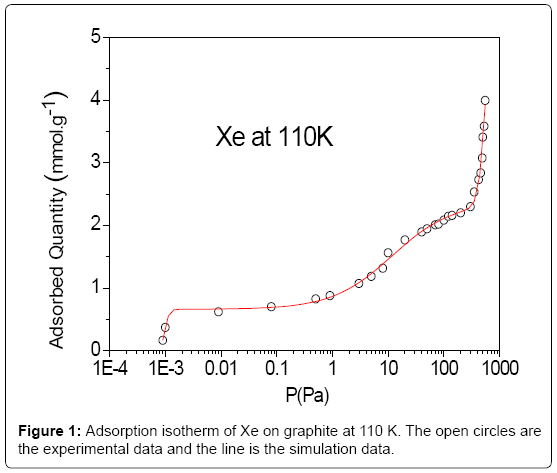
Figure 1: Adsorption isotherm of Xe on graphite at 110 K. The open circles are the experimental data and the line is the simulation data.
General statistical physics treatment
Adsorption involves an exchange of particles from the free state to the adsorbed one. Its investigation in statistical physics cannot be performed without employing the grand canonical ensemble to take account of the particle number variation. So a chemical potential is introduced in the adsorption process [8]. In order to treat adsorption problems using statistical physics methods, we will proceed with some assumptions as the basis of an initial postulate. As a first approximation, the molecules of Xenon are treated as an ideal gas [8], since the mutual interaction between the adsorbed molecules will be neglected. We consider that a variable number of molecules are adsorbed onto NM receptor sites located on a unit mass of the adsorbent. The adsorption reaction of gas molecules (Xe) onto receptor sites (S) should include a stoichiometric coefficient n as the following equation:
 (1)
(1)
The parameter n is an average number, which can be an integer or not, greater or smaller than 1. If n is greater than 1, it represents the number of molecules anchored on one site, it is a multi-molecular adsorption. If n is less than 1, it would represent “the fraction of molecule per site” [8,9], it is a multi-anchorage adsorption.
In our treatment, our starting point is the grand canonical partition function describing the microscopic of the adsorption process. The receptor site is supposed to be empty or occupied by one or more molecules. So, we define the state of occupation number Ni that expressed the situation in which this receptor site is placed [9,10]:
 (2)
(2)
where εi is the receptor site adsorption energy, μ is the chemical potential, Ni is the receptor site occupation state, and β is defined as 1/ kB T, where kB is the Boltzmann constant and T is the absolute temperature. The total grand canonical partition function related to NM receptor sites per surface unit, which we assume independent and identical, is equal:
 (3)
(3)
This total grand canonical partition function led to determine the average site occupation number which can be written [9,11]:
 (4)
(4)
When the thermodynamic equilibrium is reached according to the relation (1), the equality related to the chemical potential can be written as  , where is the chemical potential of adsorbed molecule, n is the number or fraction of molecules per site, and μm is the chemical potential of the gaseous molecule. The chemical potential can be written as [12,13]:
 (5)
(5)
Where zTr is the translation partition function which can be written as [8,10]:
 (6)
(6)
With m being the adsorbed molecule mass, V being the volume of the gas, h Planck’s constant and Λ is the Broglie thermal wavelength given by  .
.
The translation partition function per unit of volume can be also expressed as function of the saturated vapor pressure and the vaporization energy by the relation [9,10]:
 (7)
(7)
Where ΔEV the molar vaporization energy and PVS is the saturated vapor pressure.
Assume V to be 1 liter, the translational partition function of an Xe molecule at T=110 K is 1030. This means that 1030 quantum states are thermally accessible to the molecular system.
If there are n molecule(s) anchored per site, the total number of adsorbed molecules is given by:

In the following sections, we will establish analytical expression corresponding to the adsorption isotherm of Xenon on graphite on the basis of statistical physics treatment. We present the adequate grand canonical partition function and afterward the obtained model. We will discuss the role of the physicochemical parameters.
Theoretical model
Monolayer model: To develop the expression of the adsorbed quantity according to the pressure, we consider that a variable number of molecules N are adsorbed onto three types of independent sites. The number of the first type is N1M sites, the number of the second type is N2M and the number of the third type is N3M. We suppose that the adsorption onto the first type is carried out with the energy (−ε1), with the energy (−ε2) onto the second type and with the energy (−ε3) onto the third type. In this case, we can write the total grand canonical partition function as follows:
 (9)
(9)
With z1gc, z2gc and z3gc being the partition functions of one site of the three types. The grand canonical partition function in this case, for each type of receptor site, has the form:
 (10a)
(10a)
 (10b)
(10b)
 (10c)
(10c)
We obtain the expression of the adsorbed against the pressure:
 (Model 1)
With: 
In Model 1, there are nine fitting parameters: p1, p2, p3, n1, n2, n3, N1M, N2M and N3M. The correlation between experimental data and the analytical model is given by the correlation adjustment coefficient R2=0.995 which is a measure of the correctness of the fit. The fitting parameters of Model 1 are presented in Table 1.
| p1(Pa) | p2(Pa) | p3(Pa) | n1 | n2 | n3 | N1M(mmol/g) | N2M(mmol/g) | N3M(mmol/g) |
|---|---|---|---|---|---|---|---|---|
| 0.002 | 10.28 | 570 | 1.13 | 1.22 | 5.66 | 0.69 | 1.19 | 0.66 |
Table 1: Adjustment parameter values corresponding to the fitting Model 1.
Triple layer model: If we suppose that the site can be empty or occupied by one molecule adsorbed with the energy (−ε1), the second molecule adsorbed with the energy (−ε2) and the third molecule adsorbed with the energy (−ε 3).
The grand canonical partition function is written as:
 (11)
(11)
We obtain the adsorbed quantity versus the pressure which is written:
 (Model 2)
In Model 2, there are five fitting parameters: p1, p2, p3, NM and n. The correlation between experimental data and the analytical model is given by the correlation adjustment coefficient R2=0.983 which is a measure of the correctness of the fit. The fitting parameters of Model 2 are presented in Table 2.
| p1(Pa) | p2(Pa) | p3(Pa) | n | NM(mmol/g) |
|---|---|---|---|---|
| 0.007 | 10.38 | 564.78 | 1.90 | 0.7 |
Table 2: Adjustment parameter values corresponding to the fitting Model 2.
Multilayer model: We consider now that the type VI isotherm is due to multilayer adsorption process. So, there is complete formation of monomolecular layers before progressing to a subsequent layer which commonly associated with non-porous or macroporous adsorbents. The isotherm presents three partial saturations and a condensation phenomenon occurs at high pressure. To choose adequate model, we suppose that the layers are formed one after the other with different energy. We suppose that L1 layers of adsorbed molecules are formed with the first energy (-ε1), L2 layers with the energy (-ε2), L3 layers with the energy (-ε3) and infinite layers are formed with the energy ε4. The grand canonical partition function is written as:
 (12)
(12)
To determine the adsorbed quantity versus pressure we use the definition of the average site occupation number given by relation (8). We take  ,
,  ,
,  three energetic parameters, with

 are the molar adsorption energies and pvs is the saturated vapor pressure of the gas. Finally the adsorbed quantity Na has the following expression:
 (Model 3)
with f1, f2 and f3 are functions of the pressure and the parameters pi such as:
 (13)
(13)
 (14)
(14)
 (15)
(15)
In the expression of adsorbed quantity given by Model 3, there are seven parameters which are divided in two classes, the first is a steric aspect such as the number of molecules per site n and the density of receptor sites NM, and the number of layers L1, L2, the second aspect is energetic one given by the parameters p1, p2 and p3 which are function of the adsorption energy. The correlation between experimental data and the analytical Model 3 is given by the correlation adjustment coefficient R2=0.992. The fitting parameters of Model 3 are presented in Table 3.
| p1(Pa) | p2(Pa) | p3(Pa) | n | NM(mmol/g) | L1 | L2 |
|---|---|---|---|---|---|---|
| 0.005 | 10.22 | 566.29 | 1.52 | 0.92 | 1.3 | 6.4 |
Table 3: Adjustment parameter values corresponding to the fitting Model 3.
Fitting results and interpretation: We have adjusted the experimental data with the expression of the established models (Model 1, Model 2 and Model 3). We note that the experimental curve shows a high correlation with the proposed model when the coefficient of determination R2 is close to 1 and which is given by numerical simulation. It is true that in general, the coefficient of determination R2 is improved when the number of fitting parameters increases which is the case of our adjustment. Indeed, these parameters reflect physical magnitudes. This means that the adsorption phenomenon is better described when a maximum of physical magnitudes are included, thus the space of description of the phenomenon will be a more complete space. By fitting the experimental isotherm we have found that the adjustment coefficient is close to 0.995. The fitting of the experimental isotherm of Xe on graphite at 110 K demonstrates that the proposed Model 1 present a good correlation with the experimental curve.
In comparison with the other models, the Model 1 presents the best values of R2 which are close to the unit. Then we retain this model as an adequate model to characterize the adsorption of Xenon on graphite.
The parameters of the model give information about the number of molecules per site [10,11], the density of receptor sites and the adsorption energies. We summarize these parameters in two categories [[10,11]: on the one hand a steric (n) parameter reflecting the properties of anchorage between adsorbed molecules and receptor sites related to the geometry of molecule, on the other hand an energetic parameter giving the adsorption energy which characterizes the binding between the molecules and receptor site. The parameters of model such as number of molecules per site (n), the density NM and the energetic coefficients p1, p2 and p3 are presented in Table 1. The adsorption reaction (equation 1) expresses that the parameter n is a stoichiometric coefficient; it represents the number of molecules per site given in the expression of the model. It is also a steric coefficient which gives information on the position of the molecule at the adsorbent surface [9,11].
Energies of adsorption
Using the values of the dimensionless parameters p1, p2 and p3 and the pressure vapor saturation pvs, we calculate the molar adsorption energies  ,
,  and
and  :
:
 (16)
(16)
With: i=1, 2 and 3.
The adsorption energies of Xenon adsorbed on graphite at 110 K are presented in Table 4. The first energy gives information about the interaction between molecules and the surface, whereas the others represent the molecule-molecule interaction. The values of these energies showed that binding between the molecules and the surface takes place via a physical adsorption such as Vander Waals binding. The second and the third energies corresponding to the moleculemolecule interaction are inferior to the first energy.
| (kJ/mol) |
(kJ/mol) |
(kJ/mol) |
|---|---|---|
| 12.36 | 9.70 | 9.24 |
Table 4: Adsorption energies of Xenon/graphite at 110 K.
Adsorption entropy
In this section we present a detailed calculation of the value of the adsorption entropy. This value can be calculated on the basis of statistical physics. We start from the definition of the grand potential using the grand canonical partition function [14]:
 (17)
(17)
We can obtain the expression of the entropy then:
 (18)
(18)
 (19)
(19)
Finally the adsorption entropySa has the following expression:
 (20)
(20)
We notice, Figure 2 that for the isotherm studied; the entropy has three different behaviors below and above the particular points p1, p2 and p3. Indeed, the entropy increases with the adsorbed quantity before the half-saturation and decreases after this particular point. This is explained by the fact that when the adsorbed quantity is inferior to the one of p1, the molecule has various possibilities to choose a receptor site to be adsorbed and therefore the disorder increases at the surface with the adsorbed quantity. After this point, the adsorbent molecule has low probability to choose adsorbent site since the surface tends toward the saturation and therefore tends toward the order. The entropy can reach zero when the saturation is reached.
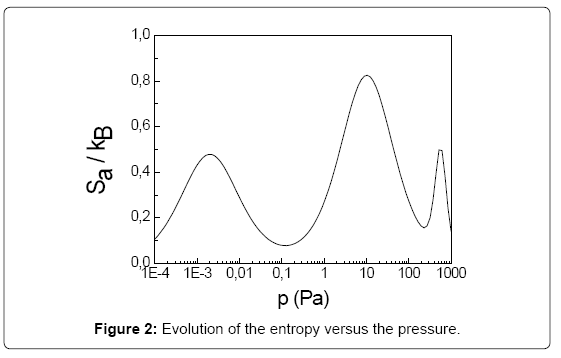
Figure 2: Evolution of the entropy versus the pressure.
Free enthalpy
The free enthalpy described the spontaneity of the system. It is given by the following relation [14]:
From Eq. (5), μ can be written in the variable p as  .
.
Where μ is the chemical potential of adsorbed molecule and Na is is the adsorbed quantity.
The free enthalpy G has the following expression:
 (22)
(22)
We notice, Figure 3 that for the isotherm studied, the free enthalpy is always negative, what translates that the reaction of adsorption evolves spontaneously.
Figure 3: Evolution of the free enthalpy versus the pressure.
Internal energy
The expression of internal energy is given by the following relation [14] as:
 (23)
(23)
The internal energy Eint has the following expression:
 (24)
(24)
We notice, Figure 4 that for the alloy studied, the internal energy is always negative and the increase of the pressure always pulls a rise in module of the internal energy of system.
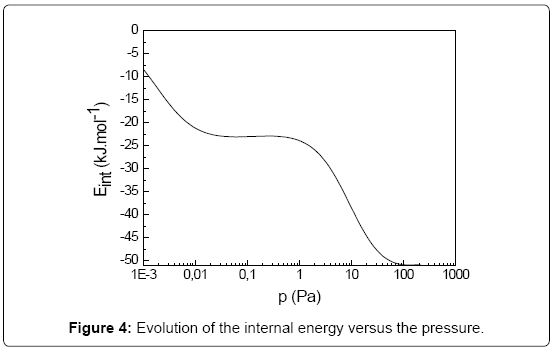
Figure 4: Evolution of the internal energy versus the pressure.
Using the grand canonical ensemble in statistical physics and applying some simplifying approaches, we have established new theoretical expressions to fit the adsorption isotherm of Xenon on graphite at 110 K. These models are thermodynamically consistent and the physicochemical parameters intervening in the adsorption process are taken account in the theoretical treatment. It was found that the proposed statistical treatment is sufficiently flexible to give a good representation of experimental data. Thanks to the theoretical modeling; we can well understand the behavior of the adsorption isotherms of Xenon and thus the corresponding adsorption phenomenon at microscopic level. Form the experimental isotherm we can determine the physicochemical parameters related to the adsorption process. All the values of these parameters, in the various equations already determined, may be obtained by fitting procedures and deduced for such considered experimental isotherm.