Journal of Agricultural Science and Food Research
Open Access
ISSN: 2593-9173
ISSN: 2593-9173
Research Article - (2023)Volume 14, Issue 2
In Ethiopia, agriculture is expanding onto the most erosion sensitive sites. To protect these sites, the government widely implemented Soil and Water Conservation (SWC) measures. However, the effects of these measures on soil physicochemical properties are not well investigated and documented in most watersheds. This study was conducted in Asera watershed, to investigate the effects of soil and water conservation measures on selected soil physicochemical properties along soil depths on adjacent cultivated lands. The experimental design was randomized complete block design. The treatments considered four soil and water conservation measures (Stone-Faced soil bund (SF), soil bund stabilized with Besom Grasses (BG), Soil Bund (SB) and un-Conserved Croplands (C)) and three soil depths (0-15 cm, 16-30 cm and 31-45 cm) in factorial combinations, with three replications. The results showed that soil texture, Soil Moisture Content (SMC), soil ph, cec, total N, available P, and available K were significantly affected by swc measures. Soil organic matter, CLAY, smc, bulk density, and total N were significantly affected by soil depth. Except available K, cec, bulk density, and smc the other soil properties showed decreasing trend down the profile. Although soil properties were improved due to conservation measures, most are by far below the critical levels. Therefore, further improvement of the organic matter and introduction of integrated soil and water conservation measures, which could reduce the soil loss and sustainably improve soil production, fertility and the livelihood of the smallholders are recommended.
Soil and water conservation; Soil property; Soil depth; Un-conserved; Watershed
Recognizing soil degradation as a major environmental and socio-economic problem, the government of Ethiopia has made several interventions. As a result, large areas have been covered with terraces, stone faced soil bunds, area closures, planting of different grasses, shrubs and trees on the conservation measures. More than 85% of the country’s population live in rural areas and derive their livelihoods from agricultural activities. Therefore, soil and water conservation in Ethiopia is not only related to improvement and conservation of the environment but also it is a key factor for sustainable development of the agriculture sector and the economy of the country at large [1].
Soil and water are the most important natural resources in rain fed agriculture. Loss of crop productivity occurs not only due to fertility depletion but also because of moisture stress at different growth stages. Soil conservation activities can change the physical conditions of the soil like soil organic matter content, soil structure, water holding capacity, soil bulk density, soil porosity and its workability. Besides, dejene found that plots with soil bunds are more productive as compared to the plots without bunds [2].
According to moisture availability to plants is an important land quality that is relevant in a wide variety of circumstances. Amount and distribution of rainfall, potential evapotranspiration, available water capacity of the soil and soil type are some of the land characteristics, which affect moisture availability to crop growth. One of the major limiting factors for agricultural production in Ethiopia is soil water losses through surface runoff and evaporation [3].
Due to increasing population pressure, landless farmers are cultivating fragile lands without effective swc measures in the highlands of Ethiopia. According to undulating topographic conditions and farming practices, which do not consider swc measures could aggravate the soil lose by erosion and hence reduce soil fertility, which in turn could affect production and productivity as well as aggravating food security.
Highlands of north Gondar is one of the most soil erosion vulnerable parts of Ethiopia, as the area has high erosive force of rainfall, intensive farming on steep slope, and more frequent land cover change.
To prevent the observed problem related to soil and water losses and subsequent crop yield reduction, different SWC measures have been introduced to the Asera watershed since the last four decades. However, its effectiveness in improving the soil physical and chemical properties has not investigated yet. Therefore, this study was conducted to evaluate the effect of soil and water conservation measures on some selected soil physico-chemical properties in different soil depths in the study watershed [4].
Description of the study area
The study was conducted in Asera watershed, located in debark district of north gondar zone of the amhara national regional state. Asera watershed is found at about 8 km distance from debark town. Geographically, the watershed is located between 130 2ʹ25ʺ N to 13010ʹ48ʺ N and from 37049ʹ56ʺ E to 37056ʹ4ʺ E (Figure 1).

Figure 1: Location of the Study Site in Asera Watershed.
The total coverage of the study watershed is about 9012 ha. The elevation of the watershed ranges between 2169 m and 3043 m above sea level. The annual mean minimum and mean maximum temperatures of the area were 2.50°C and 250° C, respectively. It receives from 900 to 1800 mm average annual minimum and maximum rainfall respectively. Agricultural system in the area is predominantly subsistent and rain-fed.
The farming system is a mixed system of crop and livestock. The major crops growning in the area are wheat barley and fababean [5].
Treatments and experimental procedures
The effects of different soil and water conservation measures on selected soil properties along soil depths were studied by collecting soil samples from four different soil and water conservation measures at three-soil depths. The experimental design for this study was Randomized Complete Block Design (RCBD) in which the soil and water conservation measures and soil depths were considered as treatments in factorial arrangement. About 36 composite soil samples were collected from a triplicate combination of four types of SWC measures (Stone-Faced Soil Bund (SF), soil bund stabilized with Besom Grasses (BG), Soil Bund (SB) and un-Conserved Croplands (C)) and three soil depths (d1 (0-15 cm), d2 (16 cm-30 cm) and d3 (31 cm-45 cm)).
To select representative bund types in the watershed, a preliminary survey was made together with development agents working in the study area and local farmers. The identified bund types were classified in to Stone-Faced Soil Bund (SF), soil bund stabilized with Besom Grasses (BG), Soil Bund (SB) and un- Conserved Croplands (C). Further, the identified bund types were delineated using GPS. At office level, a base map showing the boundary of the watershed and specific sampling points were produced in the GIS environment using Arc map 10.1. In order to avoid the impact of soil type differences and slope positions on the soil physico-chemical properties, the bund types were purposively selected to have similar slope and soil conditions. Clinometer was used to select bunds with similar slope conditions 6%-10% slope range.
Randomly allocated representative sampling plots were established under each SWC measures and soil depths with a square size of 2 m × 2 m. The pits were dug at four corners and center of the plots using auger. From each sampling plot, composite soil samples were collected from five spots, from the center of the plot and from other diagonally distributed four spots. The collected samples from each sampling plots were thoroughly mixed and a representative one-kilogram composite samples were stored in labeled clean plastic bags. Then it was transported to Amhara Design and Supervision Works Enterprise (ADSWE) soil testing laboratory for further laboratory analysis. In the laboratory, soil samples were air-dried, ground using mortar, pestle and passed through 2 mm sieve for the determination of most soil properties except total nitrogen and organic matter contents, which then passed through 0.5 mm sieve.
At the same time, 36 undisturbed soil samples were collected from each SWC measures at the center of the spot using core sampler to determine soil bulk density and soil moisture content, their weight was measured directly at the field. Soil moisture content and bulk density was determined after oven drying the soil samples for 24 hours at 105°C. Bulk density was determined by dividing the oven dry mass of soil (105°C) by the volume of the core sampler (diameter=7cm and height=5cm).
Soil sample analysis
Soil texture was analyzed by the bouyoucous hydrometer method and soil textural class was determined by using USDA texture triangle.
Bulk density, total porosity, and moisture content were calculated using the following formula
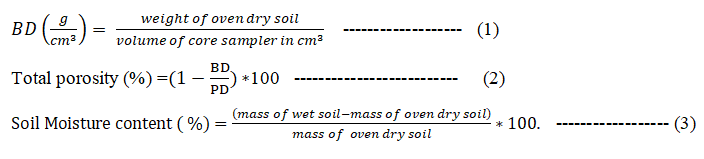
The Organic Carbon (OC) content of the soil was analyzed by following the dichromate oxidation method and percent Soil Organic Matter (SOM) was obtained by multiplying percent soil OC by a factor of 1.724 following the assumptions that SOM is composed of 58% carbon as described by walkley and black. Soil pH was determined potentiomerically in a 1:2.5 soil to water suspension using a pH meter with a combination of glass electrodes. Total Nitrogen (N) was determined using the microkjeldahl digestion, distillation and titration procedure as described by bremner and mulvaney. Available phosphorus was measured by following the olsen method. Available potassium was determined after extracting the soil samples by ammonium acetate at pH 7.0. Available potassium was analyzed by flame photometer. To determine the Cation Exchange Capacity (CEC), the soil samples were first leached with 1 M ammonium acetate, washed with ethanol and the adsorbed ammonium was replaced by Na. Then, the CEC was measured titrimetrically by distillation of the ammonia that was displaced by sodium.
Data analysis
The soil physicochemical properties were subjected to analysis of variance tests using SAS software version 9.1. Two-way Analysis of Variance (ANOVA) was executed to evaluate the statistical significant effects of soil and water conservation measures and soil depths on selected soil physico-chemical properties. For means with significant (P<0.05) differences, mean comparison was performed using the Least Significant Difference (LSD at 5% level of significance). Simple correlation analysis was done by Pearson’s correlation matrix to reveal the magnitudes and directions of relationships between selected soil parameters with in soil depths [6].
Effects of SWC measures and soil depth on soil physical properties
Soil texture: The results of this study revealed that soil particle sizes were highly significantly (P<0.01) varied among the studied soil and water conservation measures. However, Sand and silt fractions were not significantly (P<0.01) affected by soil depths. Conversely, soil particles were not affected by the interaction of soil and water conservation measures and soil depths. Sand content was significantly (P<0.05) and negatively correlated with soil organic matter and total nitrogen value (r=-0.64 and r=-0.68) respectively. Comparatively higher sand content (50.11%) was obtained from the un-conserved croplands whereas the lower sand content was obtained from the soil bund stabilized with besom grasses (23.11%). The reason for the high sand content in the un-conserved croplands might be removal of the top soil with high clay content transporting and depositing to the lower slope position or due to leaching of clay particle down the soil profile leaving sand particles, which are relatively resistant to erosion on the surface soil layer.
This result is in agreement with leta who reported that higher amount of sand particles accumulated in the un-conserved croplands. Also stated that, soil sand content was significantly affected by swc measures. In addition, reported that sand particle is larger and heavier in weight and is not easily leached down the soil profile. The other reason may also be soil particle crushing by plowing and high amount of rainfall in the area, which could facilitate the export of finer clay and silt particles by water erosion and leaves behind the sand particles. Also reported that sand content was significantly (P<0.05) and negatively correlated with silt particles.
Higher sand content (39.25%) was obtained from the surface soil (0 cm-15 cm) depth whereas the lower sand content (33.58%) was obtained from sub soil layer (31 cm-45 cm) (Table1). This might be the sand content decreased from surface to sub surface soil layer. This indicates that the removal of finer soil particle from the surface by rain fall, intensive and continues cultivation, to increase sand content on the surface soil layer. The general increase in contents of sand reflects the decrease pattern of bulk density values in the surface soil layer. This implies that no excessive compaction and restriction to root development. Sand and silt contents decreased when the clay content increased along the depth from surface to subsurface soils. The increase in clay contents with depth under cultivation land might be due to translocation of clay from surface to subsurface layers, which ultimately increase the proportion of sand and silt contents in the surface soil layers.
Similarly, the clay content showed significant (P<0.01) variation among the studied soil and water conservation measures and soil depths. They are negatively and significantly, (P<0.01) correlated with sand content, but positively and significantly correlated with soil moisture. Relatively higher clay content was obtained from soil bund stabilized with besom grasses whereas the lower (18%) from the un-conserved croplands. On the other hand, relatively higher silt content (42%) was obtained from stone-faced soil bund and the lower (31.89%) was obtained from un-conserved croplands (Table 1). This indicated that soil bund, stone-faced soil bund and soil bund stabilized with besom grasses are important conservation measures in saving fine soil particles than un-conserved croplands. This result is in agreement with, stated that bunds can reduce run-off effects, the similarity of soil clay and silt fractions between different bund types studied were related to their protective roles.
Based on the soil textural triangle, soil of the studied soil and water conservation measures and soil depths was found to be loam in texture, which exhibits relatively equal proportions of the soil separates (clay, silt and sand). From agricultural point of view, loam soil is most favorable as its capacity to preserve water and nutrients is better than sandy soils while its drainage, aeration, and cultivation properties are more favorable than clayey soils. However, under certain specific conditions for some specific plant species, sandy or clayey soil may also be more suitable than a loam soil. Relatively higher value of clay content (30.50%) was recorded at the sub surface (31-45 cm) soil layers. Statistically D1 and D2 had similar clay content (Table 1). In agreement to this result, reported that the higher percentage of clay was observed in the sub surface soil, due to migration of finer soil particle down the depth and accumulation of sand particles at the surface soil; the increase in clay content with increasing depth. This result is in agreement with, also stated that intensive and continuous cultivation of land might lead the removal of clay particles on the surface soil layer, which occur downward accumulation of clay particles from the subsurface soil layers. Moreover, due to mixing up of surface and subsurface soil layers during deep tillage activities, translocation of clay particles from top soil layer to the deep layer and selective removal of clay particles from the surface soil by sheet and rill erosion [7].
| SWC measures | Soil parameters | Soil textural class | |||||
|---|---|---|---|---|---|---|---|
| BD (g/cm3) | SMC (%) | TP (%) | Sand (%) | Silt (%) | Clay (%) | ||
| C | 1.41 | 05.03 | 46.89 | 50.11 | 31.89 | 18.00 | Loam |
| SB | 1.39 | 13.96 | 47.56 | 40.89 | 39.56 | 19.56 | Loam |
| SF | 1.37 | 17.00 | 48.37 | 33.11 | 42.00 | 24.89 | Loam |
| BG | 1.35 | 19.37 | 48.97 | 23.11 | 33.78 | 43.11 | Clay |
| LSD (0.05) | NS | 2.55 | NS | 6.25 | 5.57 | 3.71 | - |
| Soil depths | |||||||
| D1 (0-15 cm) | 1.34 | 10.52 | 49.43 | 39.25 | 37.92 | 22.83 | Loam |
| D2 (16-30 cm) | 1.37 | 14.01 | 48.47 | 37.58 | 36.58 | 25.83 | Loam |
| D3 (31-45 cm) | 1.43 | 16.99 | 45.92 | 33.58 | 35.92 | 30.50 | Sandy loam |
| LSD (0.05) | 0.06 | 2.21 | 2.18 | NS | NS | 3.21 | - |
| CV (%) | 4.97 | 18.86 | 5.39 | 17.37 | 15.49 | 14.39 | - |
Note: C=un-conserved; SF=Stone-Faced soil bund; BG=soil bund stabilized with Besom Grasses; SB=Soil Bund; pH=soil acidity or alkalinity; SOM=Soil Organic Matter; CEC=Cation Exchange Capacity; TN=Total Nitrogen; Av. P=Available Phosphorus and Av. K=Available Potassium; D=soil depth; NS=Non-Significant. Means within a column followed by the same letter are not significantly different at P<0.05.
Table 1: Effect of SWC measures and soil depths on selected soil physical properties in asera watershed.
Soil bulk density, moisture content and total porosity
The analysis of variance results revealed that soil bulk density was highly significantly (P<0.01) affected by soil depths. However, it was not significantly affected by soil and water conservation measures and their interaction with soil depths. Soil bulk density showed significant (P<0.05) and negative correlation with total N (r=-0.63) and with SOM content (r=-0.66). Comparatively higher bulk density (1.41 g cm-3) was recorded from the un-conserved croplands. This might be due to the soil compaction, removal and transportation of fertile top soil by runoff and lack of soil and water conservation measures, which is leading to the removal of soil organic matter and crop residues. Meanwhile, comparatively lower (1.35 g cm-3) bulk density value was recorded from soil bund stabilized with besom grasses (Table 1). This might be attributed to the relatively higher SOM content from the remains of biological materials.
In line with this finding, reported that there was no significant difference in soil bulk density values under conservation measures and unlike the un-conserved croplands, which had significantly higher, bulk density than the land conserved with swc measures. In another study, it was also reported that the reduction in bulk density was related to the presence of significantly higher organic matter and decay of plant residue on the land under soil and water conservation measures. Comparatively lower bulk density value was reported as advantageous condition for a better root growth, improved aeration and increased infiltration. Whereas high bulk density exhibited a poor physical condition for plant growth.
Relatively lower mean value (1.34 g cm-3) of bulk density was obtained from the surface soil layer (D1) which is at par with D2 while relatively higher bulk density (1.43 g cm-3) was obtained from the sub surface soil layer (Table 1). Relatively the higher bulk density at sub surface soil layer might be recognized to relatively lower SOM content, relatively high clay content, the weight of the overlying layer and low activity of soil organisms as reported. In addition, the increase in soil bulk density down the soil profile this might be attributed due to the migration of clay particles in sub surface soil layer. In agreement with this result, also reported increment in soil bulk density down the soil profile. Likewise, reported that the lower bulk density in the soils surface layer due to the increasing of organic matter contents at the surface soil layer. The bulk density of the studied soils at the depth of upper 45 cm were found to be less than (1.61g cm-3), which is common and acceptable for loam soils. The soil bulk density status in all studied soil and water conservation measures and soil depth was found to be moderate.
Soil Moisture Content (SMC) showed highly significant (P<0.01) variation with respect to soil and water conservation measures and soil depth. However, their interaction with soil depth was not statistically significant. Comparatively the higher moisture content (19.37%) was obtained from the soil bund stabilized with besom grasses and the lower (5.03%) observed at un-conserved croplands. Un-conserved croplands, which is characterized by less vegetation cover and lacks soil and water conservation measures [8].
The observed significantly higher moisture content in bund types, which are stabilized by besom grasses and stone-faced soil bund, could be related to the availability of relatively higher SOM content, finer soil particle sizes and also due to their role in decreasing the speed of running water and increasing their infiltrations. In a similar study conducted by haweni relatively higher moisture contents observed in soils with conservation structures were related to the reduction of runoff length and speed by these structures and subsequent increase in infiltration rates. According to Leta accumulation of crop residue inputs and better soil humus contents are likely along the conservation structures, which could improve soil aggregation and thereby soil structure, infiltration rate and water holding capacity of soils.
Relatively higher (16.99%) mean value of soil moisture was obtained at subsurface (16 cm-45 cm) soil layer whereas the relatively lower (10.52%) soil moisture content was obtained in the surface (0 cm-15 cm) soil layer. Due to the contributions of conservation structures, which slow down the runoff velocity and giving enough time to infiltrate into the soil rather than running down the slope. This also indicates that the water stored at surface soil layer it is visible for evaporation than infiltrate in the subsoil layer. Surface soil layer also tend to be more drought prone, because they hold less water and thus dry out faster than deeper soils. Water lost to runoff on shallow soils would instead be absorbed by a deeper soil. In addition, deep soils allow the roots to explore a greater volume, which means the roots can retain more water and plant nutrients.
The analysis of variance reflected that total porosity was highly significantly (P<0.01) influenced by soil depth. However, it did not show significant variation with respect to soil and water conservation measures and their interaction effect with soil depths. Relatively higher total porosity (48.97%) was recorded from the soil bund stabilized with besom grasses and the relatively lower porosity (46.88%) was from the un-conserved croplands (Table 1). Comparatively higher mean value of total porosity was obtained from the surface soil layer (D1) which is at par with (D2) while comparatively the lower TP was observed in sub surface (D3) soil layer. In line with this finding, reported that decrease in total porosity with in subsurface soil layer as result of increasing compaction, decreasing of rooting effect and organic matter content.
Effects of swc measures and soil depth on soil chemical properties
Soil ph, Soil Organic Matter (SOM) and cation exchange capacity: The analysis of variance results revealed that soil pH was significantly (P<0.05) differed with respect to the studied soil and water conservation measures. Relatively, it was not significantly affected by soil depth and their interaction with soil and water conservation measures. Relatively, higher pH (5.37) was obtained from soil bund stabilized with besom grasses. While relatively the lower pH (5.32) was obtained from unconserved croplands (Table 2). In agreement to this result, and reported that, soil pH, organic matter and cation exchange capacity were significantly improved with the use of swc measures supported by elephant grass and sesbania. The authors further stated that the presence of relatively higher pH under elephant grass and sesbania was attributed to the presence of high organic matter, clay fraction, and better cation exchange capacity in the conserved lands. Moreover, soil pH was reported to be affected by increased leaching, soil erosion, depletion of organic matter, continuous and intensive farming practices.
Relatively lower pH value recorded in un-conserved cropland might be attributed to the effects of continuous cultivation, which might have exposed the soils to erosion removal of basic cations as well as their removal from the field via crop harvest. These results are in agreement with the work of those of several authors who reported substantial reduction of pH in surface soils subject to long-term cultivation as compared to the unconserved croplands. In line with this finding, reported that there was no significant difference in soil pH under soil depth [9]. Generally, the higher 5.5 pH was observed in the stone-faced soil bund while the lower 5.32 pH from un-conserved croplands. According to a pH rating suggested by hazelton and murphy the pH of the soil in all SWC measures and un-conserved croplands is found to be strongly acidic.
The analysis of variance results revealed that soil OM highly significantly (P<0.01) affected by soil depth and soil and water conservation measures. However, their interaction was not significantly different. Relatively higher som (2.4%) was obtained from soil bund stabilized with besom grasses while relatively lower (1.05%) from the un- conserved croplands (Table 2). Soil organic matter showed significantly (P<0.01) and positively correlation with Av. P. In a similar study conducted in different parts of ethiopia, also found significant and positive correlation between soil om and total N values. The observed increase in soil organic matter content in the conserved croplands could probably be attributed to the better crop residue management, better accumulation and retention of SOM by the constructed bunds. Similar results were reported by different authors who tried to relate better SOM values in conserved croplands to accumulation and decomposition of different biomass in the constructed bund type. Whereas relatively lower SOM values observed in un-conserved croplands could be due to high rate of oxidation of soil organic matter as a result of continuous cultivation for long period of time without fallowing, removal of green material, loss in the form of decaying leaves, stems and roots from surface soil due to lack of physical barriers. In addition, due to burning of bush, high rate of mineralization and crop removal for livestock feeding, fencing, and building purposes without incorporating crop residue to the soil could reduce soil organic matter.
Alemayehu also reported that soil under un-conserved treatment was found to be exhibit lower soil OM content than cropland treated by SWC measures. In general, the overall mean SOM values in the SWC measures ranged from 1.05% to 2.4%. According to SOM ratings suggested by Hazelton and Murphy the soil OM status in all studied soil and water conservation measures was found to be medium and this might be lower in un-conserved croplands.
Relatively higher mean value of soil OM (2.22%) content was found in surfaces soil whereas relatively the lower (1.46%) was in subsurface soil layer (Table 2). This indicates that soil and water conservation measures increase amount of SOM content in the surface soil layer. However, removal of the top soil by erosion and strong leaching of basic nutrients down the profile may result in infertile soil and unsustainable agricultural production. Also noted that the lowest the soil organic matter content, leads to the removal of higher TN in the soil. The content of soil OM as well as number and activity of soil microorganisms decrease rapidly with increasing soil depth [10].
The analysis of variance results revealed that CEC was significantly affected (P<0.05) by soil and water conservation measures, while the main effect of soil depth and their interaction, were not statistically different. Comparatively higher CEC (28 cmole (+) Kg-1) was obtained from soil bund stabilized with besom grasses. Meanwhile, comparatively the lower CEC (21 cmole (+) Kg-1) was obtained from the unconserved croplands (Table 2).
| SWC measures | Soil parameters | |||||
|---|---|---|---|---|---|---|
| SOM (%) | TN (%) | Av. P (ppm) | Av. K (ppm) | CEC (cmol (+) kg-1) | pH (H2O) | |
| C | 1.05 | 0.05 | 9.10 | 36.90 | 21 | 5.32 |
| SB | 1.95 | 0.10 | 12.81 | 47.72 | 24 | 5.50 |
| SF | 1.98 | 0.10 | 25.00 | 51.41 | 26a | 5.51 |
| BG | 2.42 | 0.12 | 40.40 | 61.80 | 28 | 5.37 |
| LSD (0.05) | 0.34 | 0.02 | 3.45 | 9.17 | 2.79 | 0.15 |
| Soil depths | ||||||
| D1 (0-15 cm) | 2.22 | 0.11 | 22.74 | 49.68 | 23.27 | 5.46 |
| D2 (16-30) | 1.85 | 0.09 | 21.79 | 47.56 | 24.48 | 5.43 |
| D3 (31-45 cm) | 1.46 | 0.07 | 20.97 | 51.17 | 26.22 | 5.46 |
| LSD (0.05) | 0.3 | 0.01 | NS | NS | NS | NS |
| CV (%) | 19.07 | 16.64 | 16.2 | 18.96 | 11.6 | 2.85 |
Note: C=un-conserved; SF=Stone-Faced soil bund; BG=soil bund stabilized with Besom Grasses; SB=Soil Bund; pH=soil acidity or alkalinity; SOM=Soil Organic Matter; CEC=Cation Exchange Capacity; TN=Total Nitrogen; Av. P=Available Phosphorus and Av. K=Available Potassium; D=soil depth; NS=Non-Significant. Means within a column followed by the same letter are not significantly different at P<0.05.
Table 2: Effect of SWC measures and soil depths on selected soil chemical properties in Asera watershed.
The observed relatively higher CEC values in conserved croplands could be related to better accumulation of SOM and clay fractions than the un-conserved croplands. In agreement with these results, different researchers also pointed out the role of soil and water conservation measures conserving soil organic matter and hindering the transportation and translocation of clay particles there by increasing cation exchange capacity of the soil. In terms of established ratings the CEC status in conserved croplands ranged from high and medium CEC status was observed in un-conserved croplands. This increase of CEC in conserved land is in agreement with the findings of who stated that very high CEC recorded in conserved land relatively due to high content of clay and OM.
Relatively higher CEC (26 cmole (+) Kg-1) was recorded in the sub surfaces soil whereas relatively lower (23.27 cmole (+) Kg-1) was recorded from the surface soil (Table 2). Cation exchange capacity was significantly and positively correlated with clay particles (Table 3). In agreement with this result, reported that increased CEC with soil depth, which could be due to strong association between with clay particle and CEC. The increment of CEC in sub surface soil was recognized to the leaching of exchangeable cations down the sub surface soil layer [11].
| Parameter | OM | TN | Ava. P | Ava. K | CEC | Silt (%) | Clay (%) | Sand (%) | pH (H2O) | BD |
|---|---|---|---|---|---|---|---|---|---|---|
| TN | 0.99** | |||||||||
| Ava. P | 0.71 | 0.72 | ||||||||
| Ava. K | 0.60 | 0.61 | 0.77 | |||||||
| CEC | 0.5 | 0.56 | 0.75 | 0.71 | ||||||
| Silt (%) | 0.4 | 0.43 | -0.06 | 0.07 | 0.32 | |||||
| Clay (%) | 0.43 | 0.46 | 0.90 | 0.77 | 0.77 | -0.3 | ||||
| Sand (%) | -0.64 | -0.68 | -0.90 | -0.83 | -0.95 | -0.18 | -0.88 | |||
| pH | 0.27 | 0.3 | -0.18 | 0.08 | 0.21 | 0.67 | -0.26 | -0.06 | ||
| BD | -0.66 | -0.63 | -0.41 | -0.5 | -0.04 | -0.18 | -0.14 | 0.24 | -0.02 | |
| MC | 0.5 | 0.54 | 0.71 | 0.73 | 0.92 | 0.22 | 0.75 | -0.88 | 0.25 | -0.003 |
Note: BD=Bulk Density (g/cm3); MC=Moisture Content (%); pH=soil acidity or alkalinity; OM=Organic Matter (%); CEC=Cation Exchange Capacity (cmol (+) kg-1); TN=Total Nitrogen (%); Ava. P=Available Phosphorus (ppm); Ava. K=Available Potassium (ppm)
Table 3: Pearson correlation among different physical and chemical properties of soil in Asera watershed.
Total Nitrogen (TN), Available Phosphorus (Av. P) and Available Potassium (Av. K)
The analysis of variance results revealed that total nitrogen was highly significantly varied (P<0.01) among SWC measures and soil depth. However, their interaction with soil depths was not statistically different. Total nitrogen was significantly and negatively correlation with BD and sand content, and positive correlation with SOM. Relatively higher TN (0.12%), was obtained from soil bund stabilized with besom grasses while relatively the lower TN (0.5%), was obtained from un-conserved croplands.
The conserved croplands have higher TN content than unconserved one. These variations might be attributed to implementation of soil and water conservation measures and subsequent accumulation and maintenance of better SOM reserves, which are considered as a major source of TN in soils. Similar research outputs have tried to relate soil bund stabilized with grasses with an increased biomass production in general and increased in SOM content in particular; organic matter decomposition in turn to increased nitrogen content of the soil [12].
Comparatively higher TN (0.11%) was obtained from the surface soil. Meanwhile, comparatively the lower TN (0.07%) from the subsurface soil layers. This could be attributed to the addition of plant residues and soil and water conservation measures. The total nitrogen content of a soil is directly associated with its organic matter content. Thus, variation in contents of total nitrogen is closely linked to its contents of organic matter; this pattern suggested that the main source of organic carbon and total nitrogen is organic matter.
According to a rating by hazelton and murphy when value of total nitrogen (%) >0.5, it is rated as very high, 0.25-0.50 high, 0.15-0.25 medium, 0.05-0.15 low (deficient), and <0.05 very low. Hence, as TN value for surface soils in the study site ranges between 0.05%-0.15%, they are categorized as soils having low TN status. These might be attributed to low fertilizer application rates, harvest removal, intensive tillage, and leaching.
The analysis of variance results revealed that Available phosphorus was highly significantly varied (P<0.01) among SWC measures, while the main effect of soil depths and their interaction were not statistically different. Relatively higher Av. P (40.4 ppm) was obtained from soil bund stabilized with besom grasses while relatively the lower Av. P (9.1 ppm) was obtained from un-conserved croplands.
In line with this result, reported that the relationship between higher soil organic matter content in the conserved croplands to relatively higher available phosphorus status. Reported that soils from soil bund stabilized with grasses had higher concentrations of available P than soils from un-conserved cropland. The lower content of available P in the un-conserved croplands was also reported to be consistent with the higher sand content of the soil. According to FAO nutrient ratings, available P status in conserved croplands ranged from medium to very high except that of low available P status was observed in un-conserved croplands. This result implies that implementation of soil and water conservation measures can maintain soil fertility by reducing the removal of relatively fertile and phosphorus rich surface soil [13].
Relatively higher (22.74 ppm) Av. P was obtained in the surface soil .Whereas, relatively the lower was obtained (20.97 ppm) in the subsurface soil layers. In line with this, finding lemma and terefe reported that there was no significant difference in soil available P under soil depth and unlike the sub surface soil layer, which had significantly lower Av. P than surface soil layer. Leta also reported that phosphorus is more concentrated in the surface soil layer. Like available phosphorus, available potassium (Av. K) status in the study area highly significantly (p<0.01) affected by the type of soil and water conservation measures constructed. However, their interaction effect with soil depths was not statistically significant. Comparatively higher (61.6 ppm) available potassium was obtained from soil bund stabilized with besom grasses while the lowest available potassium (36.9 ppm) was obtained from un-conserved croplands as shown in Table 2. According to FAO nutrient ratings, the available potassium status in all studied soil and water conservation measures and un-conserved croplands was found to be low. These results agree with the similar findings and who stated that Av. K and Av. P concentrations in croplands with soil conservation measures were found to be significantly higher than in the non-conserved croplands.
Comparatively higher (51.17 ppm) value of Av. K was obtained in the sub surface soil and the lower was obtained (49.68 ppm) in the surface soil layers might be attributed to leaching down the profile. In line with this result, also reported that available potassium content of the soil was increasing down wards in the soil depths [14].
A study was conducted to evaluate the effects of soil and water conservation measures on selected soil physico-chemical properties along soil depths in asera watershed. The experimental design was randomized complete block design. The treatments considered four soil and water conservation measures (Stone-Faced soil bund (SF), soil bund stabilized with Besom Grasses (BG), Soil Bund (SB) and un-Conserved Croplands (C)) and three soil depths (0 cm-15 cm, 16 cm-30 cm and 31 cm-45 cm) in factorial combinations, with three replications. Soil texture, smc, soil ph, cec, total n, available p, and available k were significantly affected by swc measures. Moreover, soil organic matter, clay, smc, bulk density, and total n were significantly affected by soil depth. Most of soil physicochemical properties were significantly higher in crop land conserved through soil bund stabilized with besom grasses. The un-conserved croplands have higher soil bulk density. Soil bulk density and moisture content values significantly increased down the soil depths; whereas total nitrogen and organic matter values decrease down the soil depths. Generally, soil properties are relatively better on the conserved farmlands than on the unconserved one. The observed strongly acidic conditions in the watershed should be reclaimed. Organic and inorganic fertilizer applications are recommended to alleviate the observed soil fertility problems. Further detailed study should be conducted to the effects of soil and water conservation measures on the availability of other macro and micronutrients, and productivity of different crops in the watershed.
The authors would like to thank university of gondar for financing the research. We also give special thanks to gondar agricultural research center staff for their cooperation during physical soil property analysis.
Citation: Hagos A, Jembere K, Feyisa T (2023) Effects of Soil and Water Conservation Measures and Soil Depths on Selected Soil Physico- Chemical Properties at Asera Watershed, Northern Ethiopia. J Agri Sci Food Res. 14:144.
Received: 01-Sep-2020, Manuscript No. JBFBP-20-6328; Editor assigned: 04-Sep-2020, Pre QC No. JBFBP-20-6328(PQ); Reviewed: 18-Sep-2020, QC No. JBFBP-20-6328; Revised: 17-Apr-2023, Manuscript No. JBFBP-20-6328(R); Published: 01-Jun-2023 , DOI: 10.35248/2593-9173.23.14.144
Copyright: © 2023 Hagos A, et al. This is an open-access article distributed under the terms of the creative commons attribution license which permits unrestricted use, distribution and reproduction in any medium, provided the original author and source are credited.