Journal of Clinical and Experimental Ophthalmology
Open Access
ISSN: 2155-9570
ISSN: 2155-9570
Research Article - (2020)Volume 11, Issue 6
Retinal prostheses provide blind patients with the ability to detect motion and locate large objects. Future implants will require smaller electrodes to improve resolution, but increased charge density may result, creating a safety concern. We developed a novel in vivo method to study the effects of electrical stimulation in the retina using real time Optical Coherence Tomography (OCT) imaging combined with micropositioning a stimulating electrode. We observed that electrical stimulation settings with both pulse rates at and greater than 100 Hz as well as charge density 1.22 mC/cm2 and above resulted in retinal thickening within minutes of stimulation, that affected several retinal layers. We showed with statistical significance that the median difference between the retinal thickness before and after stimulation was different from zero. In summary, both high rate and high charge density were required to create retinal thickening. The stimulus levels at which thickening was noted in our study were significantly higher than the parameters currently used in humans.
Retinal stimulation; Optical coherence tomography; Retinal implant; Retinal thickening; Stimulating electrode; Retinal prostheses; Focal percepts; Retinitis pigmentosa; Electrical stimulation safety; Stimulation safety
OCT: Optical Coherence Tomography; FA: Fluorescein Angiography; RP: Retinitis Pigmentosa; AMD: Aged-Related Macular Degeneration; ILM: Inner limiting Membrane; IPL: Inner Plexiform Layer; INL: Inner Nuclear Layer; MS: Millisecond; MIn: Minutes; Hz: Hertz; mC: Millicoloumb; cm: Centimeter; mm: Millimeter
Retinitis pigmentosa (RP) [1] and age-related macular degeneration (AMD) [2] are two diseases that affect primarily the photoreceptor layer, while leaving the bipolar cells and ganglion cells relatively intact [3]. These remaining cells allow the retina to be electrically stimulated to restore a sense of vision. Retinal prostheses have demonstrated the capability to elicit the sensation of light and to give implanted patients the ability to detect motion and locate large objects [4,5]. There are currently three different types of retinal prostheses based on their implant location:
Epiretinal: Refers to an implant placed on the ganglion cell side allowing direct stimulation to the final output of the retina [6-8]. Epiretinal implantation has the advantage of using the vitreous cavity for heat dissipation [9,10].
Subretinal: Refers to an implant placed behind the retina, in the space previously occupied by the photoreceptors [11,12]. Subretinalimplantion has the advantage of not having to tack the electrode to the retina but instead keeping the electrode in place by pressure on the retina.
Suprachoroidal: Refers to an implant placed between the choroid and the sclera [13,14]. Suprachoroidal implantation has the advantage of lessening the risk of retinal detachment since the implant is placed further away from the retina. Our study models an epiretinal prosthesis.
Multiple research groups working to develop retinal prostheses have evolved from the laboratory to creating medical devices following regulatory approval. However, some technical issues remain unresolved, providing each of these retinal prostheses systems room for improvement. To guide the design for higher resolution arrays, studies of retinal stimulation safety and new stimulation paradigms need to be performed.
Shanon et al. presented a model of safe levels of electrical stimulation based on data acquired during animal experiments with surface electrodes placed in cortical neurons [15,16]. They found a boundary between safe and unsafe charge injections based on charge and charge density. Their model represents a great framework for designing future animal safety studies. In our study we took into account other factors to evaluate the safety of electrical stimulation such as pulse duration, pulse rate, stimulus duty cycle and duration of exposure.
The resolution of a retinal prosthesis will depend in part on the number and size of electrodes in its array [17]. To be able to achieve a high-resolution retinal prosthesis, simulations of artificial vision have suggested that 600 to 1000 electrodes will be required in a retina with a 5 mm diameter [17,18]. Changes in the number and size of the stimulating electrodes will require higher charge densities, thereby creating a safety concern. Several studies have reported on the safety of acute and chronic electrical stimulation in the retina. Most of these studies have relied on post-mortem analysis such as propidium iodide fluorescent dye [19] or hematoxylin staining [20]. An in-vitro study performed by Cohen et al, representing an epiretinal implant evaluates the effects of electrical stimulation in the retina using a superfused retinal eyecup preparation, a stimulation electrode (saline-filled transparent fluoropolymer tube 0.38 mm i.d., 0.89 mm o.d.) and real time OCT imaging [21,22] and showed the value of continuous monitoring during stimulation. However, it would be important to use a stimulating electrode made of a material similar to the one currently used in patients to have more comparable results. Also the long-term effects of stimulation could not be investigated, as this method was in vivo. In vivo testing would allow studying the retina in its natural conditions while also allowing long-term follow up. Another study performed in vivo by Kanda et al. [14] with a suprachoroidal implant, studied the relationship between retinal damage and current intensity using a rabbit model, with a femtosecond laser-induced porous electrode, parylene substrate (thickness: 0.03 mm, diameter 0.5 mm), a continuous 48 hour stimulation protocol, and with funduscopic examination, OCT, fluorescein angiography (FA) and histological analysis to evaluate retinal injury [23]. This study showed the advantage and flexibility of testing with an in vivo model and the importance of imaging when evaluating the effects of retinal stimulation.
We therefore proposed an in vivo experimental model in our study, that represented the location of an epiretinal implant, with a similar size stimulating electrode (250 μm in diameter) and materials (platinum/Iridium) as current and potentially future epiretinal prostheses. Using an in vivo model, we studied the effects of electrical stimulation in the rabbit retina in real time using OCT with follow up imaging up to two weeks after stimulation.
Animal model
We performed both non-survival and survival experiments in our study. For most non-survival experiments, we used adult pigmented rabbits (Irish Farms, Norco, CA) that were approximately 2 months old. Retinal stimulation was performed in only an eye in each rabbit (n=37). The animals were anesthetized with ketamine (100 mg/kg) and xylazine (20 mg/kg) combination and euthanized at the end of the procedure.
For the survival experiments, we used adult Dutch Belted rabbits (Covance Inc., Battle Creek, MI) that weighed approximately 2 kilograms. The experiments (n=12) were performed in only one eye in each animal, while additional non-survival experiments were performed in the other eye prior to euthanasia.
All animals were maintained on a daily 12-hour light/day cycle prior to their experiments. All procedures conformed to the Guide for Care and Use of Laboratory Animals (National Institute of Health). The University of Southern California and the University of Michigan Institutional Animal Care and Use committees’ reviewed and approved these procedures before commencement of the study.
Surgical procedures
During the non-survival experiments, a needle electrode, 250 μm diameter and 60 mm long was used as a return electrode and positioned subcutaneously in the rabbit’s forehead close to the eye used for the procedure. The rabbit was placed on a custom-made metal board that allowed for better placement for OCT imaging. The eye was dilated with two drops of 1% tropicamide (Tropicacyl, Akorn Inc., Buffalo Grove, IL) and 2.5% phenylephrine (AK-Dilate, Akorn Inc., Buffalo Grove, IL). The animal’s heart rate, blood pressure, temperature (rectal) and respiratory rate were monitored and recorded every 15 minutes during surgical procedure. The animal’s body temperature was maintained at 37°C with an electric heating pad. Spectral domain OCT imaging (Spectralis HRA-OCT, Heidelberg Engineering, Franklin, MA) was performed prior to the electrode placement. To insert the electrode, a scleral incision was made 3 mm from the limbus to avoid retinal and lens trauma. A 25 gauge valved trocar (Alcon, Fort Worth, TX) was used to keep the stimulating electrode in position (Figure 1). At the conclusion of the experiment, the animals were euthanized with an intravenous injection of pentobarbital (30 mg/kg, Butler, Dublin, OH).
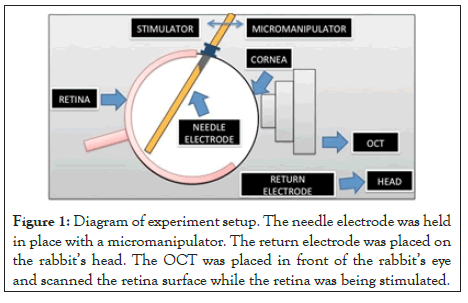
Figure 1: Diagram of experiment setup. The needle electrode was held in place with a micromanipulator. The return electrode was placed on the rabbit’s head. The OCT was placed in front of the rabbit’s eye and scanned the retina surface while the retina was being stimulated.
For the survival experiments, the animals were allowed to recover and kept either for a period of 24 hours or two weeks, in which OCT images were captured every three days. The animals were then euthanized by an intraperitoneal injection of pentobarbital (30 mg/kg, Butler, Dublin, OH).
Retinal stimulation with needle electrode and OCT imaging
The needle electrode consists of a 250 microns concentric monopole 90%Pt/10%Ir (custom made by FHC, Inc., Bowdoin, ME) with a flat tip (Figure 1). The electrode tip was modified by forming a high surface area platinum-iridium film on the electrode surface using an electrodeposition technique developed by our laboratory [24].
The stimulating electrode was held by a micromanipulator (Model 4044 M Parker Daedal, Cleveland, OH). This allowed flexible positioning of the electrode alignment, with a single axis translational stage to advance the electrode close to the retina. The electrode was inserted into the eye via a 25 gauge valved trocar (Bausch+Lomb, Rochester, NY) and advanced by the translational stage until it was visible with OCT imaging. The OCT scan line was then aligned with the length of the electrode tip to allow for simultaneous scanning of the electrode tip with the retina (Figure 2). The electrode tip was placed in the inferior temporal region of the retina, close to the visual streak (Figure 3). Charged-balanced, cathodic first, biphasic current pulses were delivered to the epiretinal surface, according to stimulation protocols as described in Tables 1 and 2.
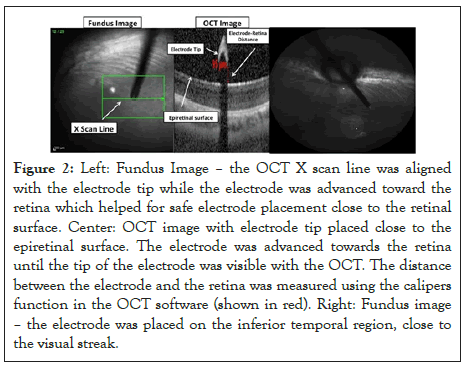
Figure 2: Left: Fundus Image – the OCT X scan line was aligned with the electrode tip while the electrode was advanced toward the retina which helped for safe electrode placement close to the retinal surface. Center: OCT image with electrode tip placed close to the epiretinal surface. The electrode was advanced towards the retina until the tip of the electrode was visible with the OCT. The distance between the electrode and the retina was measured using the calipers function in the OCT software (shown in red). Right: Fundus image – the electrode was placed on the inferior temporal region, close to the visual streak.
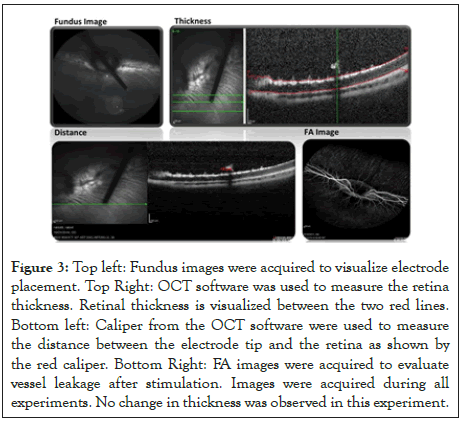
Figure 3: Top left: Fundus images were acquired to visualize electrode placement. Top Right: OCT software was used to measure the retina thickness. Retinal thickness is visualized between the two red lines. Bottom left: Caliper from the OCT software were used to measure the distance between the electrode tip and the retina as shown by the red caliper. Bottom Right: FA images were acquired to evaluate vessel leakage after stimulation. Images were acquired during all experiments. No change in thickness was observed in this experiment.
| Stimulation protocol-Non survival experiment | ||||||
|---|---|---|---|---|---|---|
| Electode size diameter | Pulse width (ms) | Amplitude (µA) | Frequency (Hz) | Charge denisty (mC/cm2) | No. of animals | Duration (min) |
| 250 µm | 1 | 450 | 333 | 0.92 | 8 | 30 |
| 600 | 100 | 1.22 | 2 | 100 | ||
| 200 | 1.22 | 3 | 45 | |||
| 333 | 1.22 | 7 | 30 | |||
| 800 | 20 | 1.63 | 4 | 100 | ||
| 100 | 1.63 | 5 | 100 | |||
| 200 | 1.63 | 2 | 45 | |||
| 333 | 1.63 | 4 | 30 | |||
| 250 µm | 25 | 40 | 16 | 2.03 | 2 | 45 |
Table 1: Parameters used during stimulation included different combinations of charge densitites, stimulus frequency, pulse widths, and duration of pulse train stimulations.
| Stimulation protocol- Survival experiment | |||||||
|---|---|---|---|---|---|---|---|
| Electode size diameter | Pulse width (ms) | Amplitude (µA) | Frequency (Hz) | Charge denisty (mC/cm2) | No. of animals | Duration (min) | Survival |
| 250 µm | 1 | 450 | 333 | 0.92 | 4 | 30 | 3 (24 h) |
| 1 (3 days) | |||||||
| 600 | 333 | 1.22 | 3 | 30 | 1 (24 hr) | ||
| 2 (2 weeks) | |||||||
| 800 | 20 | 1.63 | 1 | 100 | 2 4hr | ||
| 100 | 1.63 | 3 | 100 | 2 weeks | |||
| 333 | 1.63 | 1 | 30 | 24 hr | |||
Table 2: Parameters used during retinal stimulation in survival experiments, based on different combinations of charge densities, stimulus frequency, pulse widths, and duration of pulse train stimulations. Groups that showed no changes in retinal thickness during non-survival experiments (are presented in yellow), while groups that showed changes in retinal thickness during non-survival experiments (are displayed in red).
For the non-survival experiments, we tested two different pulse widths (1 and 25 ms), three charge densities (0.92, 1.22 and 1.63 mC/cm2) and four different frequencies (20, 100, 200 and 333 Hz). The pulse widths were chosen because they are typical for clinical use (1 ms) or have shown to result in more focal perceptions (25 ms) [25]. The pulse duration was kept constant for frequencies 333, 200 and 100 Hz when delivering 600.000 pulses; resulting in a pulse duration of 30, 45 and 100 minutes respectively. Experimental groups were tested as shown in Table 1. The number of animals varies because we sought to reduce the total number used by not using a third animal in cases were the first two animals showed identical results.
Five groups were selected for the survival experiments based on results from the non-survival experiments. We selected three settings that showed changes in retinal thickness and two settings that did not, to further investigate the threshold of this phenomenon (Table 2 and Results). The number of pulses delivered was kept constant for 333 Hz and 100 Hz, when delivering 600,000 pulses; which resulted about 600,000 pulsed delivered in 30 and 100 minutes respectively. For 20 Hz frequency, the stimulation duration was 100 minutes (Table 2), since maintaining the electrode position for 500 minutes was not practical. The groups that showed no changes in retinal thickness during the experiment were kept for 24 hours, with a second set of confirmatory OCTs acquired. The groups that demonstrated changes in retinal thickness were kept for a period of 2 weeks, with OCTs captured every three days to evaluate if the thickening observed was permanent or transient. One exception was the 1.63 mC/cm2, 333 Hz group. Since we observed 24 hours retinal thickening at 1.63 mC/cm2, 100 Hz, we chose to end the one experiment at 1.63 mC/cm2, 333 Hz after 24 hours and to not conduct more at this setting, to reduce the number of animals used. One factor in this decision was that a lower charge density setting also showed persistent thickening, thus additional experiments at 1.63 mC/cm2 at 333 Hz (the highest settings for both charge density and pulse rate) would not add valuable information.
During retinal stimulation, OCT images were acquired every 2 minutes for both the non-survival and survival experiments. Following stimulation, the OCT images were obtained every 5 minutes during a 15-minute period. In both experiment groups, retinal thickness was measured to assess for potential retinal damage.
Statistical analysis
Data was analyzed using Matlab (Natick, Massachusetts) and Microsoft Excel. For non-survival experiments, a non-parametric t-test (signed-rank test) was performed to determine if the median difference between the retinal thickness before and after stimulation was zero. Statistical comparisons were done by performing a non-parametric one-way analysis of variance (ANOVA-Kruskal Wallis) to appraise whether the median difference in retinal thickness was similar across the eight different groups. A non-parametric post-hoc comparison was performed using the Wilcoxon test. Ranks were assigned to the data for differences in retinal thickness. A comparison between ranks was evaluated after applying a Bonferroni correction to account for the number of possible pairing combinations. On the other hand, the results from the survival experiments were only evaluated qualitatively given that the sample size was limited, thus preventing a meaningful statistical analysis from being performed.
Animal model
We performed both non-survival and survival experiments in our study. For most non-survival experiments, we used adult pigmented rabbits (Irish Farms, Norco, CA) that were approximately 2 months old. Retinal stimulation was performed in only an eye in each rabbit (n=37). The animals were anesthetized with ketamine (100 mg/kg) and xylazine (20 mg/kg) combination and euthanized at the end of the procedure.
For the survival experiments, we used adult Dutch Belted rabbits (Covance Inc., Battle Creek, MI) that weighed approximately 2 kilograms. The experiments (n=12) were performed in only one eye in each animal, while additional non-survival experiments were performed in the other eye prior to euthanasia.
All animals were maintained on a daily 12-hour light/day cycle prior to their experiments. All procedures conformed to the Guide for Care and Use of Laboratory Animals (National Institute of Health). The University of Southern California and the University of Michigan Institutional Animal Care and Use committees’ reviewed and approved these procedures before commencement of the study.
Surgical procedures
During the non-survival experiments, a needle electrode, 250 μm diameter and 60 mm long was used as a return electrode and positioned subcutaneously in the rabbit’s forehead close to the eye used for the procedure. The rabbit was placed on a custom-made metal board that allowed for better placement for OCT imaging. The eye was dilated with two drops of 1% tropicamide (Tropicacyl, Akorn Inc., Buffalo Grove, IL) and 2.5% phenylephrine (AK-Dilate, Akorn Inc., Buffalo Grove, IL). The animal’s heart rate, blood pressure, temperature (rectal) and respiratory rate were monitored and recorded every 15 minutes during surgical procedure. The animal’s body temperature was maintained at 37°C with an electric heating pad. Spectral domain OCT imaging (Spectralis HRA-OCT, Heidelberg Engineering, Franklin, MA) was performed prior to the electrode placement. To insert the electrode, a scleral incision was made 3 mm from the limbus to avoid retinal and lens trauma. A 25 gauge valved trocar (Alcon, Fort Worth, TX) was used to keep the stimulating electrode in position (Figure 1). At the conclusion of the experiment, the animals were euthanized with an intravenous injection of pentobarbital (30 mg/kg, Butler, Dublin, OH).

Figure 1: Diagram of experiment setup. The needle electrode was held in place with a micromanipulator. The return electrode was placed on the rabbit’s head. The OCT was placed in front of the rabbit’s eye and scanned the retina surface while the retina was being stimulated.
For the survival experiments, the animals were allowed to recover and kept either for a period of 24 hours or two weeks, in which OCT images were captured every three days. The animals were then euthanized by an intraperitoneal injection of pentobarbital (30 mg/kg, Butler, Dublin, OH).
Retinal stimulation with needle electrode and OCT imaging
The needle electrode consists of a 250 microns concentric monopole 90%Pt/10%Ir (custom made by FHC, Inc., Bowdoin, ME) with a flat tip (Figure 1). The electrode tip was modified by forming a high surface area platinum-iridium film on the electrode surface using an electrodeposition technique developed by our laboratory [24].
The stimulating electrode was held by a micromanipulator (Model 4044 M Parker Daedal, Cleveland, OH). This allowed flexible positioning of the electrode alignment, with a single axis translational stage to advance the electrode close to the retina. The electrode was inserted into the eye via a 25 gauge valved trocar (Bausch+Lomb, Rochester, NY) and advanced by the translational stage until it was visible with OCT imaging. The OCT scan line was then aligned with the length of the electrode tip to allow for simultaneous scanning of the electrode tip with the retina (Figure 2). The electrode tip was placed in the inferior temporal region of the retina, close to the visual streak (Figure 3). Charged-balanced, cathodic first, biphasic current pulses were delivered to the epiretinal surface, according to stimulation protocols as described in Tables 1 and 2.

Figure 2: Left: Fundus Image – the OCT X scan line was aligned with the electrode tip while the electrode was advanced toward the retina which helped for safe electrode placement close to the retinal surface. Center: OCT image with electrode tip placed close to the epiretinal surface. The electrode was advanced towards the retina until the tip of the electrode was visible with the OCT. The distance between the electrode and the retina was measured using the calipers function in the OCT software (shown in red). Right: Fundus image – the electrode was placed on the inferior temporal region, close to the visual streak.

Figure 3: Top left: Fundus images were acquired to visualize electrode placement. Top Right: OCT software was used to measure the retina thickness. Retinal thickness is visualized between the two red lines. Bottom left: Caliper from the OCT software were used to measure the distance between the electrode tip and the retina as shown by the red caliper. Bottom Right: FA images were acquired to evaluate vessel leakage after stimulation. Images were acquired during all experiments. No change in thickness was observed in this experiment.
| Stimulation protocol-Non survival experiment | ||||||
|---|---|---|---|---|---|---|
| Electode size diameter | Pulse width (ms) | Amplitude (µA) | Frequency (Hz) | Charge denisty (mC/cm2) | No. of animals | Duration (min) |
| 250 µm | 1 | 450 | 333 | 0.92 | 8 | 30 |
| 600 | 100 | 1.22 | 2 | 100 | ||
| 200 | 1.22 | 3 | 45 | |||
| 333 | 1.22 | 7 | 30 | |||
| 800 | 20 | 1.63 | 4 | 100 | ||
| 100 | 1.63 | 5 | 100 | |||
| 200 | 1.63 | 2 | 45 | |||
| 333 | 1.63 | 4 | 30 | |||
| 250 µm | 25 | 40 | 16 | 2.03 | 2 | 45 |
Table 1: Parameters used during stimulation included different combinations of charge densitites, stimulus frequency, pulse widths, and duration of pulse train stimulations.
| Stimulation protocol- Survival experiment | |||||||
|---|---|---|---|---|---|---|---|
| Electode size diameter | Pulse width (ms) | Amplitude (µA) | Frequency (Hz) | Charge denisty (mC/cm2) | No. of animals | Duration (min) | Survival |
| 250 µm | 1 | 450 | 333 | 0.92 | 4 | 30 | 3 (24 h) |
| 1 (3 days) | |||||||
| 600 | 333 | 1.22 | 3 | 30 | 1 (24 hr) | ||
| 2 (2 weeks) | |||||||
| 800 | 20 | 1.63 | 1 | 100 | 2 4hr | ||
| 100 | 1.63 | 3 | 100 | 2 weeks | |||
| 333 | 1.63 | 1 | 30 | 24 hr | |||
Table 2: Parameters used during retinal stimulation in survival experiments, based on different combinations of charge densities, stimulus frequency, pulse widths, and duration of pulse train stimulations. Groups that showed no changes in retinal thickness during non-survival experiments (are presented in yellow), while groups that showed changes in retinal thickness during non-survival experiments (are displayed in red).
For the non-survival experiments, we tested two different pulse widths (1 and 25 ms), three charge densities (0.92, 1.22 and 1.63 mC/cm2) and four different frequencies (20, 100, 200 and 333 Hz). The pulse widths were chosen because they are typical for clinical use (1 ms) or have shown to result in more focal perceptions (25 ms) [25]. The pulse duration was kept constant for frequencies 333, 200 and 100 Hz when delivering 600.000 pulses; resulting in a pulse duration of 30, 45 and 100 minutes respectively. Experimental groups were tested as shown in Table 1. The number of animals varies because we sought to reduce the total number used by not using a third animal in cases were the first two animals showed identical results.
Five groups were selected for the survival experiments based on results from the non-survival experiments. We selected three settings that showed changes in retinal thickness and two settings that did not, to further investigate the threshold of this phenomenon (Table 2 and Results). The number of pulses delivered was kept constant for 333 Hz and 100 Hz, when delivering 600,000 pulses; which resulted about 600,000 pulsed delivered in 30 and 100 minutes respectively. For 20 Hz frequency, the stimulation duration was 100 minutes (Table 2), since maintaining the electrode position for 500 minutes was not practical. The groups that showed no changes in retinal thickness during the experiment were kept for 24 hours, with a second set of confirmatory OCTs acquired. The groups that demonstrated changes in retinal thickness were kept for a period of 2 weeks, with OCTs captured every three days to evaluate if the thickening observed was permanent or transient. One exception was the 1.63 mC/cm2, 333 Hz group. Since we observed 24 hours retinal thickening at 1.63 mC/cm2, 100 Hz, we chose to end the one experiment at 1.63 mC/cm2, 333 Hz after 24 hours and to not conduct more at this setting, to reduce the number of animals used. One factor in this decision was that a lower charge density setting also showed persistent thickening, thus additional experiments at 1.63 mC/cm2 at 333 Hz (the highest settings for both charge density and pulse rate) would not add valuable information.
During retinal stimulation, OCT images were acquired every 2 minutes for both the non-survival and survival experiments. Following stimulation, the OCT images were obtained every 5 minutes during a 15-minute period. In both experiment groups, retinal thickness was measured to assess for potential retinal damage.
Statistical analysis
Data was analyzed using Matlab (Natick, Massachusetts) and Microsoft Excel. For non-survival experiments, a non-parametric t-test (signed-rank test) was performed to determine if the median difference between the retinal thickness before and after stimulation was zero. Statistical comparisons were done by performing a non-parametric one-way analysis of variance (ANOVA-Kruskal Wallis) to appraise whether the median difference in retinal thickness was similar across the eight different groups. A non-parametric post-hoc comparison was performed using the Wilcoxon test. Ranks were assigned to the data for differences in retinal thickness. A comparison between ranks was evaluated after applying a Bonferroni correction to account for the number of possible pairing combinations. On the other hand, the results from the survival experiments were only evaluated qualitatively given that the sample size was limited, thus preventing a meaningful statistical analysis from being performed.
Non survival studies
Thirty-seven rabbits underwent the stimulation and imaging protocol.
Electrode-Retina Distance: The stimulating electrode was placed inside the eye 117.41 ± 35.65 μm (mean, SD) away from the retina as shown in Figure 3. We used results from the nonsurvival experiments, using 1 ms pulse stimulation (n=35) to perform a non-parametric partial correlation analysis between the electrode distance and change in retinal thickness. We then confirmed that the distance at which the electrode was placed did not predict the changes in retinal thickness after accounting for the effects of charge density and stimulating frequency (r=0.044, p=0.805). In addition, we evaluated how the distance between the electrode and the retina affected the time when the change in retinal thickness was first detected. Figure 4 shows that the distance affected the time in which the change in retinal thickness was observed. We found that if the distance between the electrode and retina was less than 100 microns changes in retinal thickness were seen within five minutes of stimulation. If the distance between the electrode and retina was more than 100 μm, the changes in retinal thickness were observed within twelve to fifteen minutes of stimulation. For both groups (distance<100 μm and distance>100 μm), we tested different combinations of stimulation parameters, but they did not play a role in the time when the changes in retinal thickness started. It should be noted that Figure 4 shows only 10 representative examples of the typical measured response.
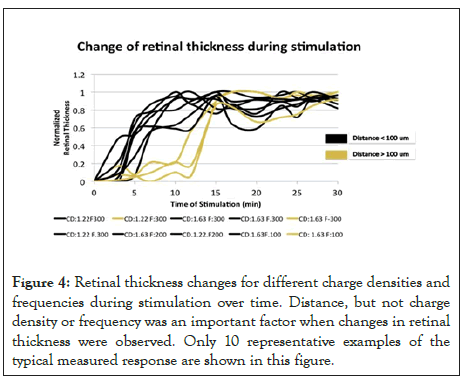
Figure 4: Retinal thickness changes for different charge densities and frequencies during stimulation over time. Distance, but not charge density or frequency was an important factor when changes in retinal thickness were observed. Only 10 representative examples of the typical measured response are shown in this figure.
Stimulation-Retinal Thickness: The effects of the different charge densities applied to the retina are shown in Figure 5. Here, the OCT images as shown were captured just before starting the retinal stimulation (top row), 20 minutes into the stimulation (middle row) and 30 minutes following stimulation (bottom row). The images shown are for three different charge densities: 0.92 mC/cm2 (left column), 1.22 mC/cm2 (middle column) and 1.63 mC/cm2 (right column) applied at 333 Hz. When 1 ms pulses were applied, the changes in retinal thickness were visible with charge density 1.63 mC/cm2 at frequencies 333 Hz, 200 Hz and 100 Hz, and charge density 1.22 mC/cm2 at frequencies 333 Hz and 200 Hz. The remaining groups that were stimulated with 1 ms pulses showed no difference in retinal thickness before and after stimulation. No changes in retinal thickness were observed when tested with 25 ms pulses, charge density 2.26 mC/cm2 and frequency 16 Hz. Figure 6 summarized the results of our experiment using various frequency and charge density combinations. The stimulation parameters that were tested and where changes in retinal thickness were observed were much higher than current parameters used clinically in patients implanted with the Argus II retinal prosthesis [26].
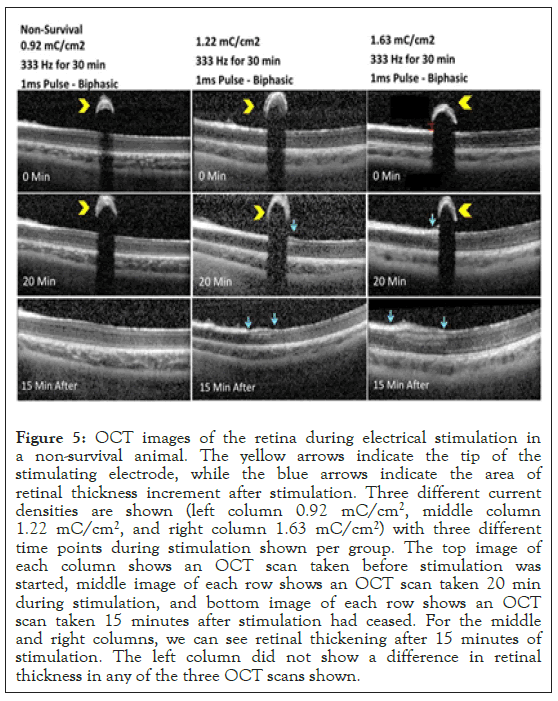
Figure 5: OCT images of the retina during electrical stimulation in a non-survival animal. The yellow arrows indicate the tip of the stimulating electrode, while the blue arrows indicate the area of retinal thickness increment after stimulation. Three different current densities are shown (left column 0.92 mC/cm2, middle column 1.22 mC/cm2, and right column 1.63 mC/cm2) with three different time points during stimulation shown per group. The top image of each column shows an OCT scan taken before stimulation was started, middle image of each row shows an OCT scan taken 20 min during stimulation, and bottom image of each row shows an OCT scan taken 15 minutes after stimulation had ceased. For the middle and right columns, we can see retinal thickening after 15 minutes of stimulation. The left column did not show a difference in retinal thickness in any of the three OCT scans shown.
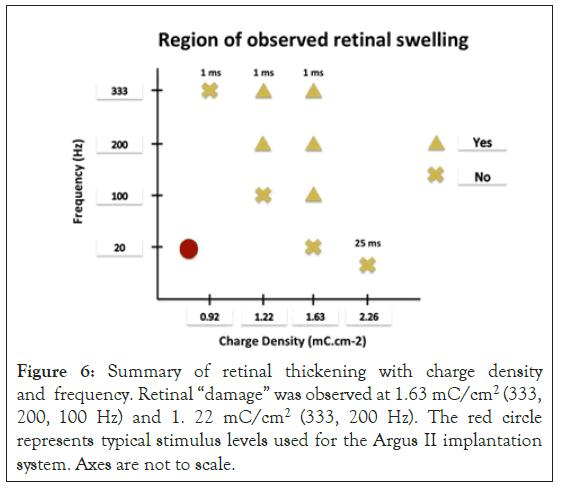
Figure 6: Summary of retinal thickening with charge density and frequency. Retinal “damage” was observed at 1.63 mC/cm2 (333, 200, 100 Hz) and 1. 22 mC/cm2 (333, 200 Hz). The red circle represents typical stimulus levels used for the Argus II implantation system. Axes are not to scale.
When we performed non-parametric partial correlation analysis between frequency and charge density versus percent change in retinal thickness, we identified that these two variables (frequency and charge density) were predictors of retinal thickening (r=0.348, p=0.046 and r=0.542, p=0.01 respectively) (Figure 7).
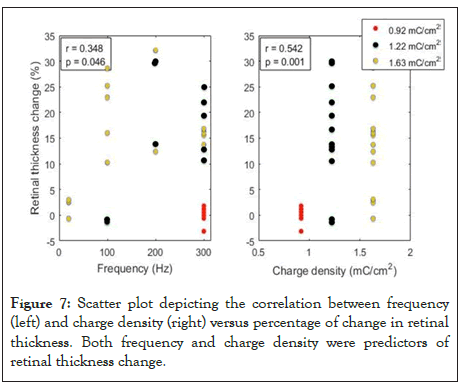
Figure 7: Scatter plot depicting the correlation between frequency (left) and charge density (right) versus percentage of change in retinal thickness. Both frequency and charge density were predictors of retinal thickness change.
Five out of the eight groups tested with 1 ms pulses, revealed changes in retinal thickness (Table 3); the other three groups showed no change in retinal thickness (Figure 8). Experiments were started at the lowest charge density tested (0.92 mC/cm2) with the initial lowest frequency (100 Hz). At this charge density no changes in retina thickness were observed even when the frequency was increased from 100 Hz to 200 Hz and 333 Hz. When reaching the maximum frequency tested (333 Hz), the charge density was increased from 0.92 mC/cm2 to 1.22 mC/ cm2. At our initial frequency of 100 Hz, no changes in retinal thickness were observed during and after stimulation, but as the frequency was increased from 100 Hz to 200 and 333 Hz, thickening of the inner limiting membrane (ILM) was observed in the OCT images (Figure 5). At the end of the stimulation morphological changes involving the ILM and inner plexiform layer (IPL) were observed just below the area where the electrode was placed and these retinal changes remained at least fifteen minutes after simulation. As we reached the highest charge density tested (1.63 mC/cm2), the lowest frequency evaluated was 20 HZ with no changes observed in the retinal thickness. As the frequency was increased: 100 Hz, 200 Hz and 333 Hz showed thickening and morphological changes affecting the ILM, IPL and the inner nuclear layer (INL), with changes in reflectance that extended throughout the whole retina (displayed as the area just below the electrode). These retinal changes were observed during and after the retinal stimulation. The changes in retinal thickness observed did not appear to progress after the stimulation had been completed.
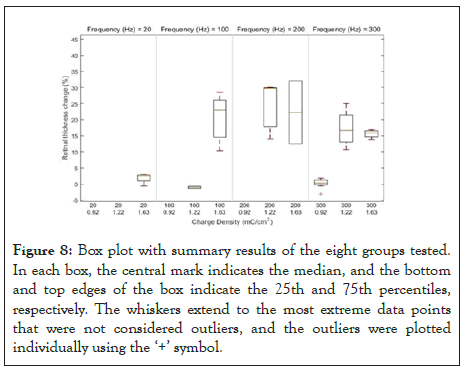
Figure 8: Box plot with summary results of the eight groups tested. In each box, the central mark indicates the median, and the bottom and top edges of the box indicate the 25th and 75th percentiles, respectively. The whiskers extend to the most extreme data points that were not considered outliers, and the outliers were plotted individually using the ‘+’ symbol.
| Charge density (mC/cm2) | Frequency (Hz) | Thickness befor stimulation (µm) | Thickness after stimulation (µm) | Percentage increase (%) | |||
|---|---|---|---|---|---|---|---|
| Median | IQR Range | Median | IQR Range | Median | IQR Range | ||
| 1.63 | 333 | 159 | 144.5 to 162.5 | 189 | 171.75 to 190.75 | 15.96 | 14.23 to 16.69 |
| 200 | 160 | 155 to 165 | 210 | 177 to 243 | 22.96 | 12.43 to 32.10 | |
| 100 | 157 | 137.5 to 157 | 187 | 166.5 to 215 | 22.9 | 13.16 to 25.94 | |
| 1.22 | 333 | 160 | 153 to 163 | 189 | 180 to 204 | 16.67 | 12.85 to 22.11 |
| 200 | 154 | 142 to 166 | 219 | 165 to 237 | 29.68 | 13.94 to 29.96 | |
Table 3: Summary of results with charge density, frequency and associated retinal thickening with simulation. Five out of the eight groups tested with 1 ms pulses, showed increase in retinal thickness.
With the non-parametric signed-rank test, the median difference between the retinal thickness before and after simulation was 23%. The p-value from the Signed Rank test was <0.0001. Thus, we had a statistical significant median difference between the retinal thickness before and after simulation that was different from zero.
Since there were 8 different stimulation groups with varying charge density and frequency, a new variable called ‘treatment’ was created that included different combinations of charge density and frequency. To assess if the ‘treatment’ groups had an effect on the difference in retinal thickness, a non-parametric ANOVA-Kruskal Wallis test was performed. We found a statistical significance in the 8 groups indicating that the median change of retinal thickness with charge density and frequency was different (p=0.0005). A non-parametric post-hoc test using the Wilcoxon test was also carried out. Ranks were assigned to the data for difference in retinal thickness. A comparison between ranks were evaluated after applying a Bonferroni correction to account for the number of possible combination of pairs. A total of six different combinations were found to have significant difference: frequency 300 Hz, 0.92 mC/cm2 Vs. 1.22 mC/cm2 p=0.00004; frequency 300 Hz, 0.92 mC/cm2 Vs. 1.63.
mC/cm2; p=0.0011; frequency 100 Hz, 1.22 mC/cm2 Vs. 1.63 mC/cm2; p=0.00057; charge density 1.22 mC/cm2; 100 Hz vs. 200 Hz: p=0.00041; charge density 1.22 mC/cm2; 100 Hz vs. 300 Hz: p=0.0010; charge density 1.63 mC/cm2, 20 Hz vs. 100 Hz: p=0.0057. Two combinations were found to have a marginal significant difference, namely: charge density 1.63 mC/cm2, 20 Hz vs. 200 Hz: p=0.054; charge density 1.63 mC/cm2, 20 Hz vs. 300 Hz: p=0.066. The rest of the combinations did not show any significant difference.
Survival studies
Five rabbits followed a similar stimulation protocol as described above however, they were kept alive for a period of two weeks after stimulation if they showed changes in retinal thickness during stimulation. OCT images were acquired every 3 days during the two-week period, with serial retinal thickness measurements obtained. Figure 9 shows the six captured OCT images: before stimulation, fifteen minutes into stimulation, fifteen minutes after stimulation, three days after stimulation, nine days after stimulation, and twelve days after stimulation. The retinal thickening remained throughout the twelve days in the five animals that initially showed thickening and showed progression over time. Fifteen minutes after the stimulation had been completed, the thickening of the ILM, IPL and INL were observed, but on day twelve following simulation, an increase in reflectivity was seen across all the retinal layers.
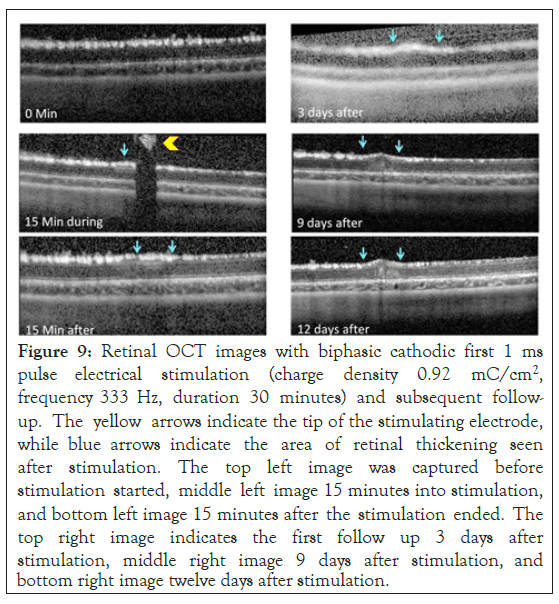
Figure 9: Retinal OCT images with biphasic cathodic first 1 ms pulse electrical stimulation (charge density 0.92 mC/cm2, frequency 333 Hz, duration 30 minutes) and subsequent follow-up. The yellow arrows indicate the tip of the stimulating electrode, while blue arrows indicate the area of retinal thickening seen after stimulation. The top left image was captured before stimulation started, middle left image 15 minutes into stimulation, and bottom left image 15 minutes after the stimulation ended. The top right image indicates the first follow up 3 days after stimulation, middle right image 9 days after stimulation, and bottom right image twelve days after stimulation.
Follow up OCTs identified that the retinal thickening diminished by day 6, and stabilized by days 9 and 12. The change in retinal thickness 12 days after stimulation was revealed to range between 15 and 40 percent when compared to their baseline retinal thickness (Figure 10).
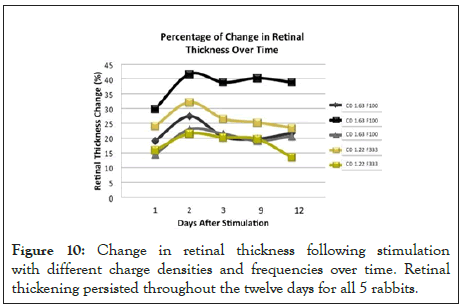
Figure 10: Change in retinal thickness following stimulation with different charge densities and frequencies over time. Retinal thickening persisted throughout the twelve days for all 5 rabbits.
Application of current pulse trains at charge densities and rates that are relatively high compared to those used in clinical devices, causes thickening of the retina within minutes of starting stimulation. OCT images showed thickening within several retinal layers. In limited cases high currents [27] or high rates [28] have been used in humans, on a short term basis, in the context of controlled psychophysical testing. Next generation devices with smaller electrodes and more advanced stimulation electronics may utilize high charge densities and high stimulation rates. Studies in other parts of the nervous system have linked the stimulation rate and/or duty cycle to neural damage [29]. Thus, understanding the retinal response to this type of stimulus is important for guiding the design of future implants and for consideration when testing alternative stimulation paradigms with today’s implants.
Cohen et al. developed a method to study the effects of electrical stimulation in the retina using optical coherence tomography (OCT) and a superfused retinal eyecup preparation. A stimulation electrode (saline-filled transparent fluoropolymer tube faced at a 45-degree angle to the retinal surface) was placed closed to the retina. 50 Hz, Cathodic first, 1 ms pulses and different charge density pulse trains (25-749 μC. cm ph were delivered to the retina and changes in the reflectance and morphology of the retina directly under the tube electrode were examined. PI staining and classical histology was used to correlate between changes in the retinal reflectivity in the OCT images and actual indicators of tissue damage. Results showed that pulse train stimulation at 44-133 μC. cm ph had little effect on the retina. Trains ≥ 442 μC. cm. ph caused increases in the reflectance of the inner plexiform layer (IPL) and edema. The damage seen in retinal OCT images matched the pattern observed in histological sections, and in the PI staining [21]. The charge density (0.442 mC/cm2) that altered retinal appearance was lower than in our studies, but the total charge was greater, since a larger electrode area was used.
Kanda et al. recently developed a suprachoroidal stimulating electrode with increase surface area. To verify the safety of this electrode an in vivo study in rabbits was performed. A single channel electrode (diameter: 0.5 mm, height: 0.3 mm, geometric surface area: 0.43 mm2) was placed in a scleral pocket created at the posterior pole of the eye. Their return electrode was inserted into the vitreous cavity. Stimulation protocol was performed 2 weeks after electrode implantation. 20 Hz, biphasic, 0.5 ms pulses up to 3 mA were applied for 48 hours. Only the 3.0 mA condition reported FA leakage and punctate pigmentation in fundus images [23], but stimulation 2.5 mA or below did not change retinal appearance. Even thought the placement of their electrode was different than our study, we can make a fair comparison between both experiments since they were both performed in vivo, which enabled us to study the retina response in its natural conditions. The lowest charge density that resulted in retinal damage was 0.23 mC/cm2 (only in 1 out of the 3 animals tested), which was lower than our study. However, taking into account that the surface area of their electrode was 10 times bigger than our electrode, their lowest injected charge was 500 nC, while we used 450 nC. Moreover, Kanda et al. observed damage at an injected charge of 1000 nC, while we saw damage at an injected charge of 600 nC. These in vivo and in vivo studies may indicate that not only frequency and charge density are important factors to evaluate for retinal stimulation safety but injected charge and electrode surface area should also be taken into account for future studies, in keeping with electrical stimulation safety studies performed in other parts of the nervous system [30,31].
It is not clear why electrical stimulation causes thickening to the retinal tissue. Some hypotheses have stated that intrinsic biological processes cause tissue thickening when the tissue is overstimulated. The overstimulation of the tissue can cause neuron firing for long periods of time, unlike natural firing patterns which are sparse. Such a change in activity may alter ion concentration both intracellularly and extracellularly, deplete oxygen and glucose, and accumulation of excess glutamate, creating a toxic environment for the neuron [32]. Retinal thickening is also attributed to toxic electrochemical reactions caused between the electrode-tissue interface, when byproducts of stimulation accumulate at a rate greater than what can be absorbed by the physiological system [33]. Although we did not notice bubble formation at the electrode, which would indicate hydrolysis, we cannot rule out other chemical reactions that may have altered the pH or produced harmful reactants. Physical contact between the electrode and the retina would result in a lesion. One of our earlier studies found noted damage with no stimulation due to retinal contact [34]. In the present study, the use of OCT allowed us to monitor continuously the position of the electrode. Further, the lack of retinal thickening with low intensity stimulation (rate or charge density) supports the claim that retinal thickening was not created by physical contact, since the electrode positioning mechanism is independent of stimulation parameters.
We developed a new method that allows us to study the effects of electrical stimulation on the retina in an in vivo model during the stimulation period. We used an in vivo model because it allows us to study the retina’s response in its natural conditions. The technique will allow for the study of long-term effects of retinal stimulation as it is potentially a survival surgery. This is important because studies will be needed to determine if this thickening is transient or permanent, thereby helping us understand its causes and potential effects on retinal implant patients. One limitation of our method is that we used a needle type electrode. Clinical epiretinal arrays use planar electrode arrays. The insulating substrate will direct more current into the retina, by partially blocking an alternate pathway through the highly conductive vitreous. In contrast, the needle electrode we used had a disk electrode on its tip, similar to those used in clinical arrays, but did not have an insulating substrate. Stimulus current was free to pass through vitreous. We partially mitigated this by positioning the electrode close to the retina, in a location known to evoke retinal responses in a rat model using the same style electrode [35,36]. The values for charge density that result in retinal thickening will be lower when the charge is applied with a planar array, since more stimulus will be directed into the retina. OCT imaging through planar arrays is possible and surgical positioning of the array is feasible, but a planar array specifically designed for a rabbit eye would be needed. Furthermore, we need to test additional combinations of frequency, charge density, and distance while exploring the effects that variations in electrode size and duty cycle have on tissue damage, and having a comparison between OCT imaging and histological data from the final time point.
From this study we can conclude that frequency and charge density both play an important role in the change of retinal thickness during stimulation. In addition, the distance between the electrode and retina affects the time when the retinal increment is observed. Finally, retinal changes in thickness were still observed two weeks after stimulation. Based on our experimental results and previous research, such as the study carried out by Shannon, we believe that it is critical for the field to create a mathematical model that will help identify the safe and unsafe electrical stimulation parameters for neural tissue. We believe that our results bring us one step closer to creating a strong and reliable model that will enable the prediction of damage in retinal and neural tissue.
Citation: Gonzalez-Calle A, Jeganathan VSE, Humayun MS, Weiland JD (2020) Effects of Electrical Stimulation on Retinal Morphology as Seen with Optical Coherence Tomography. J Clin Exp Ophthalmol. 11:858. DOI: 10.35248/2155-9570.20.11.858
Received: 12-Aug-2020 Accepted: 26-Aug-2020 Published: 02-Sep-2020 , DOI: 10.35248/2155-9570.20.11.858
Copyright: © 2020 Gonzalez-Calle A, et al. This is an open-access article distributed under the terms of the Creative Commons Attribution License, which permits unrestricted use, distribution, and reproduction in any medium, provided the original author and source are credited.