Fisheries and Aquaculture Journal
Open Access
ISSN: 2150-3508
ISSN: 2150-3508
Research Article - (2011) Volume 2, Issue 1
Bio-filtration has been widely used in re-circulating aquaculture system to remove waste and to convert toxic ammonia and nitrite into safe end products ornamental fish and other aquatic organisms. However, the study of micro-bead usage as the filter medium has not yet been broadened and thoroughly developed. Therefore, the aim of this study is to construct a biological filter made from polyethylene micro-bead as the filter medium and to analyze its effectiveness in removing waste as well as in converting the toxic organic matter into stable substances. The bio-filter was constructed under a rotational molding process. The tubes, hoses, and piping were made from polyvinyl chloride (PVC) while the fasteners were made from stainless steel and other non-corrosive materials. The effectiveness of this bio-filter was measured by using biochemical oxygen demand (BOD) and total suspended solids (TSS) analysis. Results indicated that this bio-filter is efficient enough to remove suspended solids and BOD. Therefore, this floating micro-bead bio-filter can be used in aquaculture systems.
Keywords: Micro-bead bio-filter; ornamental fish; re-circulating aquaculture system; biochemical oxygen demand; total suspended solids.
Re-circulating aquaculture systems are slowly starting to develop in Malaysia. Most Malaysian aquaculture breeders tend to operate mechanical filtration and biological filtration in separate filter tanks. Even though previous studies [1-5] have proved the efficiency of floating bead filters in performing both mechanical and biological filtration at a single unit, this type of filter has not been widely used in Malaysia. Therefore, this study was conducted to construct the floating micro-bead bio-filter model at the most reasonable cost and to develop the model so that the filter can be applied practically, suitably and effectively for freshwater fish in warm water aquaculture applications.
Most bead filters used in aquaculture applications today are using 3 mm beads with densities only a few percent less than water. This media is also 50-100 times more expensive, per unit surface area provided, than the 1 mm type floating media that was used by Greiner and Timmons [4]. For clarity in this paper, the small bead media and filters (1 mm diameter) are referred to as a micro-bead filter to distinguish from the 3 mm bead reactors. The term micro-bead has also been used by other researchers for a 1 mm type bead media [6]. While there is considerable information in the literature on nitrification characteristics for most of the media in current use [7-10], there is no quantifiable information concerning the use of 1 mm polyethylene floating media (micro-beads) which is presently being used in aquaculture applications.
Bead filter in mechanical treatment process
Mechanical filtration or clarification is the process of removing suspended solids from water. Suspended solids in a re-circulating system are generally small particles of undigested food, bacteria, and algae. These solids tend to reduce the clarity of water and also reduce a tremendous amount of oxygen. Bead filters remove solids from water by different mechanisms. Physical straining is probably the most dominant mechanism removing larger particles (>50 microns). Finer particles (<20 microns) are removed at a lower rate by a process called bio-absorption. The particles are captured by bacterial biofilm on the surface of the bead. The more passes the more solids captured [11,12].
Bead filter in biological treatment process
There are two common methods used to remove ammonia in fresh water systems: ion exchange and biological filtration. In salt water systems, ion exchange is not a viable alternative because in the culture water rapidly saturates all of the adsorption sites on the ion exchange media. Thus, biological filters are the only widely used method to remove ammonia and nitrite from all types of aquaculture systems.
Biological filters consist of some solid media that serve as a surface on which bacteria can attach and grow. The bead filter is specifically designed to facilitate rapid growth of both nitrifying and heterotrophic bacteria which in freshwater systems comprise of Nitrosomonas and Nitrobacter spp. These microorganisms grow in pore spaces between the beads, extracting dissolved organics from the circulating waters entering the filter and neutralizing the ammonia contents in the dissolved water results from a pond fish. Slower growing nitrifiers, coating the beads, convert the toxic ammonia and nitrite to stable nitrification end product [13]. As solids and bacterial biomass accumulate, the bed begins to clog, impeding the transfer of oxygen and nutrients to the bacteria in the filter. Thus, the backwash sequence needed to be implemented [14].
Material selection
Filter tank
The filter tank was made from polyethylene. For safety purposes the thickness of the tank should be 0.2 m in order to withstand the hydraulic pressure generated by the water flowing from the pond into the tank. When the tank is filled with water, the micro-beads will float up to the level of the tank's neck. Since the water inlet tube is located lower than the neck level, therefore the tank should be a cylinder with a cone shape at the top of the chamber to minimize the micro-beads filling area. Since designs for biological filters should prevent the excessive light for the bacteria, the tank was painted blue in color in order to provide complete darkness for diurnal cycling of light regimes for nitrifying bacteria.
Filter medium
Polyethylene powder was chosen as the filter medium. The bead volume should be ¾ of the tank volume. The beads are spherical in shape with 1-2 mm in diameter. The polyethylene micro-bead is shown in Figure 1.
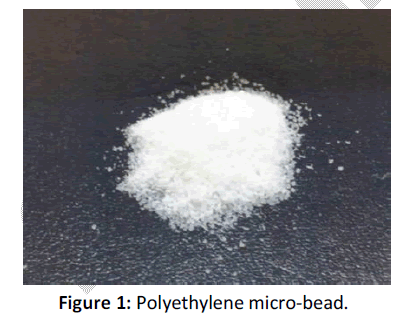
Figure 1: Polyethylene micro-bead.
Polyethylene is a repeating unit of ethylene [C2H4] having a chemical structure as shown in Figure 2.
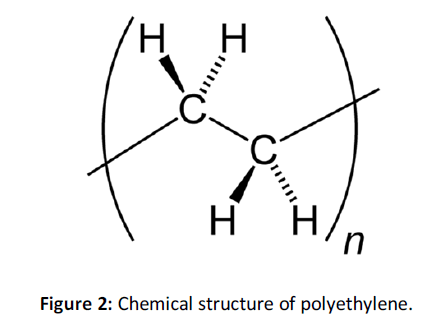
Figure 2: Chemical structure of polyethylene.
Pipes and fittings
PVC schedule 40 pressure pipe is commonly dual rated for pressure water systems, as well drain waste and vent applications, meeting the requirements of the American Society for Testing and Materials [ASTM] Standard D2665. The reason to choose PVC is that the water temperatures below 45°C will not affect the migration of PVC. Table 1 lists the properties for PVC pipe Schedule 40. Polyethylene powder has the characteristic that it is non-harmful to the fish as well as other living organisms. Furthermore, polyethylene has low cost, has long shelf life, and is available in retail stores.
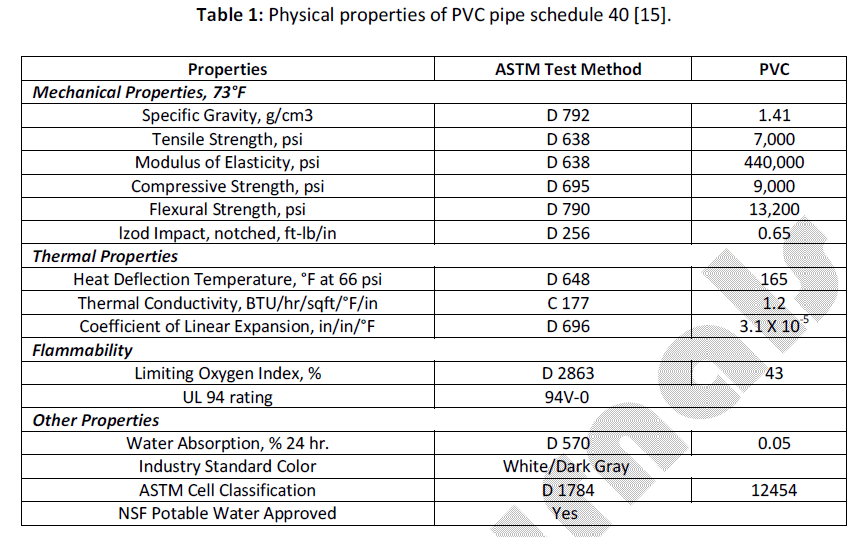
Table 1: Physical properties of PVC pipe schedule 40 [15].
Floating micro-bead bio-filter operation
Once the floating micro-bead bio-filter was fabricated, its function and operation were tested to ensure its performance ability. The bio-filter was connected to a 10 m2 pond with 20 Koi carp, Cyprinus carpio [average weight 2 kg] using PVC pipes and fittings Schedule 40. A half horsepower submersible pump was used to pump water from the pond into the bio-filter. The filtered water will flow out from the bio-filter by hydrostatic pressure and return to the pond, forming a re-circulating aquaculture system. A schematic diagram of the operation flow layout is shown in Figure 3, and floating micro-bead bio-filter is shown in Figure 4a and Figure 4b.
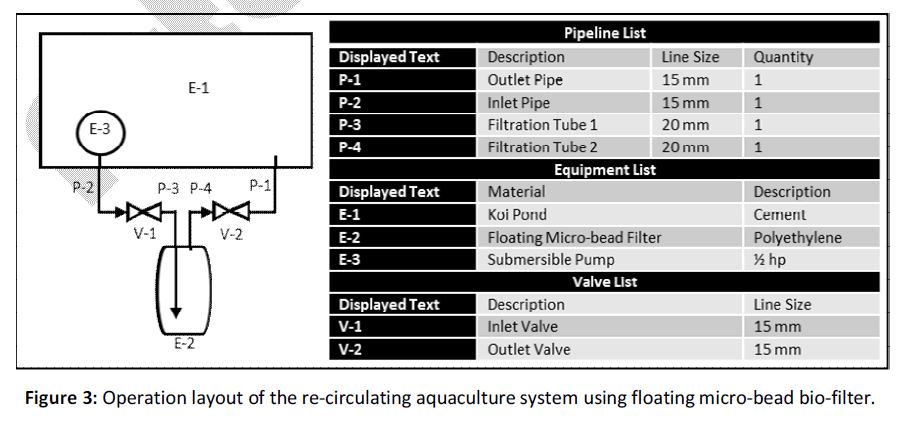
Figure 3: Operation layout of the re-circulating aquaculture system using floating micro-bead bio-filter.
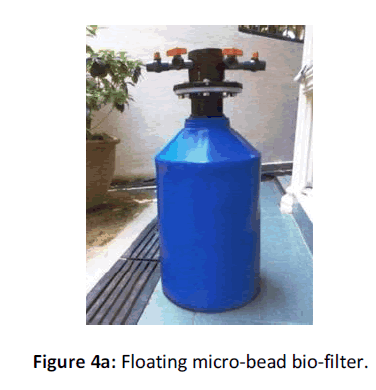
Figure 4a: Floating micro-bead bio-filter.
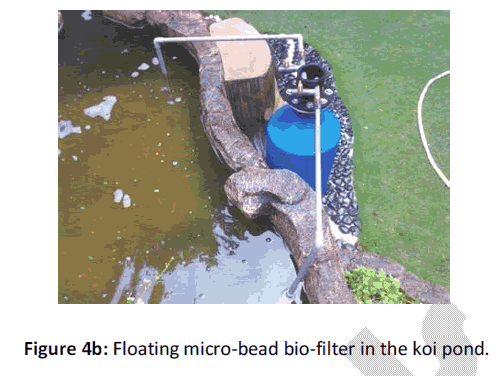
Figure 4b: Floating micro-bead bio-filter in the koi pond.
After operating for some time, the sludge from the filtration tends to accumulate inside the bed. This condition decreased the flow rate at the exit point of the bio-filter. In order to overcome this problem, a backwash mode was required in order to remove the sludge accumulated inside the packed bed. To switch from filtration mode to backwash mode, the inlet flow is reversed thus; it becomes the outlet point. Filtration mode is turned off and clean water [from water source] is supplied into the outlet pipe. The clean water will enter the tank bed from the outlet pipe, and flow through the packed bed causing turbulence flow. This flow will cause the packed bed to agitate thus removing the accumulated sludge trapped between the particles of the microbead. This sludge will finally flow out from the tank via the inlet pipe. A schematic diagram presenting the filtration mode and the backwash mode is shown in Figure 5.
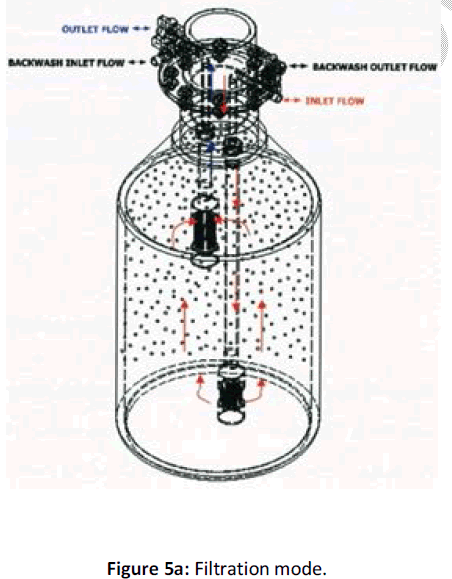
Figure 5a: Filtration mode.
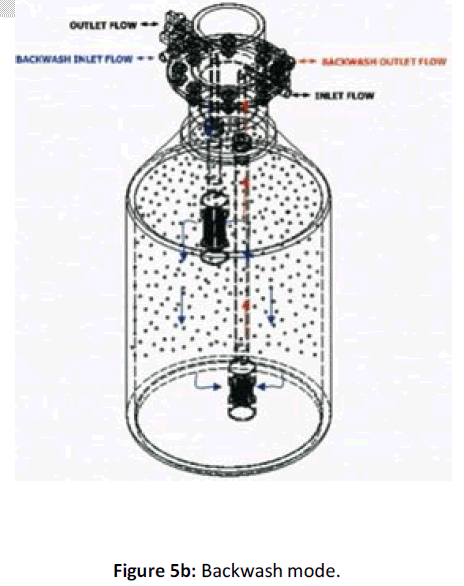
Figure 5b: Backwash mode.
Performance analysis
The bio-filter operation was observed for seven days. Within this period, tests were done in order to test its performance efficiency. The tests were Biochemical Oxygen Demand [BOD] and Total Suspended Solids [TSS] analysis. Samples were taken during the operation of the bio-filter and were collected from outlet pipe for seven days in a row at 10 a.m.
About 1.2 kg of feed was fed to the fishes [average individual fish weight 2 kg] twice a day, in the morning at 9 am and in the afternoon at 3 pm. The calculation of feed dosage is based on 3 % of fish weight. The commercial food manufactured by Fwusow Industry Co. Ltd was used. The feed ingredients consisted of wheat flour, fish meal, shrimp meal, scallop meal, wheat germ, krill meal, yeast powder, β-carotene, lecithin, L-lysine, DL-methionine, fish oil, vitamin A, vitamin D3, vitamin C , vitamin E, riboflavin, biotin, folic acid, calcium pantothenate, calcium phosphate, choline chloride, niacin, para-aminobenzoic acid, ferrous sulfate, manganese oxide, copper sulfate, zinc oxide, magnesium sulfate, cobalt sulfate [nutrition composition, see Table 2].
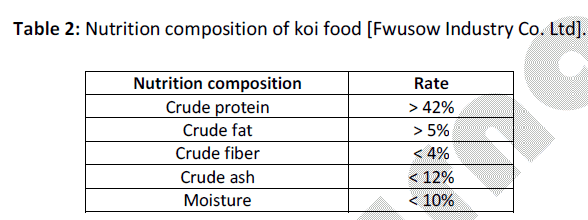
Table 2: Nutrition composition of koi food [Fwusow Industry Co. Ltd].
Biochemical oxygen demand [BOD] test
BOD analysis was conducted to determine the rate at which oxygen is used by microorganisms in decomposing organic matter. The method consists of filling with sample, to overflowing, an airtight bottle of a 30 mL blank bottle and incubating it at the specified temperature 20°C for 5 days. Dissolved oxygen [DO] is measured initially and after incubation, using a DO meter. The BOD is computed from the difference between initial and final DO as shown in the equation below [16]. Since the initial DO was determined shortly after the dilution was made, all oxygen uptakes occurring after this measurement included in the BOD measurement.
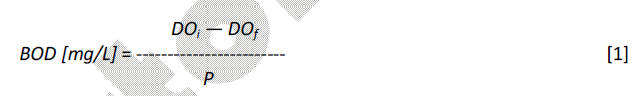
Where DOi = DO of diluted sample immediately after preparation [mg/L], DOf = DO of diluted sample after 5 days incubation at 20°C [mg/L], P = Decimal volumetric fraction of sample used.
Total suspended solids [TSS] test
TSS was done to determine the bio-filter efficiency on trapping suspended solids inside the system. A wellmixed sample is filtered through a weighed standard glass-fiber filter and the residue retained on the filter is dried to a constant weight from 103°C to 105°C. The increase in weight of the filter represents the total suspended solids. If the suspended material clogs the filter and prolongs filtration, it may be necessary to increase the diameter of the filter or decrease the sample volume. To obtain an estimate of total suspended solids, the difference between total dissolved solids and total solids is calculated using the equation as shown below [16].

Where A = weight of filter + dried residue [mg], B = weight of filter [mg].
BOD
The biochemical oxygen demand [BOD] determination has generally been recognized as the most appropriate and sensitive test for detection and measurement of pollution. It has long been adopted as the most trustworthy chemical index of the actual state of a stream [17]. It has been found that if the BOD figures do not exceed 4 mg/L the water is free from signs of pollution. The Royal Commission's well known classification of rivers according to BOD values was found to be applicable in waters in Malaysia [18] [see Table 3].
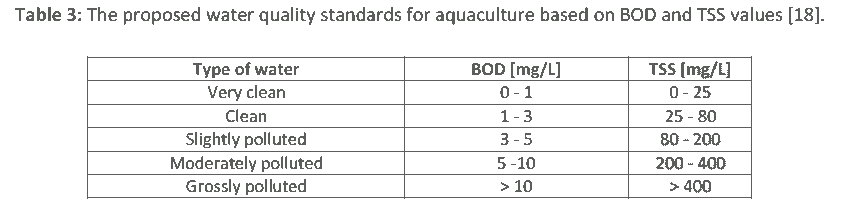
Table 3: The proposed water quality standards for aquaculture based on BOD and TSS values [18].
Data collected from the test presented in Table 4, represent the outcome of the test during seven days observation. Prior to the installation of the bio-filter [Day 0], the BOD value was high [90 mg/L] and this condition is classified as grossly polluted according to water quality standards for aquaculture [see Table 3]. This resulted in a high concentration of organic compound inside the pond. This condition would encourage the microorganism inside the pond to do their job by decomposing the organic matter into non-harmful substances. This activity requires the microorganisms to consume a lot of oxygen thus, lowering the dissolved oxygen level and increasing the BOD.
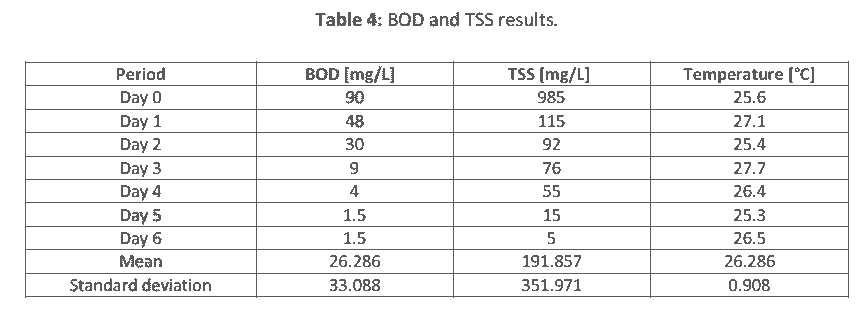
Table 4: BOD and TSS results.
On the first day the bio-filter was installed and operated [Day 1], BOD decreased to 48 mg/L. At this point, the microorganisms were grown in the filter to decompose the organic matter, resulting in the reduction of the concentration of the organic matter, as well as the BOD value. This is due to the reduction of the organic matter, resulting in less activity by microorganisms and less oxygen consumption. On the third and fourth day, the bio-filter efficiency was proven when the BOD values dropped from 9 mg/L to 4 mg/L. At this point, the water condition is classified as moderately and slightly polluted. Later, the BOD value decreased to 1.5 mg/L on the fifth as well as on the sixth day and this is classified as clean. Thus, the bio-filter was proven to be efficient enough to provide appropriate surface area for nitrifying bacteria to colonize and populate.
TSS
The suspended solids are very objectionable in water for many reasons. Mineral and organic suspended matters can lead to silting and by blanketing the river/sea bed causing destruction of plant and animal. Furthermore, gritty material may cause physical injuries to fish [19].
Data collected from the test presented in Table 4 represent the outcome of the test when TSS was observed for seven days. Before the bio-filter began its operation [Day 0], the TSS value was high [985 mg/L] and condition is classified as grossly polluted according to Water Quality Standards for Aquaculture [see Table 3]. This was due to the high concentration of organic matter as well as the suspended solids inside the pond. On the first day [Day 1] the bio-filter was switched on and started to operate and the second day [Day 2], the TSS decreased to 115 mg/L. This figure showed that a lot of suspended solids were removed from the pond thus improving the water quality, being classified as slightly polluted.
Later, the TSS inside the pond continued to decrease down from 76 mg/L on the third day to 5 mg/L on the sixth day. These values fall under the very clean designation based on Water Quality Standards for Aquaculture. Thus, the bio-filter was proven to be efficient enough to remove suspended solids inside the pond and transform the water condition from ‘grossly polluted’ to `very clean'. Therefore, the bio-filter functioned well and fulfilled its desired intention.
The floating micro-bead bio-filter harbors and contains desired microorganisms that could decompose organic matter and convert it into non-harmful substance for the fish. It can be used to replace the twin requirement of a mechanical filter and biological filter. The re-circulating and backwash system proposed in this study could save the water loss during backwash. Water loss during backwash was replaced by about 20% of new clean water. According to these study results [TSS and BOD], with the present fish stocking density and feeding rate, the application of the bio-filter was effective in controlling, maintaining and defending water quality. Besides, the use of bio-filter is reasonable for the farmers due to its low price. The polyethylene used as the filter media could extend the shelf life, of the media, compared to other media such as sand. Therefore, this filter could be implemented in aquaculture for freshwater breeds in Malaysia and other countries. Nevertheless, further studies should assess its efficacy under more intensive aquaculture conditions and conducted on this filter to provide more convenient equipment to the user. For example pH, temperature, and dissolve oxygen indicators could be attached to the filter to allow all these variables to be monitored and controlled.
Authors declare that they have no competing interests.
All authors contributed equally to this work.